

Abstract
Understanding gene regulatory networks (GRNs) is crucial for deciphering cellular heterogeneity and the mechanisms underlying development and disease. However, current GRN inference methods fail to utilize multi-omics data and prior knowledge from a biologically interpretable insight. Therefore, we propose PRISM-GRN, a Bayesian model that seamlessly incorporates known GRNs, along with scRNA-seq and scATAC-seq data, into a probabilistic framework to reconstruct cell type–specific GRNs. PRISM-GRN employs a biologically interpretable architecture firmly rooted in the established gene regulatory mechanism, which asserts that gene expression is influenced by TF expression levels and gene chromatin accessibility through GRNs. Accordingly, PRISM-GRN decomposes observable data into biologically meaningful latent variables through a mechanism-informed generation process and a prior-GRN-primed inference process, enabling precise and robust GRN reconstruction. We evaluate PRISM-GRN on four benchmarking data sets with paired scRNA-seq and scATAC-seq data, demonstrating its superior performance over seven baseline methods in GRN reconstruction, especially its higher precision under the inherently imbalanced scenario in which the true regulatory interaction is sparse. Furthermore, benchmarking on directed GRNs highlights PRISM-GRN's ability to capture causality in gene regulation derived from the biologically interpretable architecture. More importantly, PRISM-GRN performs well with unpaired omics data and limited prior GRN information, showcasing its flexibility and adaptability across various biological contexts. Finally, biological analyses on PBMC data sets demonstrate PRISM-GRN's potential to facilitate the identification of cell type–specific or context-specific GRNs across broader real-world biological research applications. Overall, PRISM-GRN provides a novel paradigm for precise, robust, and interpretable exploration of causal GRNs with prior knowledge and multi-omics data.
Gene regulatory networks (GRNs), which encapsulate the complex interactions among transcription factors (TFs), target genes, and various regulatory elements, constitute the core machinery of gene regulation (Levine and Davidson 2005; Chen and Rajewsky 2007). The intricate mechanisms underlying gene regulation form the basis for cellular function and behavior (Karlebach and Shamir 2008). Epigenetic modifications influence chromatin structure and accessibility, mutually affecting TF binding and the assembly of GRNs, which ultimately drive diverse transcriptional outcomes across different cell types (Kouzarides 2007; Lee and Young 2013). Therefore, elucidating cell type–specific GRNs is essential for advancing our understanding of cellular processes such as differentiation, development, and disease pathogenesis (Carthew 2021; Kim and Wysocka 2023).
Early efforts to recover GRNs relied on experimental validation, such as chromatin immunoprecipitation followed by sequencing (ChIP-seq) (Park 2009). Although these approaches provide high-confidence data, they are costly, time-consuming, and limited in scale, making it difficult to comprehensively map GRNs (Badia-i-Mompel et al. 2023). High-throughput RNA sequencing (RNA-seq), which enables genome-wide analysis of the cellular transcriptome on bulk cells (Ozsolak and Milos 2011), has revolutionized GRN inference by enabling the computational derivation of regulatory networks from gene expression data (Pratapa et al. 2020). Initial methods primarily rely on correlation or mutual information to infer regulatory interactions. For instance, weighted gene coexpression network analysis (WGCNA) (Langfelder and Horvath 2008) clusters coexpressed genes into modules to construct gene associations. To improve accuracy and efficiency, machine learning–based methods have been introduced. Genie3 (Huynh-Thu et al. 2010) and GRNBoost2 (Moerman et al. 2019) use tree-based ensemble methods and support vector machines, respectively, to infer regulatory networks, capturing nonlinear interactions and producing directed GRNs by manually distinguishing TFs from target genes. More recently, deep learning has been introduced into GRN inference, with methods such as CNNGRN, which leverages convolutional neural networks to analyze bulk time-series gene expression data and infer regulatory interactions between TFs and target genes (Gao et al. 2023).
Single-cell RNA sequencing (scRNA-seq) enables gene expression profiling at the individual cell level, revealing cellular heterogeneity with single-cell resolution and significantly enhancing the understanding of cell type–specific gene regulation (Chen and Liu 2022; Kartha et al. 2022). However, the inherent high noise levels and frequent dropout events in single-cell data have driven the development of more specialized methods tailored to address these challenges (Aibar et al. 2017; Chen et al. 2021; Atanackovic et al. 2023; Wang et al. 2024c). For instance, DynGFN (Atanackovic et al. 2023) incorporates a Bayesian dynamic structure to model the posterior distribution over cyclic GRNs from single-cell data, effectively capturing complex structural uncertainties in single-cell data. Additionally, the integration of prior biological knowledge has substantially improved GRN inference. Curated databases, such as TRUST (Han et al. 2018), ChEA3 (Keenan et al. 2019), and ChIP-Atlas (Oki et al. 2018), offer experimentally validated TF–gene interactions that serve as a solid foundation for supervised approaches. GeneLink (Chen and Liu 2022) introduces a graph attention network (GAT) for supervised link prediction in GRN inference, leveraging scRNA-seq data and existing regulatory information to predict latent TF–gene interactions. Similarly, Grace (Wang et al. 2024a) integrates structural causal models with graph neural networks to infer both GRNs and gene causality from scRNA-seq data. Nevertheless, although these methods successfully utilize prior data and infer cell type–specific GRNs, they tend to overlook chromatin-level regulatory mechanisms, such as chromatin accessibility (Kim et al. 2023).
Chromatin accessibility highlights potential TF binding sites for target genes (Isbel et al. 2022), enabling the investigation of GRN from epigenomic landscapes (Loers and Vermeirssen 2024). Single-cell ATAC sequencing (scATAC-seq) technologies can identify chromatin accessibility profiles at the unprecedented resolution of the single-cell level (Fang et al. 2021; Chen et al. 2022). In particular, single-cell multi-omics technologies like SHARE-seq (Ma et al. 2020) can simultaneously profile transcriptomic and epigenomic data within individual cells, enabling the interrogation of cellular heterogeneity and molecular hierarchy (Cao et al. 2024). Consequently, numerous methods have emerged to recover GRNs by integrating multi-omics data. scAI (Jin et al. 2020) combines sparse epigenomic signals with transcriptomic information by matrix factorization, enabling the discovery of regulatory relationships within a unified low-dimensional representation of cells. Similarly, scREG (Duren et al. 2022) introduces the concept of cis-regulatory potential to infer subpopulation-specific GRNs, achieving significantly higher accuracy compared with correlation-based methods. CellOracle (Kamimoto et al. 2023) enables GRN inference by integrating single-cell multi-omics data with prior regulatory knowledge, reconstructing cell type–specific networks and allowing in silico T perturbations to reveal dynamic regulatory mechanisms. The knowledge-primed model SupirFactor (Tjärnberg et al. 2024) embeds the prior GRN directly into deep learning architectures, enabling biologically interpretable GRN predictions while capturing higher-order regulatory interactions through explained relative variance metrics. Nevertheless, despite these advances, these methods struggle to elucidate these biological factors derived from multi-omics from a perspective in an interpretable way, thereby limiting their capacity to infer GRNs when lacking constraints from regulatory mechanisms.
Therefore, in this paper, we propose PRISM-GRN, a probabilistic Bayesian model designed to recover cell type–specific GRNs using a biologically interpretable architecture based on single-cell multi-omics data. Gene regulatory mechanism dictates that gene expression is influenced by TF expression and chromatin accessibility through TF–gene interactions. Accordingly, PRISM-GRN integrates validated cell type–specific prior GRNs with scRNA-seq and scATAC-seq data into a probabilistic framework grounded in this mechanism, forming a biologically interpretable architecture. Through a mechanism-informed generation process and a prior-GRN-primed inference process, PRISM-GRN decomposes observable data into biologically meaningful latent variables, enabling precise and robust reconstruction of cell type–specific regulatory relationships. PRISM-GRN can perform tasks of both GRN construction and causality prediction with different supervising strategies across broad biological research scenarios.
Results
The framework of PRISM-GRN
As illustrated in Figure 1A, TFs bind to their specific target genes, thereby forming cell type–specific GRNs. In conjunction with TF expression levels and the chromatin accessibility of target genes, these GRNs drive the emergence of diverse cellular phenotypes through complex regulatory mechanisms. Motivated by such established principles of gene expression, we proposed PRISM-GRN, a probabilistic Bayesian model for reconstructing cell type–specific GRNs based on single-cell multi-omics. Based on the aforementioned gene expression principle, PRISM-GRN incorporates a biologically interpretable architecture into the probabilistic framework, which is shown in Figure 1B. By integrating gene expression profiles, chromatin accessibility data, and prior GRNs, PRISM-GRN decomposes the observable expression of each gene into latent variables that capture the unobserved contributions of its regulatory factors. This is achieved through a regulation mechanism–informed variational inference process, enabling the precise reconstruction of cell type–specific GRNs.
The framework of PRISM-GRN. (A) The motivation of PRISM-GRN. Within the same cell type, a gene's expression is influenced by the expression levels of the TF targeting it and the accessibility of its chromatin through the cell type–specific GRN. This regulatory mechanism shapes distinct gene expression patterns, ultimately defining the cellular phenotype with different states and functional identities. (B) The variational inference process. PRISM-GRN models the generation of gene expression as a Dirichlet-multinomial distribution, integrating three key latent variables: expression-related factor zExp, chromatin accessibility-related factor zAcc, and regulatory interaction–related factor zGRN. These latent variables are inferred from observed data and structured by biological mechanisms. The generative process reconstructs expression levels and GRNs based on these factors, ensuring PRISM-GRN adheres to regulatory principles. (C) Performance evaluations of PRISM-GRN. PRISM-GRN's performance on recovering GRNs and capturing causality was comprehensively evaluated and compared with the baseline methods. The robustness of PRISM-GRN was further validated by its strong performance with limited prior knowledge and unpaired omics data. Additionally, downstream biological analyses were conducted to highlight PRISM-GRN's real-world efficacy in improving the understanding of gene functions and finding GRNs.
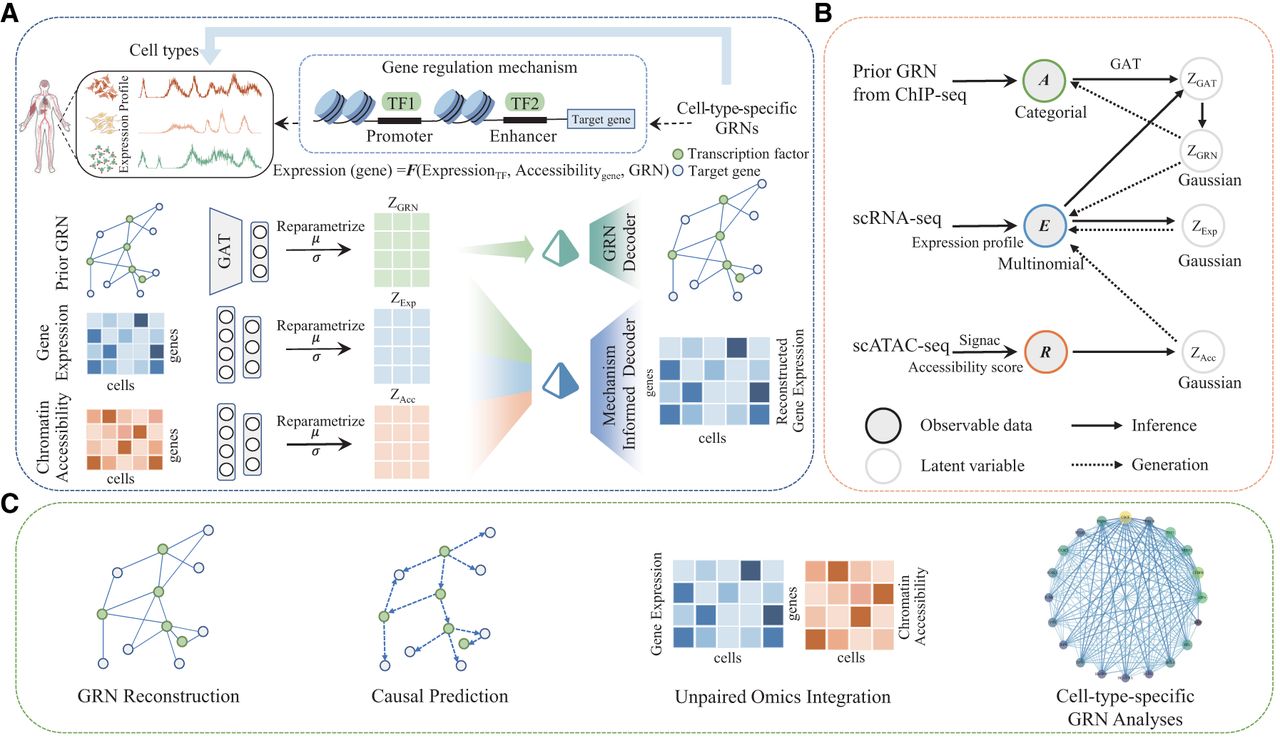
More specifically, for a given cell type–specific data set, the input of PRISM-GRN includes the gene expression profile E ∈ ℝM × N from scRNA-seq; the chromatin accessibility score profile R ∈ ℝM × N from scATAC-seq, where M is the number of genes and N is the number of cells; and a binary adjacency matrix A ∈ {0, 1}M × M representing a cell type–specific prior GRN G sourced from a public database. The adjacency matrix of the prior GRN, where Aij = 1 indicates the presence of a known regulatory interaction between gene i and gene j, and Aij = 0 indicates an unknown regulatory interaction, also acts as the prior knowledge to inform the prior distributions of GRN connectivity across genes during the inference process. More details of preprocessing procedures are provided in Supplemental Content S1. The output of PRISM-GRN is a reconstructed GRN G′, for which the unknown regulatory interactions between the given genes are predicted.
The mechanism-informed variational process ensures the model's flexibility in capturing complex regulatory interactions while adhering to biological principles. Constrained and guided by the biological mechanism–informed generative process, PRISM-GRN can achieve greater precision and interpretability in reconstructing GRNs. As shown in Figure 1C, comprehensive benchmark experiments were conducted to demonstrate the efficacy of PRISM-GRN in reconstructing GRNs and predicting causality. Experiments on data sets with unpaired omics data and limited prior GRN information were performed to demonstrate PRISM-GRN's adaptability across diverse real-world biological contexts. Finally, practical applications and biological analyses reveal that PRISM-GRN facilitates the identification of cell type–specific or context-specific regulatory relationships and core regulators under different biological research scenarios.
Baselines
In this paper, we proposed PRISM-GRN, a probabilistic Bayesian model designed to recover cell type–specific GRNs. To evaluate the effectiveness of PRISM-GRN in GRN recovery, we benchmarked it against seven baseline methods, including two unsupervised methods (GENIE3 [Huynh-Thu et al. 2010] and GRNBoost2 [Moerman et al. 2019]), two supervised methods (GeneLink [Chen and Liu 2022] and Grace [Wang et al. 2024a]), and three multi-omics methods (scAI [Jin et al. 2020], CellOracle [Kamimoto et al. 2023], and SupirFactor [Tjärnberg et al. 2024]). Among these methods, GENIE3 and GRNBoost2 rely solely on scRNA-seq data, as do GeneLink and Grace, although the latter two require prior GRNs as part of their supervised training process. In contrast, scAI, CellOracle, SupirFactor, and PRISM-GRN integrate both scRNA-seq and scATAC-seq data for GRN inference. Notably, SupirFactor, as an unsupervised method, also requires the same prior GRNs as architectural constraints to guide model structure to get the explained relative variance. The details of the baseline methods are shown in Supplemental Table S1. All baseline methods were implemented using default configurations to ensure consistency and reproducibility, whereas the default hyperparameters of PRISM-GRN were selected using a grid search and are presented in Supplemental Table S2.
Data set description and experimental designs
We used four data sets with paired scRNA-seq and scATAC-seq data to benchmark PRISM-GRN against seven baseline methods, evaluating their performance in GRN reconstruction and causality detection. These data sets include the cultured human cell lines A549 (Cao et al. 2018), GM12878 (Ma et al. 2020), and K562 (Ma et al. 2020), as well as the mouse cell line 3T3 (Ma et al. 2020) with homogeneous cells. Four data sets with unpaired scRNA-seq and scATAC-seq data, including two benchmark data sets, A549 and GM12878, and two additional data sets, human embryonic stem cells (hESCs) (Chu et al. 2016; Samara et al. 2022) and mouse embryonic stem cells (mESCs) (Hayashi et al. 2018; Zamanighomi et al. 2018), were used to assess PRISM-GRN's capability to recover GRNs with incomplete data modalities. The detailed information of the benchmark data sets is summarized in Table 1, including the cell number, TF number, gene number, ground-truth GRN number, and reference genome, as well as the data source. Notably, although the hg19 (GRCh37) reference genome was used in this study, the conclusions are not significantly affected by the choice of assembly, such as hg38 (GRCh38) or a more recent genome assembly, because our analyses depend on gene-level features rather than assembly-specific coordinates, and the benchmarking data sets include genes that are consistently annotated across both assemblies.
The details of the benchmark data sets
| Data sets | Pairing | Cells | TFs | Genes | GRN | Genome | GEO |
|---|---|---|---|---|---|---|---|
| A549 | Paired | 3260 | 113 | 1245 | 15,066 | hg19 | GSE117089 |
| GM12878 | Paired | 2444 | 171 | 1456 | 42,174 | hg19 | GSE140203 |
| K562 | Paired | 4846 | 480 | 1955 | 103,432 | hg19 | GSE140203 |
| 3T3 | Paired | 2161 | 22 | 870 | 3671 | mm10 | GSE140203 |
| A549-rep | scATAC | 8596 | 113 | 1245 | – | hg19 | GSE211617 |
| GM12878-rep | scATAC | 9865 | 171 | 1456 | – | hg19 | GSE140203 |
| hESC | scRNA | 758 | 26 | 1157 | 5022 | hg19 | GSE75748 |
| scATAC | 4683 | 26 | 1157 | hg19 | GSE192858 | ||
| mHSC | scRNA | 421 | 45 | 558 | 10,009 | mm9 | GSE98664 |
| scATAC | 190 | 45 | 558 | mm9 | GSE107651 |
For each benchmark data set, cell type–specific prior GRNs were derived from ChIP-seq data archived in the ChIP-Atlas database (Oki et al. 2018), which is a large-scale integrative platform that aggregates and curates publicly available ChIP-seq and related epigenomic data sets. ChIP-Atlas annotates experiments with detailed metadata, including cell type or cell line, and aggregates peak-calling results to offer cell type–specific binding profiles, thereby providing a reliable ground truth for evaluating GRN inference methods. The ground-truth TF–gene regulatory interactions were divided into training and test sets as the positive samples. Specifically, 90% of the interactions were used for training to provide prior knowledge, whereas the remaining 10% were held out as positive gold standards for evaluation. To incorporate high-confidence negative samples, following the method of Zou et al. (Wang et al. 2024a), for each transcription factor TFi and all its known target genes Genej, unobserved regulatory pairs (TFi, GeneNT), where GeneNT denotes genes not targeted by TFi, were sampled as negative samples and split between training and test sets at the same 9:1 ratio. Additionally, to mitigate overfitting and optimize model performance, one-ninth of the training set was randomly selected as a validation set.
PRISM-GRN, along with supervised baseline methods including GeneLink and Grace, was trained on the same training set and evaluated on the corresponding test set. In contrast, unsupervised methods were directly evaluated on the test set for each data set. As shown in Table 1, with the relatively sparse known regulatory interactions, GRN reconstruction is inherently a highly imbalanced classification task; therefore, multiple evaluation metrics were employed. The area under the receiver operating characteristic curve (AUROC) and the area under the precision-recall curve (AUPRC) were used as primary metrics to assess model performance. Additionally, accuracy, precision, recall, and F1-score were included to provide a more comprehensive evaluation. Detailed descriptions of these metrics are provided in Supplemental Content S2.
PRISM-GRN outperforms baseline methods in GRN reconstruction
We first evaluated the performance of PRISM-GRN in reconstructing undirected GRNs, a task naturally formulated as a highly imbalanced binary classification problem, in which the number of noninteracting gene pairs (negative class) is roughly 100 times greater than that of true regulatory interactions (positive class). Specifically, we compared PRISM-GRN against seven baseline methods on four benchmark data sets with paired scRNA-seq and scATAC-seq data. Following the aforementioned training strategy, the supervised methods, including PRISM-GRN, Grace, and GeneLink, were trained on the same training set, whereas the unsupervised methods, including GENIE3, GRNBoost2, scAI, CellOracle, and SupirFactor, were directly evaluated on the same test set without a training phase.
Given the extreme class imbalance, we prioritized the AUPRC as the primary evaluation metric, as it more accurately reflects performance in identifying rare but meaningful regulatory interactions. As illustrated in Figure 2, PRISM-GRN consistently outperforms all baseline methods across all four benchmark data sets, achieving a mean AUPRC of 0.476. This is a substantial improvement over the supervised methods, including the second-best method, GeneLink, which achieves a mean AUPRC of 0.322, and the third-best, Grace, at 0.263. In contrast, the unsupervised methods, especially those relying on multi-omics input, are more vulnerable to noise and low sequencing quality. For instance, both scAI and CellOracle achieve an AUPRC of approximately 0.004 on the 3T3 data set. The superiority on AUPRC highlights PRISM-GRN's capability to recover true regulatory relationships even when they are vastly outnumbered by negatives. This capability is critical in real-world GRN inference tasks, in which identifying a small number of biologically meaningful interactions from a vast candidate space is the norm.
The performance comparison of PRISM-GRN with the baseline methods on the benchmark data sets in GRN reconstruction. The AUROC and AUPRC metrics are used to evaluate the performance, and the results demonstrate that PRISM-GRN outperforms the baseline methods across all data sets.
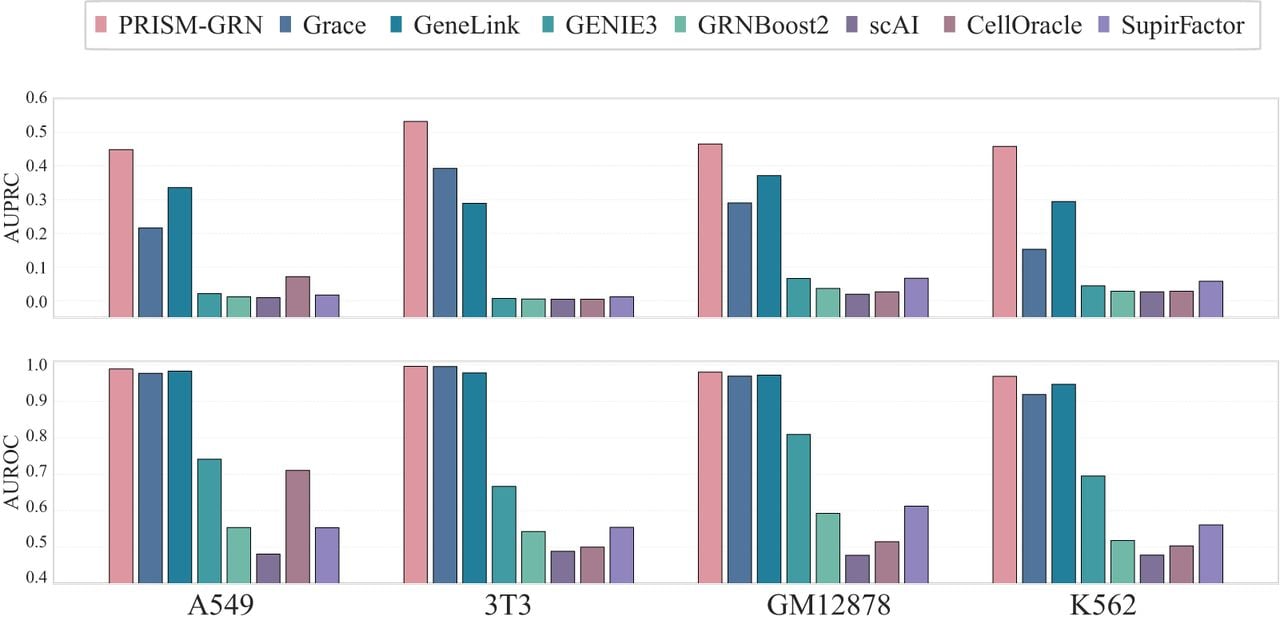
For completeness, we also report AUROC results. All supervised methods achieve high AUROC scores above 0.9, with PRISM-GRN again leading at a mean AUROC of 0.984, followed by GeneLink, which achieves 0.970, and Grace, which achieves 0.964. Similar to the results shown by AUPRC, the unsupervised methods show relatively poor performance. This can be attributed to their sensitivity to weak or noisy expression and chromatin accessibility values, which leads to difficulty in separating true regulatory relationships from noise.
Detailed metrics, including accuracy, precision, recall, and F1, were used to more comprehensively evaluate the performance of PRISM-GRN and the baseline methods. As listed in Supplemental Table S3, the results further highlight the effectiveness of PRISM-GRN in dealing with class imbalance. PRISM-GRN's advantage in AUPRC is largely driven by its high precision, with a mean precision of 0.634, which reflects a low false-positive rate. This is critical in biological validation, in which experimental resources are limited, and only high-confidence predictions are actionable. Although GeneLink and Grace maintain competitive AUROC scores and achieve higher recall scores, their precision on rare positive events is significantly lower, leading to a drop in AUPRC and suggesting a tendency to generate more false positives.
We adopted a commonly used distance threshold of ±2000 bp from the transcription start site (TSS) to construct the ground-truth GRNs in cell type–specific benchmark data sets. To assess the sensitivity of PRISM-GRN to this heuristic, we additionally constructed alternative ground-truth GRNs using stricter proximity thresholds of ±1500 bp, ±1000 bp, and ±500 bp. We then evaluated PRISM-GRN alongside seven baseline methods on the GRN reconstruction task, using each of these ground-truth variations. As shown in Supplemental Figure S1, PRISM-GRN consistently outperforms all baseline methods under both AUPRC and AUROC metrics across all data sets and threshold settings.
These results collectively demonstrate that PRISM-GRN not only outperforms all baseline methods across both AUPRC and AUROC but also shows remarkable robustness to data imbalance, species variation, and gene scale differences. Its biologically informed variational inference framework allows PRISM-GRN to effectively capture rare but functionally critical regulatory interactions, making it a powerful and practical tool for real-world GRN reconstruction from multi-omics single-cell data. The relatively poor performance of the unsupervised methods observed here, especially those based on multi-omics data, may be attributed to their sensitivity to input data quality and the lack of task-specific supervision; we further analyze their limitations and discuss their suitable application scenarios in the Discussion section.
PRISM-GRN captures causality in gene regulation
The variational inference used in PRISM-GRN can capture the GRN associations informed by the gene regulation mechanism; therefore, PRISM-GRN has enhanced ability in causality inference among genes. Here, we further evaluated the causality prediction performance of PRISM-GRN with the two supervised methods, Grace and GeneLink, which can also predict causality through training, on the four benchmark data sets with directional GRN ground truth. Specifically, for genes i and j, there are three causal probabilities: y = 1 if gene i regulates gene j; y = 2 if gene j regulates gene i; and y = 0 if no relationship exists between the genes. By using variational inference, we can easily adapt PRISM-GRN for a triple classification task by fixing the categorical distribution output number in the GRN decoder. For Grace and GeneLink, following the method of Zou et al. (Wang et al. 2024a), we configure their output layers to consist of three neurons, with a Softmax layer to produce probabilistic predictions.
As illustrated in Figure 3A, PRISM-GRN consistently outperforms both Grace and GeneLink across all evaluation metrics except recall. Notably, although PRISM-GRN lags in recall, it exhibits superior performance in AUROC and AUPRC, both of which are crucial indicators of overall predictive accuracy. Specifically, PRISM-GRN achieves an average AUROC of 0.988 and an average AUPRC of 0.730 across the four benchmark data sets. In comparison, GeneLink obtains an average AUROC of 0.952 and AUPRC of 0.528, whereas Grace lags further behind with an AUROC of 0.856 and AUPRC of 0.467. PRISM-GRN improves AUPRC by 38.3% over GeneLink and by 56.3% over Grace, demonstrating its superior ability to rank true regulatory interactions more effectively. Furthermore, PRISM-GRN achieves an average precision of 0.738, significantly outperforming GeneLink (0.446) and Grace (0.445), with an improvement of 65.5% and 65.9%, respectively. This substantial increase in precision further highlights PRISM-GRN's capability to accurately identify true regulatory interactions. Meanwhile, the performance metrics that were calculated using the weighted-average are presented in Supplemental Table S4, PRISM-GRN still outperforms all baseline methods across the data sets.
Performance evaluations on the causality prediction. (A) Performance comparisons of PRISM-GRN with the supervised methods, Grace and GeneLink, on the benchmark data sets, using comprehensive metrics including accuracy, precision, recall, F1, AUROC, and AUPRC. (B) The receiver operating characteristic (ROC) curves and precision-recall (PRC) curves for each class on the A549 data set, illustrating the detailed performance of PRISM-GRN and the baselines in causality prediction.
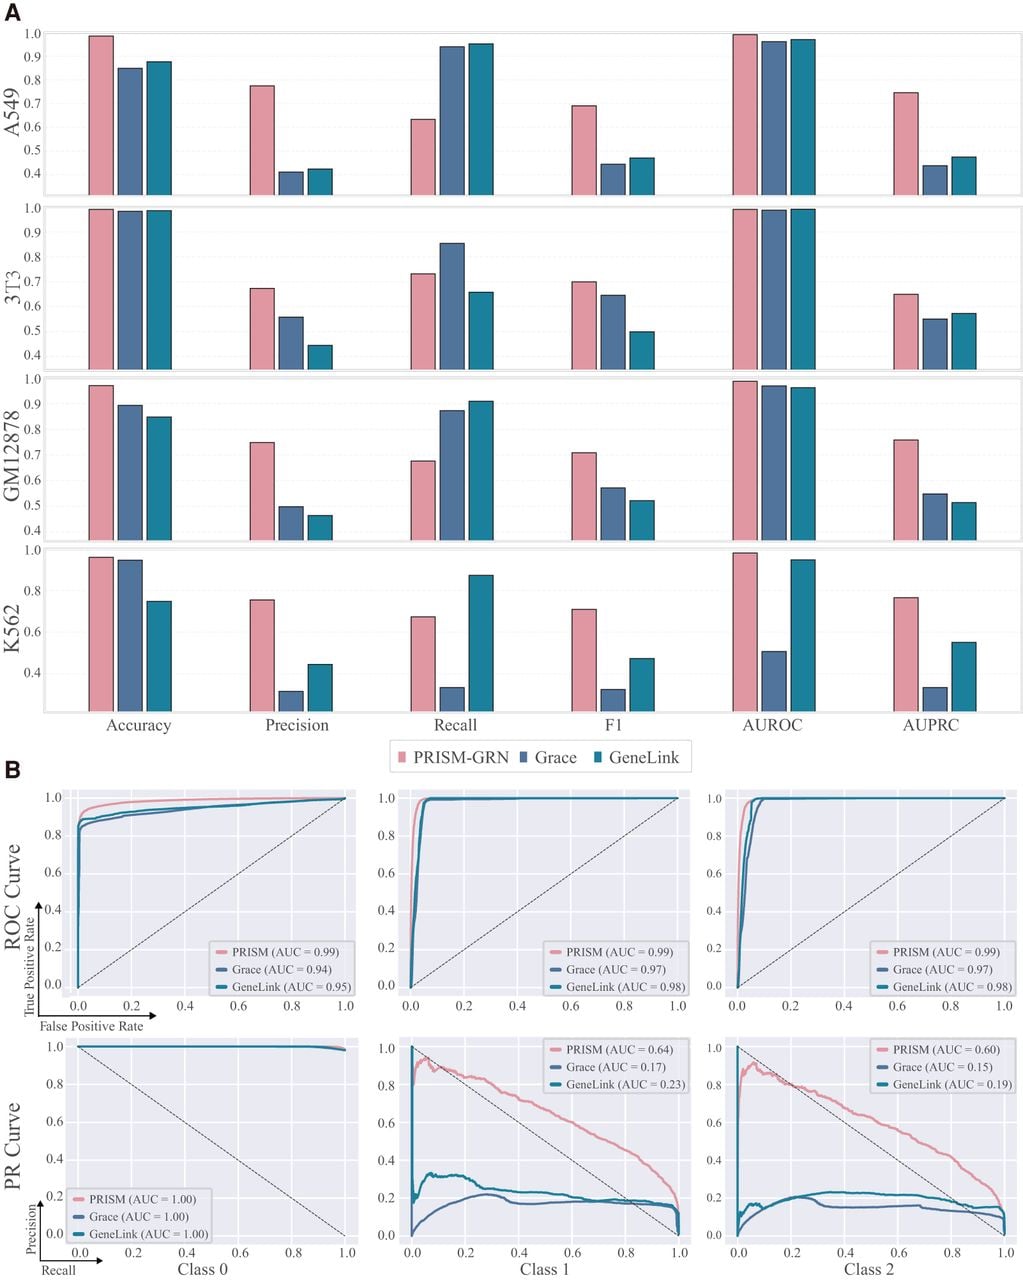
We further plotted the ROC and PRC curves for each data set and class individually to evaluate the ability to predict causality. As demonstrated in Figure 3B and Supplemental Figure S2, PRISM-GRN consistently outperforms the baseline methods in terms of AUC across all classes, demonstrating its robust performance in causal inference. Given the highly imbalanced nature of GRNs, in which the majority of gene pairs belong to the noninteracting 0 class, PRISM-GRN exhibits superior performance in precision-recall curves, particularly in smaller subclasses that contain regulatory interactions. Although Grace and GeneLink exhibit relatively low AUPRC values in these sparse gene classes, indicating their limited ability to identify true causal interactions, PRISM-GRN achieves AUPRC values of approximately 0.99 for larger, more noninteractions and 0.6 for smaller and sparser causal interactions.
We also benchmarked the causality prediction results of PRISM-GRN with the unsupervised method SCENIC+ (Bravo González-Blas et al. 2023). SCENIC+ constructs initial GRNs using coexpression-based algorithms such as GENIE3 or GRNBoost2 (which are also baselines) and then refines the network by integrating motif enrichment to enforce biologically informed constraints. However, instead of inferring regulatory directionality directly from data, it relies on a user-specified list of TFs to assign direction, which limits its utility for causal inference, especially when the TFs are unknown. In contrast, PRISM-GRN learns regulatory directionality in a data-driven manner without requiring prior specification of TFs.
To ensure a fair comparison between PRISM-GRN and SCENIC+, we constructed a subset of the test set consisting only of TF-to-target gene relationships. This subset matches the assumptions of SCENIC+, which treats all TFs as causal regulators, allowing us to assign directionality to its predictions by default. This benchmarking strategy isolates the direction-specific predictive power of each method and ensures that all models are evaluated under comparable conditions. As demonstrated in Supplemental Table S5, PRISM-GRN consistently outperforms both SCENIC+ and its base methods, GENIE3 and GRNBoost2, in recovering directed TF–gene interactions across all data sets and performance metrics, including AUROC, AUPRC, precision, recall, and F1-score. Although SCENIC+ achieves higher precision after motif-based filtering, the recall remains extremely limited, as it heavily relies on a predefined list of TFs and the presence of known motifs. In contrast, PRISM-GRN does not require known TF lists or motif annotations, highlighting its strong discriminative power and practical utility in causal GRN inference.
We further use CRISPR data sets to more comprehensively evaluate the predicted causality results of PRISM-GRN. Specifically, we utilized the Cancer Dependency Map (DepMap) data repository (Arafeh et al. 2025), which archives genome-wide CRISPR knockout screens across a wide range of human cancer cell lines. For each TF, DepMap identified its most significantly affected downstream genes based on gene expression changes upon TF knockout. Given that the CRISPR data sets and the benchmark data sets have different TFs and genes, we performed causality prediction on four data sets and obtained predicted TF–gene relationships on their respective test sets; the intersections of the TF–gene pairs present in both data sets were further selected for validation. As shown in Supplemental Table S6, among the overlapping gene pairs between the CRISPR and benchmark test sets, PRISM-GRN was able to recover most of the validated regulatory edges, further supporting the biological relevance and causal validity of our predictions. Also, the crossing validation using CRISPR data sets can further provide orthogonal evidence for PRISM-GRN's predicted causal edges.
Overall, these findings demonstrate that PRISM-GRN outperforms the supervised methods, Grace and GeneLink, and the unsupervised method, SCENIC+, in causal inference tasks. By leveraging variational inference, PRISM-GRN can capture hidden and less obvious causal relationships within sparse and complex GRNs. More importantly, in GRNs, many TFs simultaneously regulate other genes and are themselves regulated. PRISM-GRN's high performance in causal prediction enables it to identify potential directed regulatory relationships, even in the absence of prior specification of the TFs.
PRISM-GRN integrates unpaired omics data to reconstruct GRNs
PRISM-GRN utilizes a probabilistic framework for the reconstruction of cell type–specific GRNs, effectively integrating both scRNA-seq and scATAC-seq data, along with prior biological knowledge. By leveraging variational inference to approximate the posterior distribution of latent variables, PRISM-GRN effectively captures the underlying biological signals amid noise, ensuring robust integration of transcriptomic and epigenomic data. Notably, the mechanism-driven variational process decomposes gene expression into contributions from TFs that regulate it, the chromatin accessibility of its regulatory regions, and the TF–gene interactions. This structure allows PRISM-GRN to independently use scRNA-seq and scATAC-seq data, enhancing the utility of PRISM-GRN in a wide range of experimental settings, even in the absence of paired omics data, which is a common issue owing to experimental constraints.
To validate PRISM-GRN's ability to integrate unpaired omics data, we evaluated it on two benchmark data sets, GM12878 and A549, each containing independently obtained scATAC-seq data. Specifically, for GM12878, a replicate of the paired scATAC-seq data set from the same sequencing batch was used as the unpaired input. For A549, scATAC-seq data were derived from an entirely separate sequencing experiment. Additionally, we incorporated two widely studied cell lines, hESCs and mESCs, which are frequently used for GRN inference owing to the availability of curated prior networks. For these data sets, we utilized the processed scRNA-seq and prior GRNs from BEELINE (Pratapa et al. 2020), pairing them with independently sequenced scATAC-seq data from the same cell lines. In all cases, the scATAC-seq data were transformed into chromatin accessibility scores following a unified pipeline (see Methods) (Supplemental Content S2). Performance was evaluated using precision, AUROC, and AUPRC, in comparison with Grace and GeneLink, two supervised methods that have demonstrated secondary performance in benchmarks.
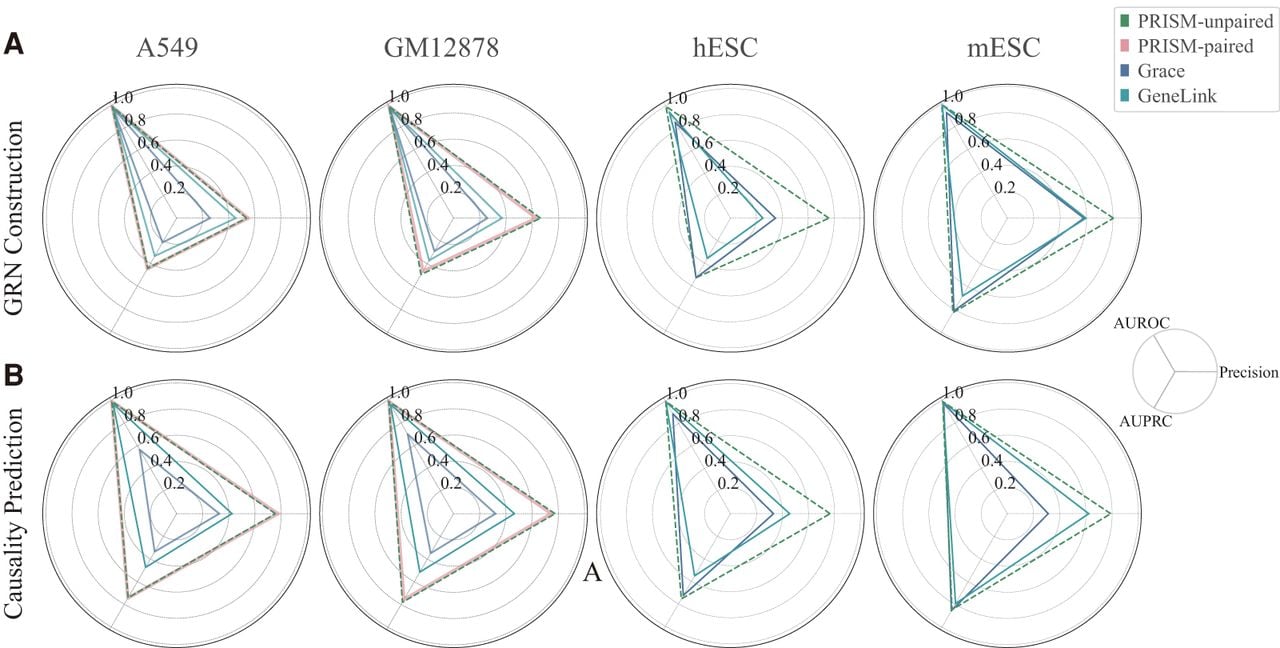
PRISM-GRN was evaluated in the tasks of GRN reconstruction (Fig. 4A) and causality prediction (Fig. 4B), and it consistently maintains stable and reliable performance, even in the absence of paired scRNA-seq and scATAC-seq data. In the A549 and GM12878 data sets, PRISM-GRN exhibits minimal performance degradation when using paired data sets for both GRN reconstruction and causality prediction tasks. Notably, in the GM12878 data set, in which the scATAC-seq data were derived from the same sequencing batch and included a greater number of cells, PRISM-GRN demonstrates superior performance when utilizing unpaired scATAC-seq data compared with paired omics data. Specifically, for the GRN reconstruction task, PRISM-GRN achieves an AUPRC of 0.495 with unpaired scATAC-seq data, outperforming the AUPRC of 0.465 obtained with paired data. Similarly, in causality prediction, PRISM-GRN achieves an AUROC of 0.780 with unpaired data, surpassing the AUROC of 0.758 achieved with paired data sets. More importantly, PRISM-GRN achieves a comparable performance with Grace and GeneLink, on AUROC and AUPRC across all four data sets, and still significantly outperforms them in precision when using the unpaired omics data, showcasing its superior capability in stably reconstructing casual GRNs.
Radar plots of performance comparisons on unpaired omics data sets using precision, AUROC, and AUPRC. (A) For GRN reconstruction, the radar plot shows the performance comparisons of PRISM-GRN using unpaired data on the A549 and GM12878 data sets, compared with results from paired data, as well as with Grace and GeneLink. On the hESC and mESC data sets that with no paired data, PRISM-GRN is compared with Grace and GeneLink. (B) For causality prediction, the radar plot illustrates the performance comparison of PRISM-GRN, Grace, and GeneLink on the same data sets. PRISM-GRN can achieve comparable results to those obtained with paired data and those obtained by Grace and GeneLink.
When integrating unpaired data sets, a key challenge is the batch effect introduced by unpaired scATAC-seq data. PRISM-GRN does not directly operate on raw peak-resolution scATAC-seq data. As described in the preprocessing section, we preprocess the ATAC data using Signac, which converts the high-resolution peak matrix into gene-level gene accessibility scores. Although this transformation would sacrifice some fine-scale chromatin accessibility information, it serves two critical purposes: (1) it enables direct alignment with scRNA-seq gene expression data, and (2) it reduces batch-specific artifacts arising from peak-calling inconsistencies and sequencing depth variations. By aggregating signals at the gene level, this preprocessing acts as a normalization step that smooths out noise and mitigates variability across batches. We further illustrate the impact of batch effects in Supplemental Content S3 and Supplemental Figure S3.
Overall, the Bayesian probabilistic framework allows PRISM-GRN to effectively handle unpaired omics data, providing a more comprehensive understanding of GRNs. This capability, combined with its robustness and accuracy in reconstructing cell type–specific regulatory networks, posits PRISM-GRN as a powerful tool for advancing the study of gene regulation. Its flexibility in integrating unpaired data without compromising performance makes it particularly valuable in scenarios in which paired data sets are difficult to obtain, enabling broader applications in genomics and single-cell research.
PRISM-GRN achieves robust performance with limited prior knowledge
For each cell type–specific data set, PRISM-GRN uses the prior knowledge, that is, the ChIP-seq-derived prior GRNs, as the GAT skeleton and positive samples to inform the prior distributions of GRN connectivity across genes during the variational inference. Therefore, we additionally evaluated the impact of prior knowledge on the performance of PRISM-GRN. In the previous benchmarking experiments, the known GRNs were split into training and test sets with a 9:1 ratio, with the dominant portion being used for training. In this section, we investigated how PRISM-GRN performs when the proportion of prior knowledge in the training set is gradually reduced, while increasing the proportion of the test set. We progressively decreased the fraction of prior knowledge by 5% intervals, starting from 90% down to 50%. Given the results from previous experiments, in which PRISM-GRN demonstrates strong performance in terms of precision, we focused on evaluating its sensitivity to the amount of prior knowledge using precision, AUROC, and AUPRC as key metrics.
As shown in Figure 5, A and B, PRISM-GRN demonstrates stable performance across the metrics in the task of GRN reconstruction and causality detection, despite the reduction in prior GRN knowledge and the increase in test set size. Specifically, as the proportion of prior knowledge decreases, PRISM-GRN maintains consistently outstanding performance, with AUROC remaining above 0.99 in both tasks. More importantly, when the imbalance in the data set becomes more pronounced, PRISM-GRN still achieves robust predictive performance. In GRN reconstruction, PRISM-GRN achieves an average AUPRC of 0.469 across all the proportions and data sets, whereas in causality prediction, it reaches an AUPRC of 0.764. Notably, the precision consistently exceeds 0.6 across different data sets, further emphasizing PRISM-GRN's stability in maintaining a low false-positive rate in highly imbalanced sets.
Performance evaluations with decreased prior knowledge. (A) Line plots showing the changes in precision, AUROC, and AUPRC across different data sets as the proportion of prior knowledge decreases from 0.9 to 0.5 with intervals of 0.05. PRISM-GRN maintains stable performance across all metrics during GRN reconstruction. (B) Line plots illustrating the changes in performance metrics for causality prediction. Similarly, PRISM-GRN maintains its performance even as prior knowledge decreases.
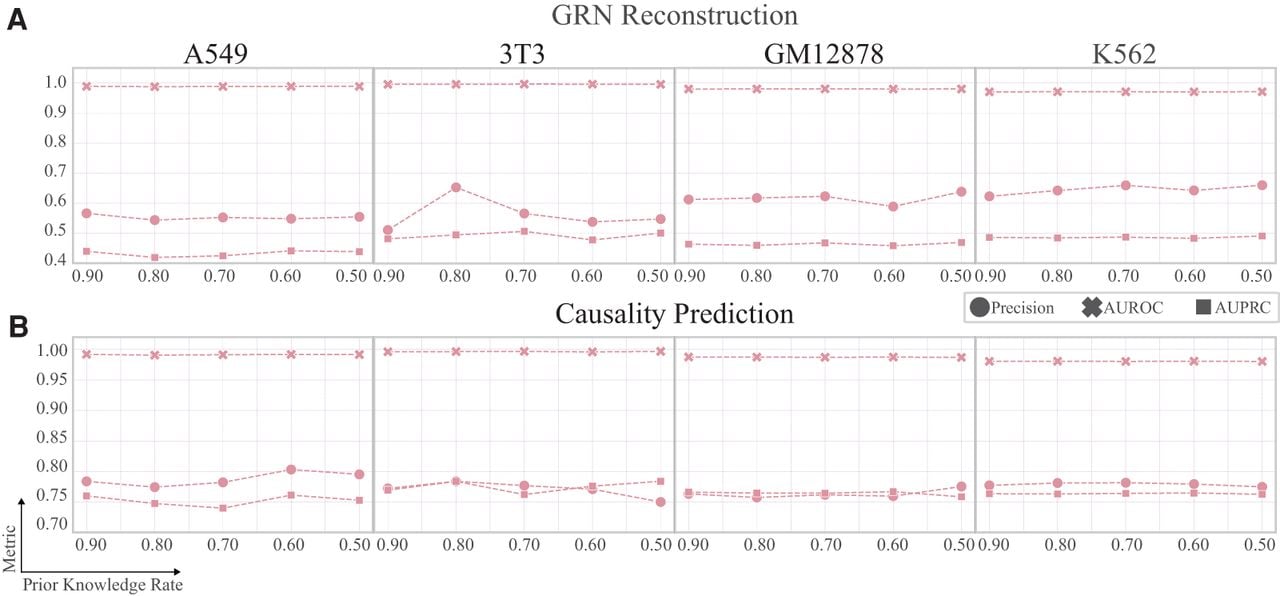
These results suggest that PRISM-GRN is not overly reliant on prior knowledge and can effectively identify regulatory interactions, making it a reliable tool for GRN reconstruction and causality inference, particularly in scenarios in which limited prior knowledge is available or in novel biological contexts in which prior data may be sparse. The ability of PRISM-GRN to effectively adapt to varying levels of prior knowledge ensures its applicability to a wide range of data sets and biological research tasks, further strengthening its potential for exploring gene regulatory mechanisms.
PRISM-GRN improves the understanding of gene functions
In PRISM-GRN, the latent variable zGRN is utilized to generate gene regulatory relationships through a categorical distribution, thereby refining the causal effects among genes. To further assess PRISM-GRN's capabilities, we analyzed the A549 data set by clustering genes using the Leiden algorithm (Traag et al. 2019) and visualizing the clusters with UMAP, based on both gene expression data and the embeddings of zGRN derived from the causal prediction task. As shown in Figure 6A, clustering based solely on gene expression results in limited distinction among genes. In contrast, clustering results using the trained zGRN embeddings reveals clearer heterogeneity among genes, indicating that these embeddings encapsulate more biological information (Fig. 6B).
Illustration of PRISM-GRN to improve understanding of gene functions. (A) UMAP plot of genes in the A549 data set based on the raw gene expression, colored by the Leiden clustering results. (B) UMAP plot of genes in the A549 data set based on the trained latent embeddings (zGRN), colored by the Leiden clustering results. (C) KEGG enrichment analysis results using all genes in the A549 data set. (D) KEGG enrichment analysis results using genes in cluster 0, highlighting more significant pathway terms compared with the analysis based on all genes.
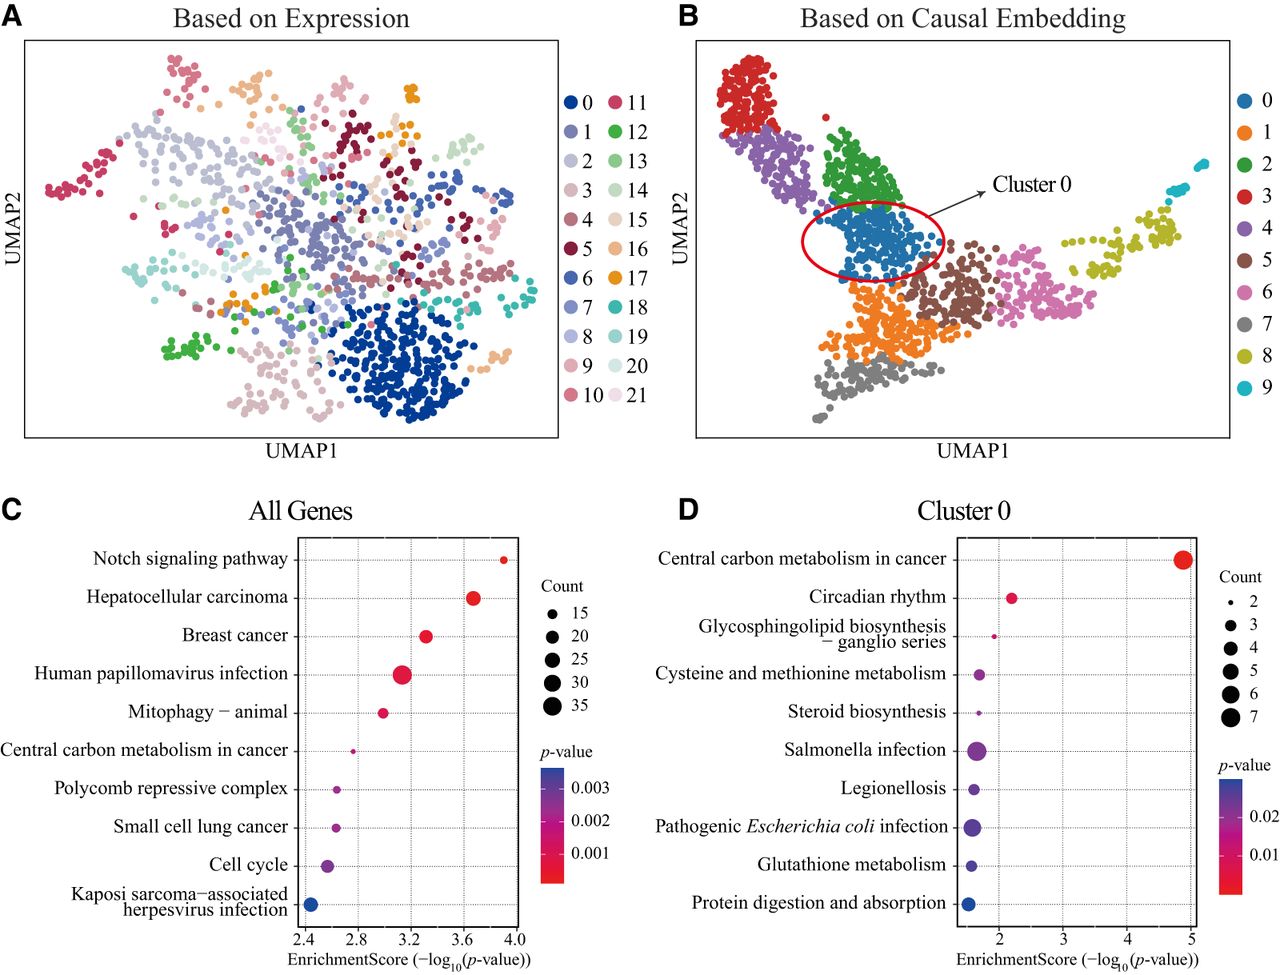
Considering that the analyzed genes are HVGs (Supplemental Content S1), we proceeded to perform KEGG and GO enrichment analyses on the entire gene set and on genes from cluster 0. As demonstrated in Figure 6, C and D, PRISM-GRN facilitated the identification of more significant KEGG enrichment results compared with analyses conducted directly on the highly variable genes. Notably, in the analysis of cluster 0, the most significantly enriched pathway identified was “central carbon metabolism in cancer,” which was not as prominent in the analysis of the entire gene set. A549 cells, as non-small-cell lung cancer cells, have been found to exhibit typical cancer metabolic features, including enhanced glycolysis and lactate fermentation, maintaining high levels of lactate production even under aerobic conditions (Liu et al. 2014; Sha et al. 2021). For the second-rank significantly enriched pathway, “circadian rhythm,” a pathway that is insignificant in the enrichment results based on the entire gene set, A549 cells have been proved to exhibit dysregulated expression of circadian rhythm–related genes such as TYMS, LGR4. These genes play crucial roles in regulating cellular processes like proliferation, migration, and invasion, suggesting that the “circadian rhythm” pathway is a key signaling pathway highly relevant to the gene functions of A549 cells (Xiang et al. 2018, Sun et al. 2024). Similarly, as shown in Supplemental Figure S4, the GO enrichment analysis of the specific gene sets in cluster 0 reveals additional functional terms, such as “regulation of pri-miRNA transcription by RNA polymerase II” and “epithelial cell development,” both of which are critically involved in the regulatory functions of A549 cells (Foster et al. 1998; Lin and Gregory 2015). The GO enrichment analysis results for genes from cluster 1 to cluster 9 are also illustrated in Supplemental Figure S5.
Beyond the analysis of latent variable, we also cross-validated the predicted directed interactions with those recorded in the TRRUST database (Han et al. 2018). To ensure consistency, we limited our analysis to the intersection of genes present in both data sets. As shown in Supplemental Table S7, PRISM-GRN successfully recovers nearly all TF–gene regulatory relationships overlapping with TRRUST (none of which were seen during training). Only two regulatory interactions were missed, highlighting PRISM-GRN's strong generalization ability and its robustness in recovering biologically meaningful, novel interactions.
These results demonstrate PRISM-GRN's effectiveness in capturing and utilizing latent biological information to enhance the interpretation of gene functions and regulatory mechanisms. Using the probabilistic framework and integrating prior knowledge, PRISM-GRN provides a more comprehensive understanding of gene interactions and their functions in complex biological processes.
PRISM-GRN finds cell type–specific gene regulators
We applied PRISM-GRN to reconstruct cell type–specific GRNs from the data set of human peripheral blood mononuclear cells (PBMCs) with paired scRNA-seq and scATAC-seq data, derived from 10x Genomics, in which the cells were annotated by Cao and Gao (2022). To ensure robust network reconstruction, we focused on the five cell types with the highest number of cells (CD4 naive T cells, CD8 naive T cells, CD14 monocytes, natural killer cells, and naive B cells) and incorporated cell type–specific prior knowledge (Fig. 7A). Notably, to assess the practical ability of PRISM-GRN in detecting cell type–specific regulators, we utilized all known GRNs derived from ChIP-seq data as prior knowledge and trained PRISM-GRN in the GRN reconstruction task. PRISM-GRN was then applied to complete GRNs by predicting the unknown regulatory interactions among genes.
Illustration of PRISM-GRN for finding gene regulators in cell type–specific GRNs. (A) UMAP plot of the top five cell types with the highest number in the PBMC data set based on the raw gene expressions. (B) Predicted GRN for CD4 naive cells, displaying the top 25 genes with the highest degree. The node color represents the betweenness centrality of genes in the predicted GRN, and node size reflects the degree of each gene. The color and size of the edges correspond to the probability assigned by PRISM-GRN in the predicted GRN. (C) GO enrichment analysis results for the 25 genes in CD4 naive cells. The FDR indicates the significance of enrichment, with P-values corrected for multiple testing using the Benjamini–Hochberg procedure. (Signal) Weighted harmonic mean of the observed/expected ratio and −log (FDR), (gene count) the number of proteins annotated with a particular term. The results highlight the genes as significant regulators associated with CD4 naive cells.
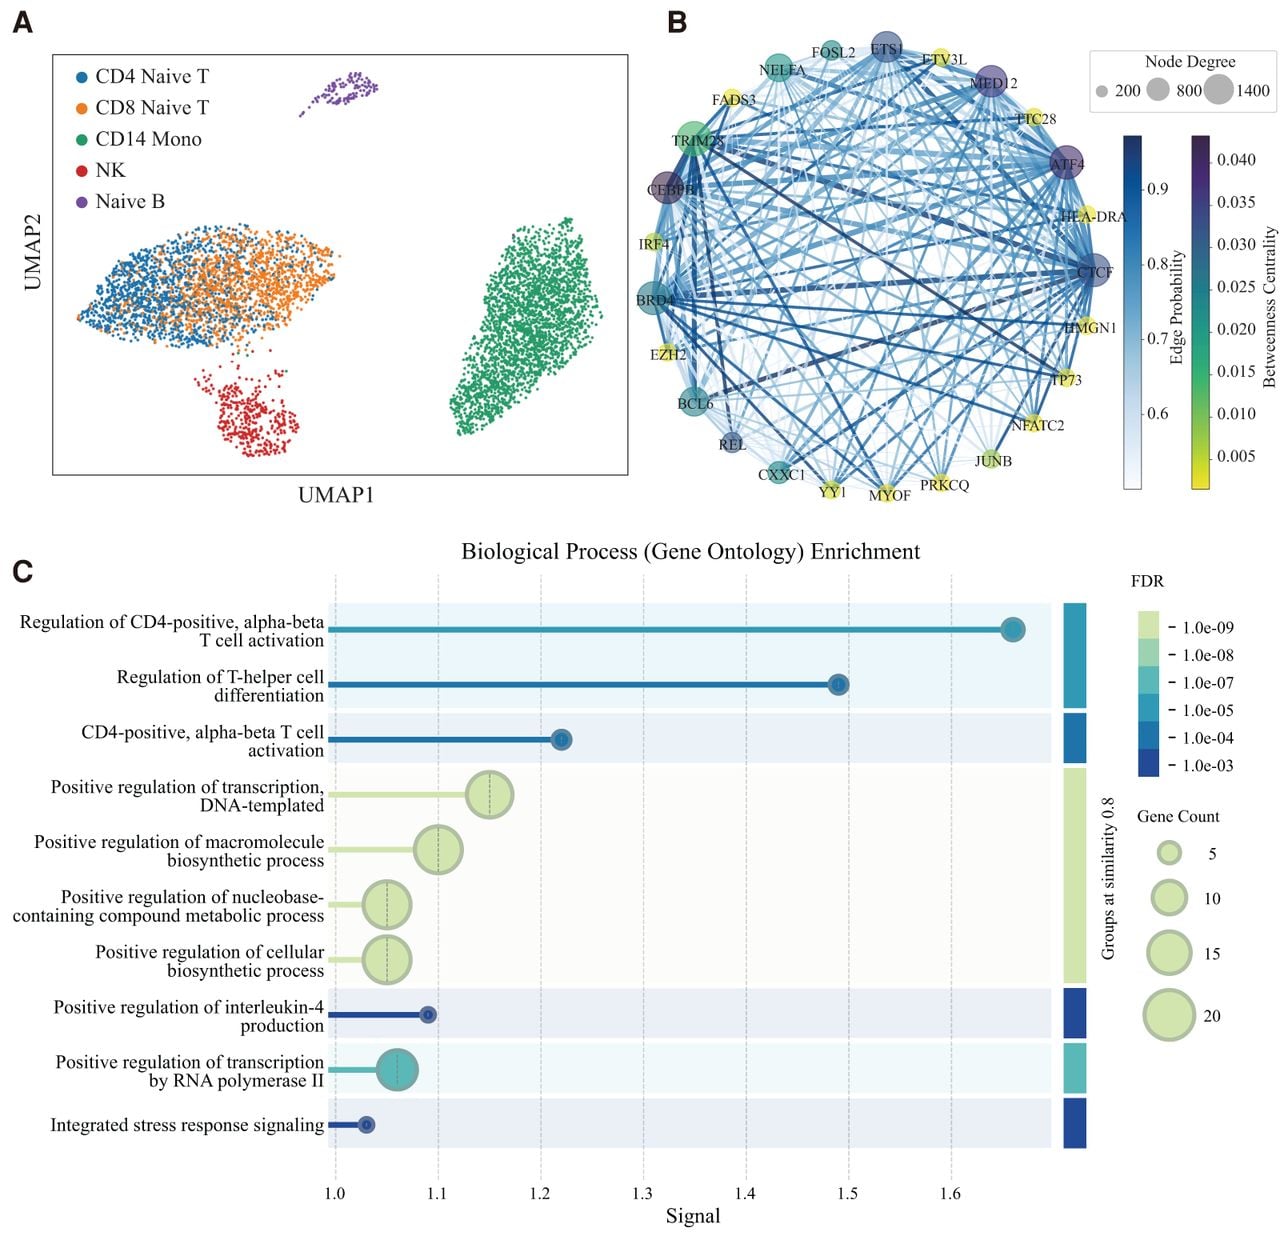
In the case of CD4 naive T cells, a subset of T lymphocytes that play a crucial role in the adaptive immune response by serving as precursors to various effector and memory T cells upon activation (Zhu and Paul 2008), the top 25 genes with the highest degree in the predicted GRN are shown in Figure 7B, alongside the predicted regulatory network. To further identify key regulatory genes and understand their functional significance, we additionally calculated betweenness centrality, a critical metric that quantifies a node's importance in a network by measuring how frequently it appears on the shortest paths between other nodes. The top 25 genes, all of which exhibit significant betweenness centrality according to the density plot (with a one-sided hypothesis t-test at the 0.05 level) (Supplemental Fig. S6), suggest their potential roles as key regulators in CD4 naive cells. Furthermore, we calculated both degree and betweenness centrality scores for these genes in the prior GRN, as listed in Supplemental Table S8. Notably, their rankings in the predicted GRN differ from those in the prior GRN, suggesting that PRISM-GRN does not solely depend on prior knowledge for GRN inference. Instead, PRISM-GRN effectively integrates multi-omics data and employs probabilistic modeling to infer regulatory interactions beyond the prior knowledge. As illustrated in Figure 7C, the Gene Ontology enrichment analysis based on the top 25 genes reveals a significant functional correlation with the CD4 cells.
More specifically, among these top 25 genes, 20 genes have been experimentally validated as TFs involved in regulatory functions within CD4 naive cells, even though they were not explicitly designated as TFs during the training phase. Among the remaining six genes, ETV3L, a member of the ETS TF family, has not yet been explicitly characterized in the context of CD4 naive cell regulation. However, given that the ETS family has been well established to play critical roles in immune function (Hsing et al. 2020; Qu et al. 2020), ETV3L may possess corresponding regulator potential in CD4 naive cells. Although HLA-DRA is not a TF, it plays a pivotal role in the immune system. It encodes the alpha chain of the HLA-DR molecule, a component of the major histocompatibility complex class II, which is essential for presenting extracellular antigenic peptides to CD4+ T-helper cells, thereby initiating and regulating immune responses (Palojärvi et al. 2013; Matern et al. 2020).
As shown in Supplemental Table S9, the top 10 gene regulatory relationships with the highest probability achieved by PRISM-GRN are listed, along with their literature supports, which can partially validate their interactions. For example, for the first-ranking gene relationship between CTCF and BCL6, Paul et al. (Lai et al. 2010) have found that CTCF regulates BCL6 expression by binding to specific intronic regions of BCL6 in a DNA methylation-sensitive manner, in which DNA methylation can prevent CTCF binding, leading to sustained BCL6 expression. Batlle-López et al. (2015) also claimed that CTCF binds to a methylation-sensitive site within BCL6 exon1A, maintaining BCL6 expression by preventing its negative autoregulation. TRIM28 has been shown to interact with transcription CEBPB, potentially modulating its transcriptional activity through the formation of multimeric complexes (Shibata et al. 2011).
These findings show the potential downstream applications of PRISM-GRN and provide further validation for the regulatory roles of the genes in cellular processes. The integration of prior biological knowledge and multi-omics data ensures the accuracy and biological relevance of the inferred GRN, highlighting the practicability of PRISM-GRN for uncovering novel regulatory mechanisms in complex biological systems.
PRISM-GRN recovers context-specific GRNs
PRISM-GRN integrates prior GRNs to provide a structured initialization for gene–gene interactions within a specific cell type. However, rather than being strictly dictated by these priors, PRISM-GRN remains inherently data-driven. It leverages the observed omics data to refine and adjust the regulatory network, allowing for the identification of novel or context-specific interactions that may not be captured by prior knowledge alone. Therefore, we implemented PRISM-GRN on another PBMC data set, denoted as PBMC-ID, to assess its ability to find context-specific GRNs.
Specifically, the PBMC-ID data set contains only scRNA-seq data and comprises both a control group of PBMCs and an experimental group subjected to IFNB1 stimulation, further denoted as PBMC-CTRL and PBMC-IFNB1. Within this data set, the control CD4 T cells can be classified as CD4 naive T cells, whereas the IFNB1-stimulated cells exhibit an activated phenotype, despite being broadly annotated as CD4 T cells, as illustrated in Figure 8A. To maintain consistency with the PBMC data set (Fig. 7A), we utilized the same prior GRN for CD4 T cells and the corresponding scATAC-seq data. Notably, although these scATAC-seq data were paired with scRNA-seq data in the PBMC data set, it serves as nonpaired scATAC-seq data in this experiment as the PBMC-ID data set initially contains only scRNA-seq data.
Illustration of PRISM-GRN for recovering context-specific GRNs. (A) t-SNE plots of the PBMC-ID data sets, with cells colored by type and stimulation status annotations. Focusing on CD4 T cells, they reveal distinct phenotypic changes induced by IFNB1 stimulation. (B) UpSet plot of the three reconstructed GRNs for CD4 T cells in the PBMC and PBMC-IFNB data sets. The reconstructed GRNs of CD4 naive T cells in both the PBMC and PBMC-CTRL data sets exhibit high consistency, whereas the GRN of IFNB1-stimulated CD4 T cells shows substantial divergence, suggesting a regulatory network shift. (C) GO enrichment analysis on the top 200 genes with the highest degree in the reconstructed GRN for IFNB1-stimulated CD4 T cells. The enriched terms are closely associated with immune response and cell development, potentially reflecting the impact of IFNB1 stimulation.
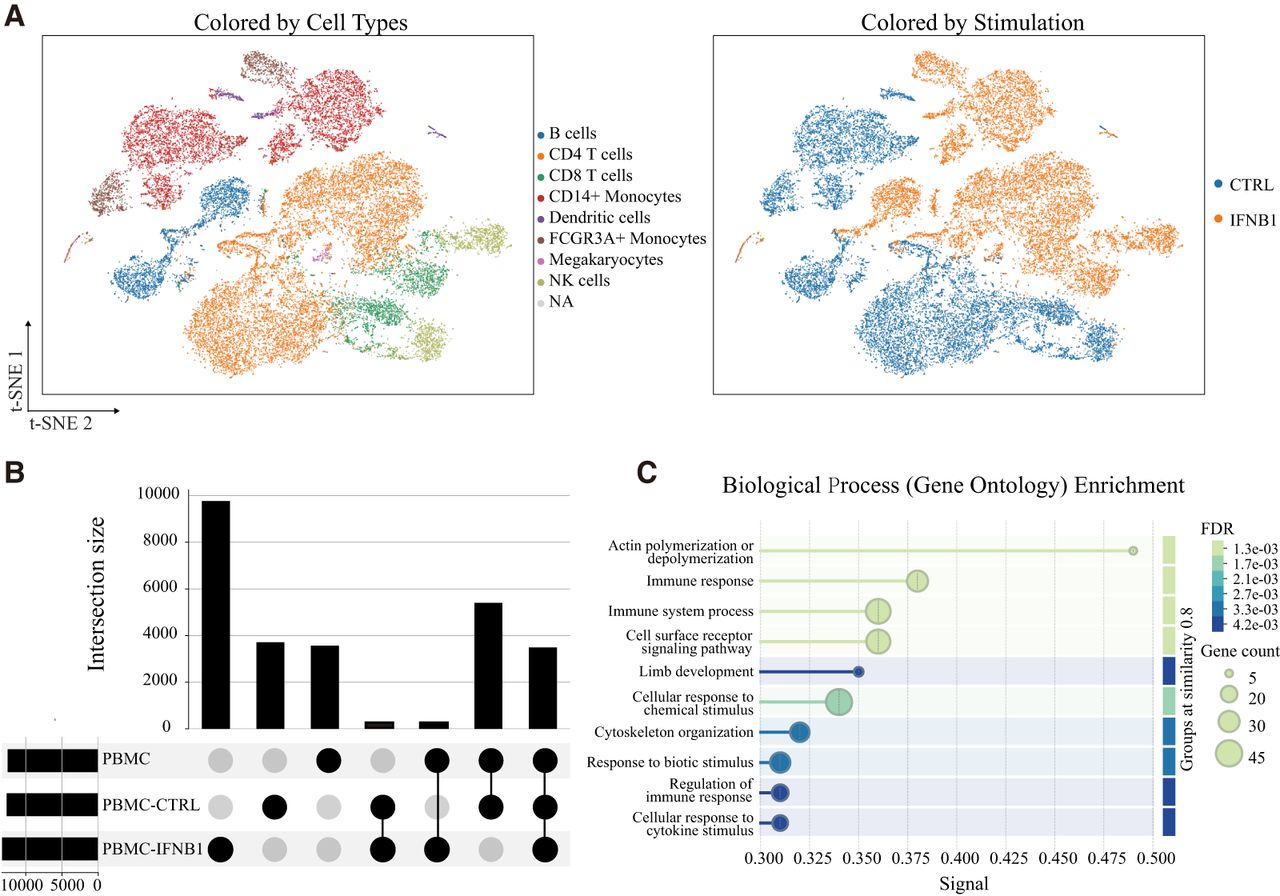
As we used the same set of prior GRNs for CD4 T cells in both the PBMC and PBMC-ID data sets, the GRNs were reconstructed based on the same test set, in which the underlying gene regulatory relationships remained unknown. The intersection structure of the reconstructed GRNs across the three conditions, PBMC, PBMC-CTRL, and PBMC-IFNB1, is depicted in Figure 8B. The intersection matrix at the bottom indicates which data sets contribute to each intersection, with black dots denoting presence in a specific condition. The vertical bars above quantify the number of shared regulatory relationships for each combination, highlighting the extent of overlap or condition-specific interactions.
With 3435 gene regulatory relationships as prior GRNs, PRISM-GRN reconstructed 9088 regulatory relationships for the CD4 T cells in the PBMC data set, 9391 in the PBMC-CTRL data set, and 9898 in the PBMC-IFNB1 data set, respectively. Notably, the reconstructed GRNs for the CD4 T cells in the PBMC and PBMC-CTRL data sets exhibit a high degree of overlap (5470 overlapped relationships). This suggests that, despite being derived from sequencing data generated in different batches, the similar phenotypic profiles of the two conditions contribute to the consistency of the omics features used. As a result, the reconstructed GRNs maintain a high level of concordance. In contrast, in the PBMC-IFNB1 data set, CD4 T cells undergo significant phenotypic changes upon IFNB1 stimulation. Consequently, although the same prior GRN was applied, the reconstructed GRN was primarily driven by the distinct omics features, leading to a markedly different regulatory network structure. In the reconstructed GRN for CD4 T cells in PBMC-IFNB1, only 77 and 97 regulatory relationships overlap with those in PBMC and PBMC-CTRL, respectively. This highlights the dynamic nature of gene regulation under immune stimulation and underscores the sensitivity of GRN inference of PRISM-GRN to underlying biological changes.
As shown in Supplemental Table S10, we present the top 10 genes with the highest degree in the inferred GRN for CD4 T cells in both the PBMC-IFNB1 and PBMC-CTRL data sets, along with their betweenness centrality. We can observe that if the context of the current data set aligns well with the conditions described by the prior GRN, the key regulators tend to retain a high degree and betweenness centrality in the reconstructed GRN. However, when the data set deviates from the prior GRN's context, for example, the IFNB1-stimulated CD4 T cells, the inferred key regulators exhibit lower degree and betweenness centrality. This further demonstrates PRISM-GRN's data-driven capability in reconstructing context-specific GRNs. Importantly, among the 10 genes for the PBMC-IFNB1 data set, JAK2 has been shown to play a crucial role in mediating IFNB1 signaling in CD4 T cells, influencing their proliferation, cytokine production, and immune function by activating STAT proteins and modulating gene expression, with evidence showing its involvement in T cell responses under inflammatory conditions (Sugimoto et al. 2003; Conti et al. 2012; Wang et al. 2024b). ETV6 is recognized as an important transcriptional regulator in hematopoietic cell development and immune function (Hock et al. 2004), whereas MAPKAPK2 acts as a key downstream effector of the p38 mitogen-activated protein kinase pathway, mediating a variety of cellular processes such as inflammatory responses, cytokine production, and cell proliferation (Jeffrey et al. 2007). Additionally, we further performed the Gene Ontology enrichment analysis based on the top 200 genes in PBMC-IFNB1. As illustrated in Figure 8C, the enriched terms are strongly associated with immune response and cell development, potentially reflecting the impact of IFNB1 stimulation.
In the PBMC-IFNB1 data set, the significant divergence in the reconstructed GRN compared with the PBMC and PBMC-CTRL data sets highlights the impact of IFNB1 stimulation on CD4 T cell phenotype and gene regulation. The results demonstrate that PRISM-GRN is highly sensitive to immune-related changes, such as those induced by IFNB1, and can identify novel gene regulatory relationships that are not captured by prior knowledge alone. In summary, PRISM-GRN's ability to integrate prior GRNs while maintaining a data-driven approach allows it to accurately reconstruct context-specific GRNs that reflect the underlying biological conditions. This capability positions PRISM-GRN as a powerful tool for investigating gene regulatory mechanisms in diverse biological contexts and offers potential applications in interventional therapy or precision medicine.
Discussion
GRNs are fundamental to understanding cellular functions and behaviors. With the accelerated accumulation of the omics data and the development of artificial intelligence methods, significant progress has been made in inferring the cell type–specific GRNs. However, the existing computational methods often fail to systematically and effectively leverage the prior knowledge, resulting in a lack of biological interpretability owing to their architectural limitations. Therefore, to overcome the limitations, we proposed PRISM-GRN, a probabilistic Bayesian model with a biologically interpretable framework, to predict cell type–specific GRNs by effectively utilizing multi-omics data and prior knowledge. Under the well-established gene regulatory mechanism theory, the expression of a given gene in a specific cell is influenced by the expression of TFs targeting it, the chromatin accessibility of its regulatory regions, and, crucially, the TF–gene interactions that constitute the GRN. PRISM-GRN incorporates this prior theoretical framework into a Bayesian probabilistic framework, using variational inference to effectively capture the latent contributions from GRN interactions constrained by the regulatory mechanism–informed generation process, thereby improving the accuracy in predicting causal GRNs in a cell type–specific data set.
Multiple experiments were conducted to comprehensively evaluate the efficacy of PRISM-GRN. On four benchmarking data sets with paired scRNA-seq and scATAC-seq data, PRISM-GRN consistently outperforms the seven baseline methods in recovering GRN. Evaluated on these data sets with directed GRNs, the results highlight PRISM-GRN's ability to infer causality in gene regulation through biologically informed variational inference. Notably, during training, no class-balancing strategies were applied, yet PRISM-GRN maintains robust performance in the face of highly imbalanced data distributions. Ablation experiments (Supplemental Content S4; Supplemental Fig. S7) clearly demonstrate that PRISM-GRN effectively integrates information from both modalities, with performance significantly degraded when either modality is perturbed, highlighting that both are indispensable for accurate GRN inference.
Furthermore, PRISM-GRN demonstrates robustness by achieving excellent performance even with limited prior GRN information or unpaired omics data, showcasing its broader real-world applicability owing to its finite reliance on prior knowledge and high flexibility in handling incomplete data. Downstream analyses on the A549 data set show PRISM-GRN's capability to improve the understanding of gene functions by the biologically interpretable architecture in the probabilistic framework. More important, the flexible applications of PRISM-GRN on human PBMC data sets reveal that PRISM-GRN facilitates the identification of novel cell type–specific or context-specific regulatory relationships and core regulators, emphasizing its potential for practical application across diverse biological research scenarios.
The computational efficacy of PRISM-GRN and the supervised baseline methods, Grace and GeneLink, was evaluated on the A549 and 3T3 data sets (Supplemental Table S11). PRISM-GRN achieves the best trade-off between predictive performance and computational efficiency, highlighting its practicality for large-scale and high-dimensional single-cell multi-omics data analysis. In addition, we conducted multiple runs of PRISM-GRN under different random seeds to assess training stability. The results (Supplemental Fig. S8) show that PRISM-GRN consistently yields stable performance across runs in both GRN reconstruction and causality prediction tasks, indicating robustness to training randomness.
PRISM-GRN, as a supervised method, offers a novel and robust research paradigm for GRN exploration, leveraging sufficient annotated multi-omics data and prior knowledge to advance the understanding of gene regulatory mechanisms. Notably, in benchmark results, unsupervised methods, whether based on single-omic or multi-omics data, show comparatively weaker performance in predicting GRNs compared with supervised methods like PRISM-GRN and Grace. This can be attributed to several factors. First, unsupervised methods often overlook genes with weak signals in omics data, and as more omics data are integrated, these methods become increasingly sensitive to data quality. Second, the imbalance in the splitting of the training and test sets can also reduce the performance of unsupervised methods on the test set. Third, correlation-based methods typically fail to capture causal relationships between genes, resulting in missed regulatory interactions. However, unsupervised methods remain highly valuable in scenarios in which reliable supervision is unavailable, for instance, when ground-truth regulatory interactions are missing or incomplete, or in novel tissues or species for which prior knowledge is limited. These methods are also advantageous in exploratory settings, in which the goal is to discover new regulatory modules without imposing predefined labels or assumptions. Their flexibility and model-agnostic design allow them to scale to a wide range of biological contexts and to uncover hidden structures not constrained by existing annotations.
Although the Bayesian probabilistic framework of PRISM-GRN enables effective integration of multi-omics data with prior GRNs through a biologically interpretable structure, it still faces several challenges. In particular, PRISM-GRN relies on accurate cell type annotations and high-quality prior GRNs. To assess the model's robustness to noise in these critical inputs, we conducted a series of sensitivity analyses, including tests on PRISM-GRN's performance under preprocessing variations (Supplemental Content S5; Supplemental Tables S12, S13), doublet contamination (Supplemental Content S6; Supplemental Fig. S9), misannotated cell types (Supplemental Content S6; Supplemental Fig. S10), and incorrect prior regulatory information (Supplemental Content S7; Supplemental Fig. S11). The results demonstrate that PRISM-GRN exhibits a certain level of tolerance to such noise. However, overall performance still benefits significantly from multimodal modeling, accurate cell type annotations, and reliable prior knowledge, underscoring the importance of careful data preprocessing and prior selection.
Last but not least, PRISM-GRN currently only considers the influence of TF expression, chromatin accessibility, and cell type–specific GRNs on gene expression. In reality, gene regulation is also shaped by additional epigenetic factors such as DNA methylation and histone modifications. If high-quality, cell type–specific methylation data become more widely available in the future and if alignment strategies across modalities continue to improve, PRISM-GRN also provides a flexible interface that allows for the integration of additional omics data. For example, gene expression is also influenced by DNA methylation levels. In the future, we can improve PRISM-GRN by readily incorporating methylation data into the variational inference process as a latent variable when data permit, enabling a more comprehensive analysis of gene regulatory mechanisms.
Methods
The mechanism-informed generation process
As illustrated in Figure 1B, the generation process of gene expression is formulated on the established gene regulatory mechanism, which asserts that the expression is influenced by the contributions from TF expressions, chromatin accessibility states, and the TF–gene interactions, namely, the GRNs. Therefore, E′ is assumed to follow a Dirichlet-multinomial distribution (Elkan 2006) integrating the latent variables of zExp from the gene expression profile, zAcc from the chromatin accessibility score, and zGRN from prior TF–gene interactions, which is formulated as
The distributions of the used latent variables are initialized and then constrained and guided by the mechanism-informed generative process. Specifically, the prior distribution of zExp and zAcc both follow a standard normal distribution with a mean of zero and a variance of I, formulated as
Because the latent zGRN is constrained by the prior GRN and guided by the expression generative process in a cell type–specific condition, it is supposed to indicate the hidden states for the potential GRN connections. Therefore, PRISM-GRN additionally uses a categorical distribution to recover the GRN based on zGRN. Specifically, for two genes i and j, we first concatenate their respective zGRN,i and zGRN,j vectors to form a combined latent variable zGRN,ij, which captures the regulatory relationship between them:
Finally, the regulatory relationship yij between gene i and gene j is generated by sampling from the categorical distribution:
The prior GRN-primed inference process
In the inference process of PRISM-GRN, the distribution parameters used in the generation process are inferred from the observable input data. A GAT (Veličković et al. 2017) is first used to obtain the initial gene embeddings, which contain the hidden information of gene regulatory interactions by incorporating a self-attention mechanism into the information propagation step. Taking as input the adjacency matrix A of the prior GRN and the gene expression profile E, GAT produces the initial gene feature embeddings zGAT ∈ ℝM × H that are assigned the importance of their neighbors, namely, the regulatory-interacted genes, through the graph connectivity according to the prior GRN, where H is the size of the latent embedding.
More specifically, a shared weight matrix W ∈ ℝH × N is first applied to perform a linear transformation on the raw feature, the self-attention mechanism is subsequently implemented using a feedforward MLP layer parameterized by a weight vector α ∈ ℝ2H and the LeakyReLU activation function is followed to introduce nonlinearity. Taking gene i and gene j as examples, the attention coefficient of gene j on gene i can be formulated as follows:
The attention coefficients of gene j of gene i are subsequently normalized across all the first-order neighbors using Softmax, which is defined as follows:
Finally, the initial embedding of gene i can be obtained by aggregating its neighbor genes through the single-head attention mechanism:
zGAT produces the primary hidden state for each gene by incorporating the known regulatory information from prior GRN. To enable the causality prediction among the gene pairs, zGRN is further inferred from zGAT to learn the unobserved biological factor from GRN. The variational posterior distribution q(zGRN|zGAT) is used to approximate the real posterior distribution p(zGRN|zGAT) in the variational inference, which is parameterized as
As mentioned in the generation process (Fig. 1B), PRISM-GRN subsequently integrates the latent variable zGAT with zExp and zAcc into a mechanism-informed generation process. Similarly, given the observed data, we use an inference process to infer the posterior distribution parameters to be used in the generation process, including zExp from E, zAcc from R.
Specifically, zExp captures the unobserved biological factors influencing gene expression of TFs; zAcc captures the unobserved biological factors influencing the accessible state of target genes; and their posterior distributions are parameterized as
Notably, the reparameterization trick is implemented automatically by using Pyro (Bingham et al. 2019) to enable efficient and differentiable sampling of the latent variables zExp, zAcc, and zGRN, during the inference process. Based on the learned latent variables that represent the biological factors in gene expression, PRISM-GRN can accordingly perform the mechanism-informed generation process.
Loss function and parameter optimization
PRISM-GRN is a probabilistic model, in which the parameters are optimized through variational inference using the Adam optimizer. The loss function comprises three key components: (1) the KL divergence loss, (2) the reconstruction loss for gene expression data, and (3) the reconstruction loss for the GRN. Each of these components ensures that the model both approximates the true posterior distributions and effectively reconstructs the observed data.
The KL divergence is used to measure the divergence between the approximate posterior distributions of the latent variables and their corresponding prior distributions. Specifically, for the latent variables zExp, zAcc, zGRN, the KL divergence is computed between the approximate posterior distributions q(z|*) and the standard Gaussian prior distributions :
The reconstruction loss for gene expression data E is computed as the mean squared error (MSE) between the observed expression data and the reconstructed expression data E′, which is generated by the model from the latent variables zExp, zAcc, and zGRN:
The total loss function is the sum of KL divergence, gene expression reconstruction loss, and GRN reconstruction loss, as defined
Data source
All data sets used in this paper were downloaded from public databases. The paired scRNA-seq and scATAC-seq data for the A549 data set were obtained from the NCBI Gene Expression Omnibus (GEO; https://www.ncbi.nlm.nih.gov/geo/) under accession number GSE117089 (Cao et al. 2018). The paired scRNA-seq and scATAC-seq data for data sets GM12878, K562, and 3T3 are from the SHRAE-seq data under GEO accession number GSE140203 (Ma et al. 2020), in which the replicant scATAC-seq data for GM12878 were also embraced. The unpaired scATAC-seq data for A549 were obtained from the study under GEO accession number GSE211617. For the additional two data sets, hESC and mESC, the scRNA-seq data were obtained from the study under GEO accession number GSE75748 (Chu et al. 2016) and GSE98664 (Hayashi et al. 2018), whereas the scATAC-seq data were independently obtained from the study under GEO accession number GSE192858 (Samara et al. 2022) and GSE107651 (Zamanighomi et al. 2018), respectively. All cell type–specific ChIP-seq data were obtained from the ChIP-Atlas database (Oki et al. 2018). The PBMC data sets can be accessed from 10x Genomics platform with the link https://www.10xgenomics.com/datasets/pbmc-from-a-healthy-donor-no-cell-sorting-10-k-1-standard-2-0-0. The PBMC-IFNB1 data sets were obtained from the study under GEO accession number GSE96583 (Kang et al. 2018).
Code availability
The source code of PRISM-GRN and the preprocessing scripts of this paper for reproducing the results are available at GitHub (http://github.com/Ying-Lab/PRISM-GRN), under the MIT License, and as Supplemental Code.
Competing interest statement
The authors declare no competing interests.
Acknowledgments
This work is supported by the National Natural Science Foundation of China (62573367, 62173282, 62472363), and the Fuzhou Inter-institutional Science and Technology Cooperation Project (2024-Y-018). We thank Shaorong Fang and Tianfu Wu from the Information and Network Center of Xiamen University for their help with high-performance computing (HPC).
Author contributions: W.H.Z. and L.C. conceived the study. W.H.Z. developed and benchmarked the described algorithm. W.H.Z,. L.C., X.X.G., and Y.Y.L. performed the downstream analyses. Y.W. supervised the study. W.H.Z. wrote the manuscript and L.C. revised it.
Notes
[1] Supplementary material [Supplemental material is available for this article.]
[2] Article published online before print. Article, supplemental material, and publication date are at https://www.genome.org/cgi/doi/10.1101/gr.280757.125.
References
- ↵Aibar S, González-Blas CB, Moerman T, Huynh-Thu VA, Imrichova H, Hulselmans G, Rambow F, Marine JC, Geurts P, Aerts J, 2017. SCENIC: single-cell regulatory network inference and clustering. Nat Methods 14: 1083–1086. 10.1038/nmeth.4463
- ↵Arafeh R, Shibue T, Dempster JM, Hahn WC, Vazquez F. 2025. The present and future of the cancer dependency map. Nat Rev Cancer 25: 59–73. 10.1038/s41568-024-00763-x
- ↵Atanackovic L, Tong A, Wang B, Lee LJ, Bengio Y, Hartford JS. 2023. DynGFN: towards Bayesian inference of gene regulatory networks with GFlowNets. In NIPS ’23: Proceedings of the 37th International Conference on Neural Information Processing Systems, New Orleans (ed. Oh A, et al.), Article No. 3253, pp. 74410–74428. Neural Information Processing Systems, La Jolla, CA.
- ↵Badia-i-Mompel P, Wessels L, Müller-Dott S, Trimbour R, Ramirez Flores RO, Argelaguet R, Saez-Rodriguez J. 2023. Gene regulatory network inference in the era of single-cell multi-omics. Nat Rev Genet 24: 739–754. 10.1038/s41576-023-00618-5
- ↵Batlle-López A, Cortiguera MG, Rosa-Garrido M, Blanco R, Del Cerro E, Torrano V, Wagner SD, Delgado MD. 2015. Novel CTCF binding at a site in exon1A of BCL6 is associated with active histone marks and a transcriptionally active locus. Oncogene 34: 246–256. 10.1038/onc.2013.535
- ↵Bingham E, Chen JP, Jankowiak M, Obermeyer F, Pradhan N, Karaletsos T, Singh R, Szerlip P, Horsfall P, Goodman ND. 2019. Pyro: deep universal probabilistic programming. J Mach Learn Res 20: 973–978.
- ↵Bravo González-Blas C, De Winter S, Hulselmans G, Hecker N, Matetovici I, Christiaens V, Poovathingal S, Wouters J, Aibar S, Aerts S. 2023. SCENIC+: single-cell multiomic inference of enhancers and gene regulatory networks. Nat Methods 20: 1355–1367. 10.1038/s41592-023-01938-4
- ↵Cao Z-J, Gao G. 2022. Multi-omics single-cell data integration and regulatory inference with graph-linked embedding. Nat Biotechnol 40: 1458–1466. 10.1038/s41587-022-01284-4
- ↵Cao J, Cusanovich DA, Ramani V, Aghamirzaie D, Pliner HA, Hill AJ, Daza RM, Mcfaline-Figueroa JL, Packer JS, Christiansen L, 2018. Joint profiling of chromatin accessibility and gene expression in thousands of single cells. Science 361: 1380–1385. 10.1126/science.aau0730
- ↵Cao Y, Zhao X, Tang S, Jiang Q, Li S, Li S, Chen S. 2024. scButterfly: a versatile single-cell cross-modality translation method via dual-aligned variational autoencoders. Nat Commun 15: 2973. 10.1038/s41467-024-47418-x
- ↵Carthew RW. 2021. Gene regulation and cellular metabolism: an essential partnership. Trends Genet 37: 389–400. 10.1016/j.tig.2020.09.018
- ↵Chen G, Liu ZP. 2022. Graph attention network for link prediction of gene regulations from single-cell RNA-sequencing data. Bioinformatics 38: 4522–4529. 10.1093/bioinformatics/btac559
- ↵Chen K, Rajewsky N. 2007. The evolution of gene regulation by transcription factors and microRNAs. Nat Rev Genet 8: 93–103. 10.1038/nrg1990
- ↵Chen J, Cheong C, Lan L, Zhou X, Liu J, Lyu A, Cheung WK, Zhang L. 2021. DeepDRIM: a deep neural network to reconstruct cell-type-specific gene regulatory network using single-cell RNA-seq data. Brief Bioinform 22: bbab325. 10.1093/bib/bbab325
- ↵Chen X, Chen S, Song S, Gao Z, Hou L, Zhang X, Lv H, Jiang R. 2022. Cell type annotation of single-cell chromatin accessibility data via supervised Bayesian embedding. Nat Mach Intell 4: 116–126. 10.1038/s42256-021-00432-w
- ↵Chu LF, Leng N, Zhang J, Hou Z, Mamott D, Vereide DT, Choi J, Kendziorski C, Stewart R, Thomson JA. 2016. Single-cell RNA-seq reveals novel regulators of human embryonic stem cell differentiation to definitive endoderm. Genome Biol 17: 173. 10.1186/s13059-016-1033-x
- ↵Conti L, De Palma R, Rolla S, Boselli D, Rodolico G, Kaur S, Silvennoinen O, Niccolai E, Amedei A, Ivaldi F, 2012. Th17 cells in multiple sclerosis express higher levels of JAK2, which increases their surface expression of IFN-γR2. J Immunol 188: 1011–1018. 10.4049/jimmunol.1004013
- ↵Duren Z, Chang F, Naqing F, Xin J, Liu Q, Wong WH. 2022. Regulatory analysis of single cell multiome gene expression and chromatin accessibility data with scREG. Genome Biol 23: 114. 10.1186/s13059-022-02682-2
- ↵Elkan C. 2006. Clustering documents with an exponential-family approximation of the Dirichlet compound multinomial distribution. In Proceedings of the 23rd International Conference on Machine Learning, Pittsburgh. Association for Computing Machinery, New York.
- ↵Fang R, Preissl S, Li Y, Hou X, Lucero J, Wang X, Motamedi A, Shiau AK, Zhou X, Xie F, 2021. Comprehensive analysis of single cell ATAC-seq data with SnapATAC. Nat Commun 12: 1337. 10.1038/s41467-021-21583-9
- ↵Foster KA, Oster CG, Mayer MM, Avery ML, Audus KL. 1998. Characterization of the A549 cell line as a type II pulmonary epithelial cell model for drug metabolism. Exp Cell Res 243: 359–366. 10.1006/excr.1998.4172
- ↵Gao Z, Tang J, Xia J, Zheng CH, Wei PJ. 2023. CNNGRN: a convolutional neural network-based method for gene regulatory network inference from bulk time-series expression data. IEEE/ACM Trans Comput Biol Bioinform 20: 2853–2861. 10.1109/TCBB.2023.3282212
- ↵Han H, Cho J-W, Lee S, Yun A, Kim H, Bae D, Yang S, Kim CY, Lee M, Kim E, 2018. TRRUST v2: an expanded reference database of human and mouse transcriptional regulatory interactions. Nucleic Acids Res 46: D380–D386. 10.1093/nar/gkx1013
- ↵Hayashi T, Ozaki H, Sasagawa Y, Umeda M, Danno H, Nikaido I. 2018. Single-cell full-length total RNA sequencing uncovers dynamics of recursive splicing and enhancer RNAs. Nat Commun 9: 619. 10.1038/s41467-018-02866-0
- ↵Hock H, Meade E, Medeiros S, Schindler JW, Valk PJ, Fujiwara Y, Orkin SH. 2004. Tel/Etv6 is an essential and selective regulator of adult hematopoietic stem cell survival. Genes Dev 18: 2336–2341. 10.1101/gad.1239604
- ↵Hsing M, Wang Y, Rennie PS, Cox ME, Cherkasov A. 2020. ETS transcription factors as emerging drug targets in cancer. Med Res Rev 40: 413–430. 10.1002/med.21575
- ↵Huynh-Thu VA, Irrthum A, Wehenkel L, Geurts P. 2010. Inferring regulatory networks from expression data using tree-based methods. PLoS One 5: e12776. 10.1371/journal.pone.0012776
- ↵Isbel L, Grand RS, Schübeler D. 2022. Generating specificity in genome regulation through transcription factor sensitivity to chromatin. Nat Rev Genet 23: 728–740. 10.1038/s41576-022-00512-6
- ↵Jeffrey KL, Camps M, Rommel C, Mackay CR. 2007. Targeting dual-specificity phosphatases: manipulating MAP kinase signalling and immune responses. Nat Rev Drug Discov 6: 391–403. 10.1038/nrd2289
- ↵Jin S, Zhang L, Nie Q. 2020. scAI: an unsupervised approach for the integrative analysis of parallel single-cell transcriptomic and epigenomic profiles. Genome Biol 21: 25. 10.1186/s13059-020-1932-8
- ↵Kamimoto K, Stringa B, Hoffmann CM, Jindal K, Solnica-Krezel L, Morris SA. 2023. Dissecting cell identity via network inference and in silico gene perturbation. Nature 614: 742–751. 10.1038/s41586-022-05688-9
- ↵Kang HM, Subramaniam M, Targ S, Nguyen M, Maliskova L, McCarthy E, Wan E, Wong S, Byrnes L, Lanata CM, 2018. Multiplexed droplet single-cell RNA-sequencing using natural genetic variation. Nat Biotechnol 36: 89–94. 10.1038/nbt.4042
- ↵Karlebach G, Shamir R. 2008. Modelling and analysis of gene regulatory networks. Nat Rev Mol Cell Biol 9: 770–780. 10.1038/nrm2503
- ↵Kartha VK, Duarte FM, Hu Y, Ma S, Chew JG, Lareau CA, Earl A, Burkett ZD, Kohlway AS, Lebofsky R, 2022. Functional inference of gene regulation using single-cell multi-omics. Cell Genomics 2: 100166. 10.1016/j.xgen.2022.100166
- ↵Keenan AB, Torre D, Lachmann A, Leong AK, Wojciechowicz ML, Utti V, Jagodnik KM, Kropiwnicki E, Wang Z, Ma'ayan A. 2019. ChEA3: transcription factor enrichment analysis by orthogonal omics integration. Nucleic Acids Res 47: W212–W224. 10.1093/nar/gkz446
- ↵Kim S, Wysocka J. 2023. Deciphering the multi-scale, quantitative cis-regulatory code. Mol Cell 83: 373–392. 10.1016/j.molcel.2022.12.032
- ↵Kim D, Tran A, Kim HJ, Lin Y, Yang JYH, Yang P. 2023. Gene regulatory network reconstruction: harnessing the power of single-cell multi-omic data. NPJ Syst Biol Appl 9: 51. 10.1038/s41540-023-00312-6
- ↵Kouzarides T. 2007. Chromatin modifications and their function. Cell 128: 693–705. 10.1016/j.cell.2007.02.005
- ↵Lai AY, Fatemi M, Dhasarathy A, Malone C, Sobol SE, Geigerman C, Jaye DL, Mav D, Shah R, Li L, 2010. DNA methylation prevents CTCF-mediated silencing of the oncogene BCL6 in B cell lymphomas. J Exp Med 207: 1939–1950. 10.1084/jem.20100204
- ↵Langfelder P, Horvath S. 2008. WGCNA: an R package for weighted correlation network analysis. BMC Bioinformatics 9: 559. 10.1186/1471-2105-9-559
- ↵Lee TI, Young RA. 2013. Transcriptional regulation and its misregulation in disease. Cell 152: 1237–1251. 10.1016/j.cell.2013.02.014
- ↵Levine M, Davidson EH. 2005. Gene regulatory networks for development. Proc Natl Acad Sci 102: 4936–4942. 10.1073/pnas.0408031102
- ↵Lin S, Gregory RI. 2015. MicroRNA biogenesis pathways in cancer. Nat Rev Cancer 15: 321–333. 10.1038/nrc3932
- ↵Liu P, Liao J, Tang Z, Wu W, Yang J, Zeng Z, Hu Y, Wang P, Ju H, Xu R, 2014. Metabolic regulation of cancer cell side population by glucose through activation of the Akt pathway. Cell Death Differ 21: 124–135. 10.1038/cdd.2013.131
- ↵Loers JU, Vermeirssen V. 2024. A single-cell multimodal view on gene regulatory network inference from transcriptomics and chromatin accessibility data. Brief Bioinform 25: bbae382. 10.1093/bib/bbae382
- ↵Ma S, Zhang B, Lafave LM, Earl AS, Chiang Z, Hu Y, Ding J, Brack A, Kartha VK, Tay T, 2020. Chromatin potential identified by shared single-cell profiling of RNA and chromatin. Cell 183: 1103–1116.e20. 10.1016/j.cell.2020.09.056
- ↵Matern BM, Olieslagers TI, Voorter CE, Groeneweg M, Tilanus MG. 2020. Insights into the polymorphism in HLA-DRA and its evolutionary relationship with HLA haplotypes. HLA 95: 117–127. 10.1111/tan.13730
- ↵Moerman T, Aibar Santos S, Bravo González-Blas C, Simm J, Moreau Y, Aerts J, Aerts S. 2019. GRNBoost2 and Arboreto: efficient and scalable inference of gene regulatory networks. Bioinformatics 35: 2159–2161. 10.1093/bioinformatics/bty916
- ↵Oki S, Ohta T, Shioi G, Hatanaka H, Ogasawara O, Okuda Y, Kawaji H, Nakaki R, Sese J, Meno C. 2018. ChIP-Atlas: a data-mining suite powered by full integration of public ChIP-seq data. EMBO Rep 19: e46255. 10.15252/embr.201846255
- ↵Ozsolak F, Milos PM. 2011. RNA sequencing: advances, challenges and opportunities. Nat Rev Genet 12: 87–98. 10.1038/nrg2934
- ↵Palojärvi A, Petäjä J, Siitonen S, Janér C, Andersson S. 2013. Low monocyte HLA-DR expression as an indicator of immunodepression in very low birth weight infants. Pediatr Res 73: 469–475. 10.1038/pr.2012.199
- ↵Park PJ. 2009. ChIP–seq: advantages and challenges of a maturing technology. Nat Rev Genet 10: 669–680. 10.1038/nrg2641
- ↵Pratapa A, Jalihal AP, Law JN, Bharadwaj A, Murali TM. 2020. Benchmarking algorithms for gene regulatory network inference from single-cell transcriptomic data. Nat Methods 17: 147–154. 10.1038/s41592-019-0690-6
- ↵Qu H, Zhao H, Zhang X, Liu Y, Li F, Sun L, Song Z. 2020. Integrated analysis of the ETS family in melanoma reveals a regulatory role of ETV7 in the immune microenvironment. Front Immunol 11: 612784. 10.3389/fimmu.2020.612784
- ↵Samara A, Spildrejorde M, Sharma A, Falck M, Leithaug M, Modafferi S, Bjørnstad PM, Acharya G, Gervin K, Lyle R, 2022. A multi-omics approach to visualize early neuronal differentiation from hESCs in 4D. iScience 25: 105279. 10.1016/j.isci.2022.105279
- ↵Sha L, Lv Z, Liu Y, Zhang Y, Sui X, Wang T, Zhang H. 2021. Shikonin inhibits the Warburg effect, cell proliferation, invasion and migration by downregulating PFKFB2 expression in lung cancer. Mol Med Rep 24: 560. 10.3892/mmr.2021.12199
- ↵Shibata M, Blauvelt KE, Liem KFJr, García-García MJ. 2011. TRIM28 is required by the mouse KRAB domain protein ZFP568 to control convergent extension and morphogenesis of extra-embryonic tissues. Development 138: 5333–5343. 10.1242/dev.072546
- ↵Sugimoto N, Nakahira M, Ahn HJ, Micallef M, Hamaoka T, Kurimoto M, Fujiwara H. 2003. Differential requirements for JAK2 and TYK2 in T cell proliferation and IFN-γ production induced by IL-12 alone or together with IL-18. Eur J Immunol 33: 243–251. 10.1002/immu.200390027
- ↵Sun Q, Zheng S, Tang W, Wang X, Wang Q, Zhang R, Zhang N, Ping W. 2024. Prediction of lung adenocarcinoma prognosis and diagnosis with a novel model anchored in circadian clock-related genes. Sci Rep 14: 18202. 10.1038/s41598-024-68256-3
- ↵Tjärnberg A, Beheler-Amass M, Jackson CA, Christiaen LA, Gresham D, Bonneau R. 2024. Structure-primed embedding on the transcription factor manifold enables transparent model architectures for gene regulatory network and latent activity inference. Genome Biol 25: 24. 10.1186/s13059-023-03134-1
- ↵Traag VA, Waltman L, Van Eck NJ. 2019. From Louvain to Leiden: guaranteeing well-connected communities. Sci Rep 9: 5233. 10.1038/s41598-019-41695-z
- ↵Veličković P, Cucurull G, Casanova A, Romero A, Liò P, Bengio Y. 2017. Graph attention networks. stat 1050: 10–48550.
- ↵Wang JC, Chen YJ, Zou Q. 2024a. GRACE: unveiling gene regulatory networks with causal mechanistic graph neural networks in single-cell RNA-sequencing data. IEEE Trans Neural Netw Learn Syst 36: 9005–9017. 10.1109/TNNLS.2024.3412753
- ↵Wang L, Yukselten Y, Nuwagaba J, Sutton RE. 2024b. JAK/STAT signaling pathway affects CCR5 expression in human CD4+ T cells. Sci Adv 10: eadl0368. 10.1126/sciadv.adl0368
- ↵Wang Y, Zheng P, Cheng Y-C, Wang Z, Aravkin A. 2024c. WENDY: covariance dynamics based gene regulatory network inference. Math Biosci 377: 109284. 10.1016/j.mbs.2024.109284
- ↵Xiang R, Cui Y, Wang Y, Xie T, Yang X, Wang Z, Li J, Li Q. 2018. Circadian clock gene Per2 downregulation in non‐small cell lung cancer is associated with tumour progression and metastasis. Oncol Rep 40: 3040–3048. 10.3892/or.2018.6704
- ↵Zamanighomi M, Lin Z, Daley T, Chen X, Duren Z, Schep A, Greenleaf WJ, Wong WH. 2018. Unsupervised clustering and epigenetic classification of single cells. Nat Commun 9: 2410. 10.1038/s41467-018-04629-3
- ↵Zhu J, Paul WE. 2008. CD4 T cells: fates, functions, and faults. Blood 112: 1557–1569. 10.1182/blood-2008-05-078154