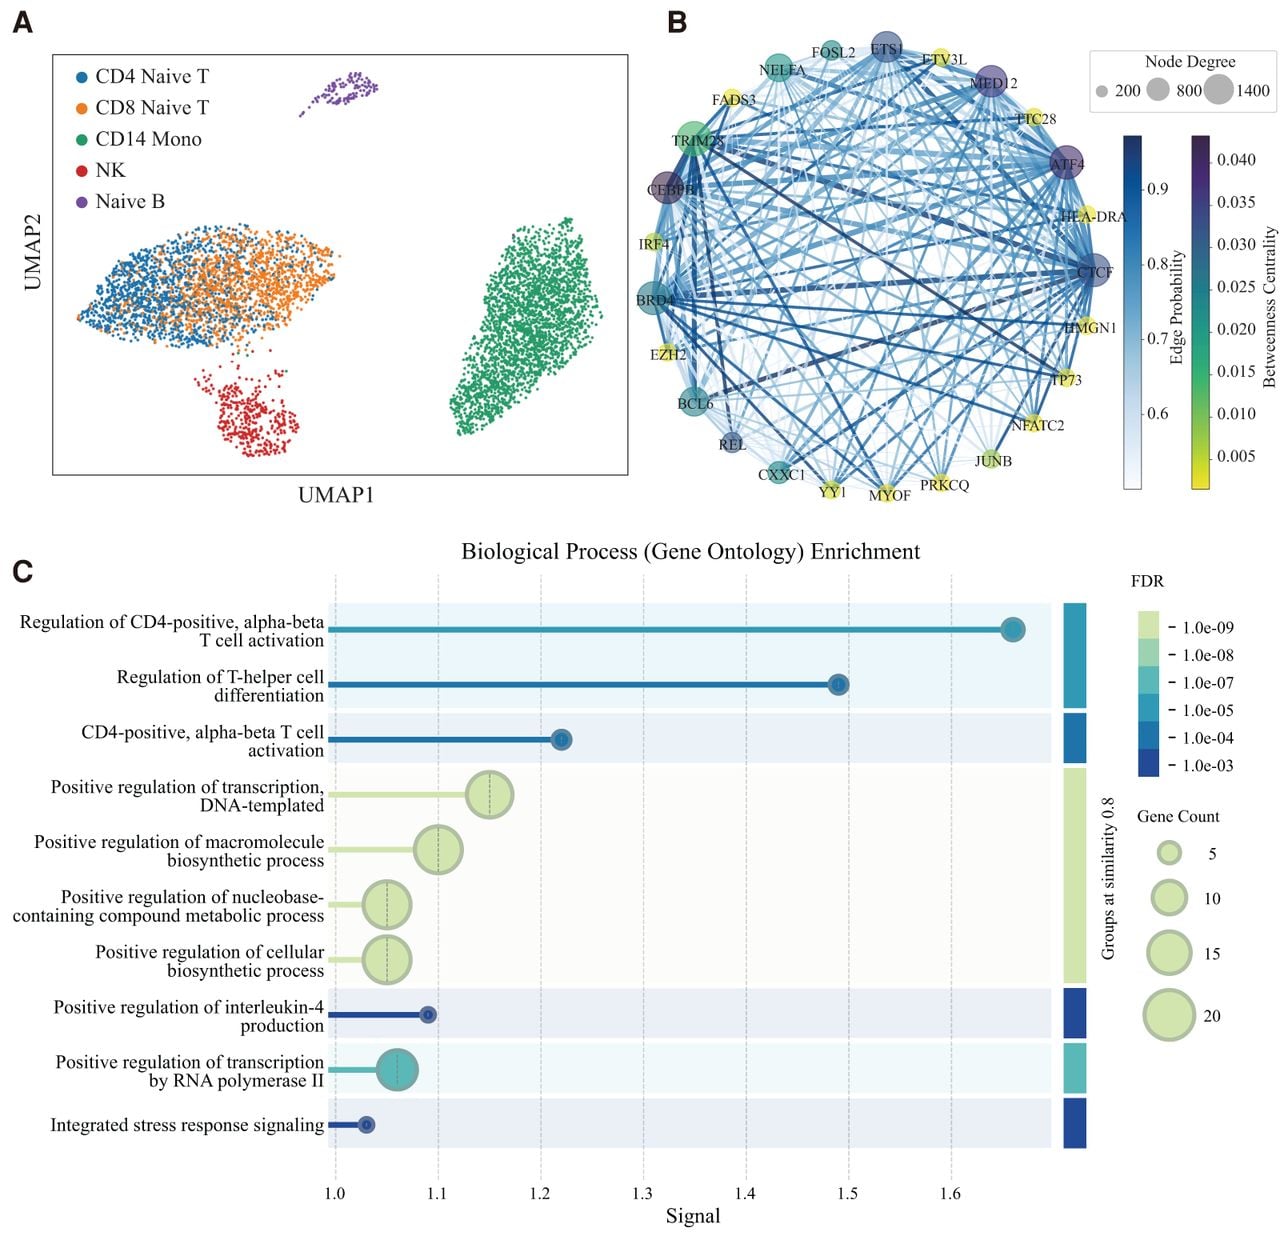
Illustration of PRISM-GRN for finding gene regulators in cell type–specific GRNs. (A) UMAP plot of the top five cell types with the highest number in the PBMC data set based on the raw gene expressions. (B) Predicted GRN for CD4 naive cells, displaying the top 25 genes with the highest degree. The node color represents the betweenness centrality of genes in the predicted GRN, and node size reflects the degree of each gene. The color and size of the edges correspond to the probability assigned by PRISM-GRN in the predicted GRN. (C) GO enrichment analysis results for the 25 genes in CD4 naive cells. The FDR indicates the significance of enrichment, with P-values corrected for multiple testing using the Benjamini–Hochberg procedure. (Signal) Weighted harmonic mean of the observed/expected ratio and −log (FDR), (gene count) the number of proteins annotated with a particular term. The results highlight the genes as significant regulators associated with CD4 naive cells.