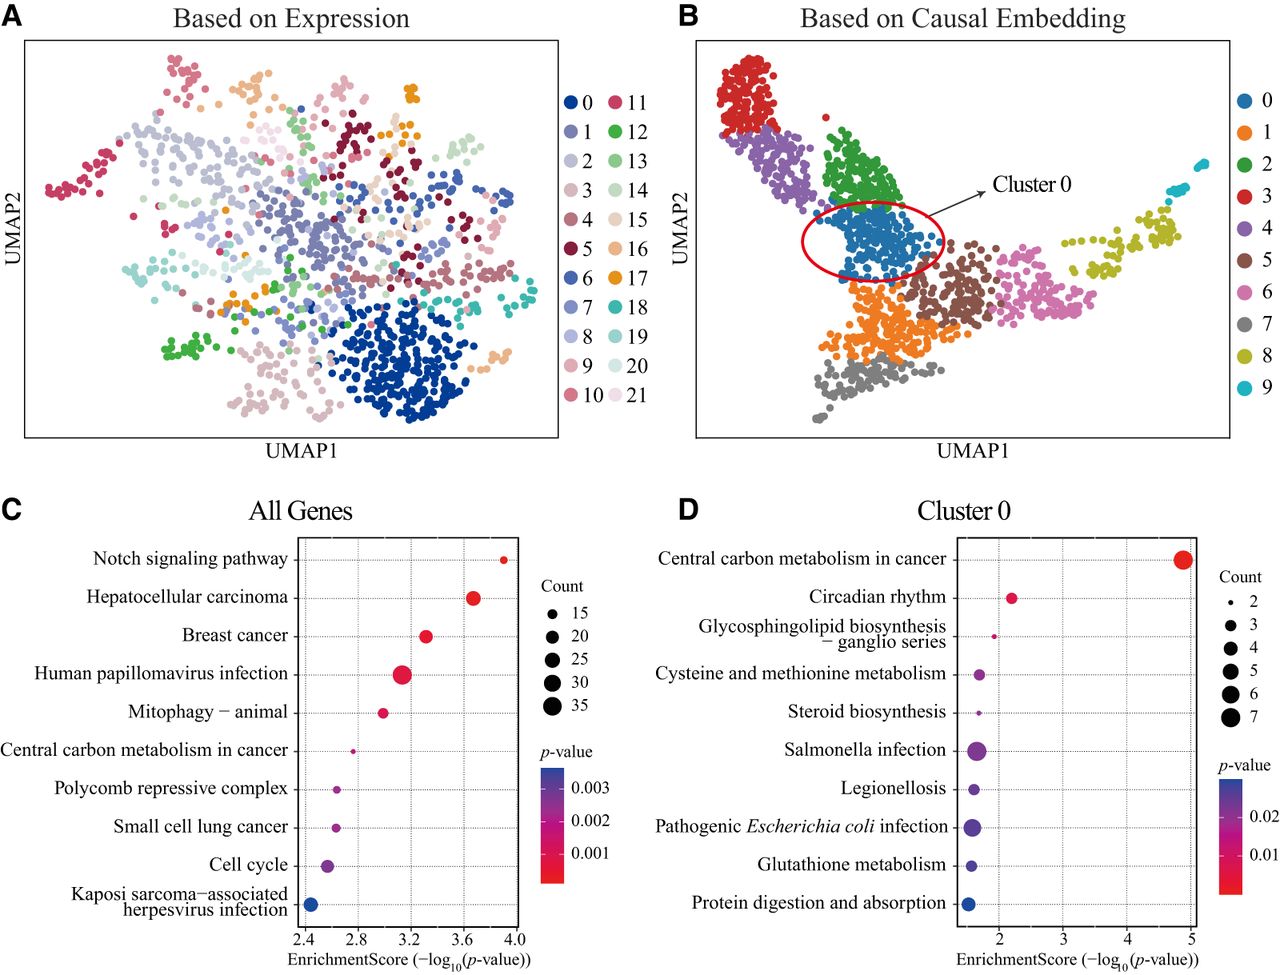
Figure 6.
Illustration of PRISM-GRN to improve understanding of gene functions. (A) UMAP plot of genes in the A549 data set based on the raw gene expression, colored by the Leiden clustering results. (B) UMAP plot of genes in the A549 data set based on the trained latent embeddings (zGRN), colored by the Leiden clustering results. (C) KEGG enrichment analysis results using all genes in the A549 data set. (D) KEGG enrichment analysis results using genes in cluster 0, highlighting more significant pathway terms compared with the analysis based on all genes.