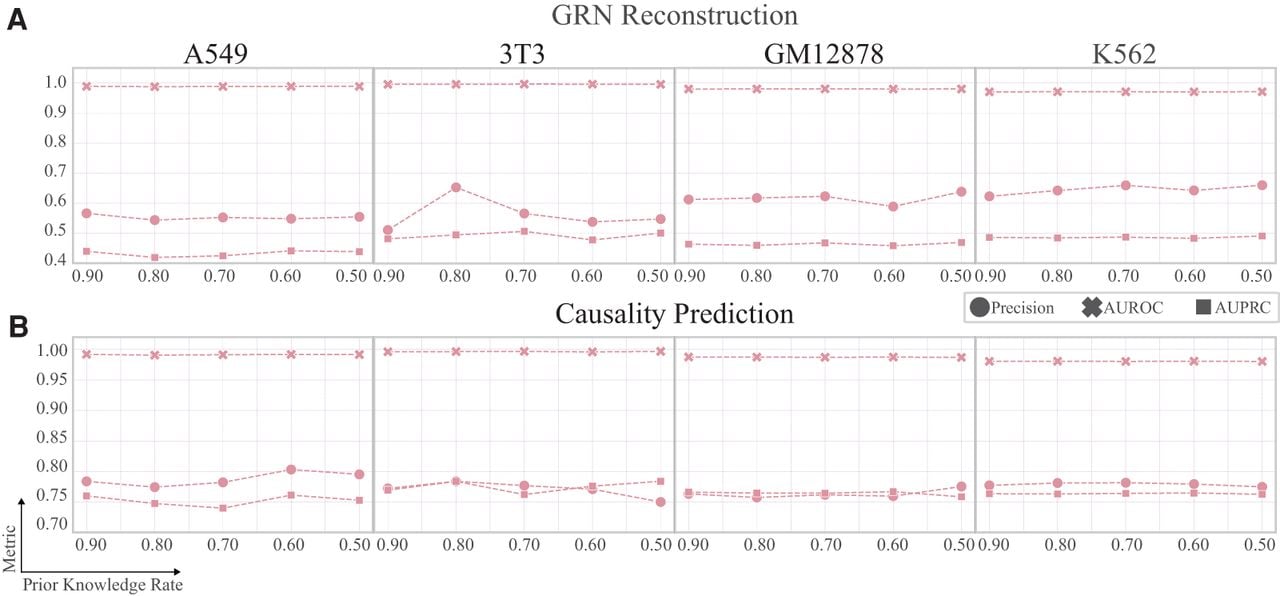
Figure 5.
Performance evaluations with decreased prior knowledge. (A) Line plots showing the changes in precision, AUROC, and AUPRC across different data sets as the proportion of prior knowledge decreases from 0.9 to 0.5 with intervals of 0.05. PRISM-GRN maintains stable performance across all metrics during GRN reconstruction. (B) Line plots illustrating the changes in performance metrics for causality prediction. Similarly, PRISM-GRN maintains its performance even as prior knowledge decreases.