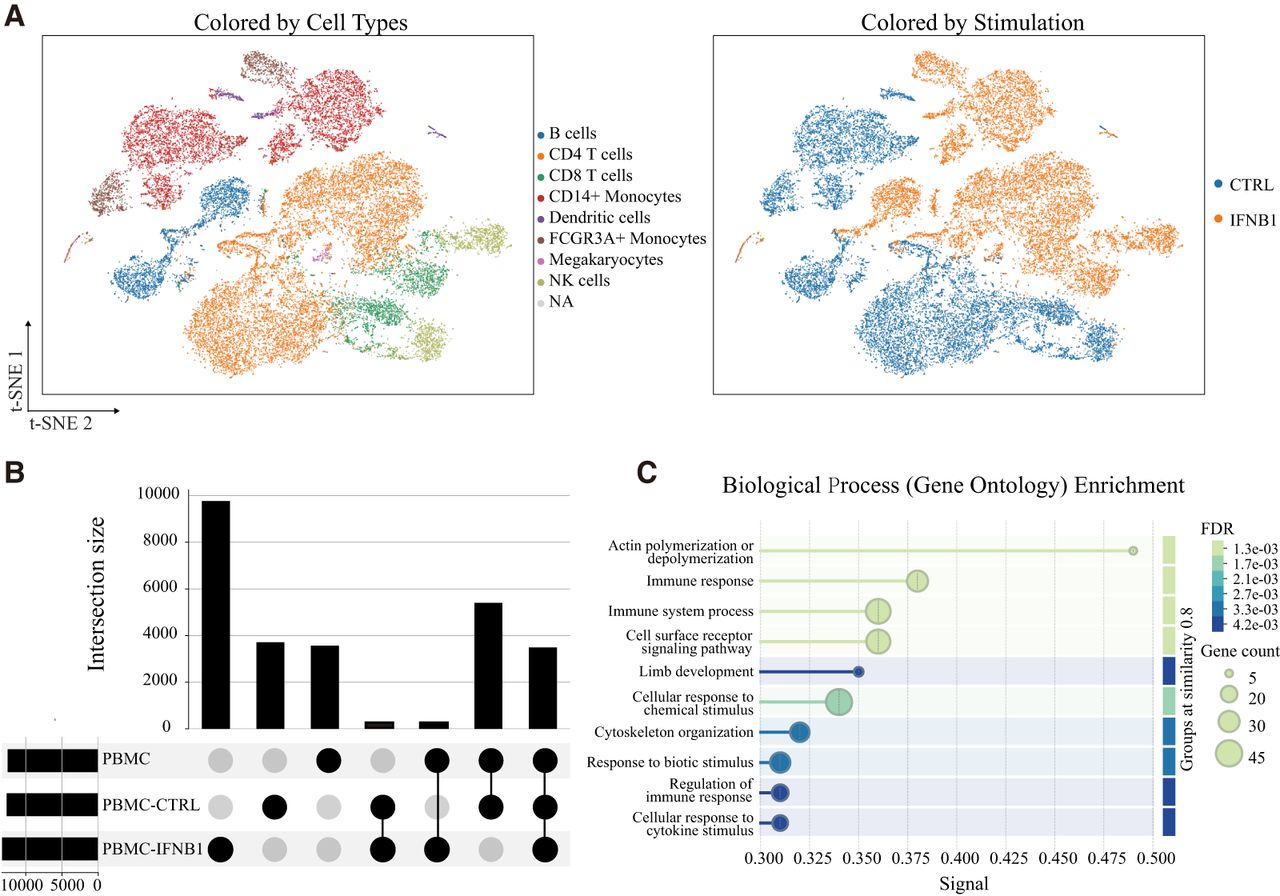
Illustration of PRISM-GRN for recovering context-specific GRNs. (A) t-SNE plots of the PBMC-ID data sets, with cells colored by type and stimulation status annotations. Focusing on CD4 T cells, they reveal distinct phenotypic changes induced by IFNB1 stimulation. (B) UpSet plot of the three reconstructed GRNs for CD4 T cells in the PBMC and PBMC-IFNB data sets. The reconstructed GRNs of CD4 naive T cells in both the PBMC and PBMC-CTRL data sets exhibit high consistency, whereas the GRN of IFNB1-stimulated CD4 T cells shows substantial divergence, suggesting a regulatory network shift. (C) GO enrichment analysis on the top 200 genes with the highest degree in the reconstructed GRN for IFNB1-stimulated CD4 T cells. The enriched terms are closely associated with immune response and cell development, potentially reflecting the impact of IFNB1 stimulation.