
Identification of Multiple Genetic Loci Linked to the Propensity for “Behavioral Despair” in Mice
Abstract
The forced swim test (FST) and tail suspension test (TST) are widely used and well established screening paradigms for antidepressants. A variety of antidepressive agents are known to reduce immobility time in both FST and TST. To identify genetic determinants of immobility duration in both tests, we analyzed 560 F2 mice from an intercross between C57BL/6 (B6) and C3H/He (C3) strains. Composite interval mapping revealed five major loci (suggestive and significant linkage) affecting immobility in the FST, and four loci for the TST. The quantitative trait loci (QTL) on chromosomes 8 and 11 overlap between the two behavioral measures. Genome-wide interaction analysis, which was developed to identify locus pairs that may contribute epistatically to a phenotype, detected two pairs of chromosomal loci for the TST. The QTL on chromosome 11 and its associated epistatic TST–QTL on chromosome X encode γ-aminobutyric acid type A (GABAA) receptor subunits as candidates. Sequence and expression analyses of these genes from the two parental strains revealed a significantly lower expression of the α1 subunit gene in the frontal cortex of B6 mice compared to C3 mice. The present quantitative trait study should open up avenues for identifying novel molecular targets for antidepressants and unraveling the complex genetic mechanisms of depressive and anxiety disorders.
Given the clinical evidence associating stress with depression (Anisman et al. 1992; Holsboer and Barden 1996), many of the preclinical models for assessing antidepressant activity have been based on abnormal behaviors precipitated by stress (Willner 1990). Two well validated paradigms are the forced swim test (FST) (Porsolt et al. 1977) and tail suspension test (TST) (Steru et al. 1985), both of which were developed over 15 years ago as screening tests for antidepressants in rodents. In the FST, mice or rats, when forced to swim in a water-filled glass cylinder from which they cannot escape, will rapidly adopt a characteristic immobile posture, making only those movements necessary to maintain their heads above water. This immobile posture is said to reflect a state of “behavioral despair” on the assumption that the animals have given up hope of escaping (Porsolt et al. 1977). The duration of immobility is reduced by most clinically used antidepressant drugs (Porsolt et al. 1977). The TST is another simple behavioral model based on an immobility response to inescapable aversive stimulation. In this test, when mice are suspended by the tail, they become immobile. As in the FST, immobility in the TST is sensitive to a wide variety of antidepressants (Steru et al. 1985). The duration of immobility in both tests has been inferred as an index of behavioral despair, where longer durations of immobility imply a greater degree of behavioral despair.
Several studies have reported interstrain differences both in baseline performances and the response to antidepressant drugs in the FST (Porsolt et al. 1978; Lucki et al. 2001) and the TST (Van der Heyden et al. 1987; Trullas et al. 1989; Vaugeois et al. 1997; Liu and Gershenfeld 2001). Because the reactivity to therapeutics is affected by manifold processes of drug metabolism, we believe that the baseline immobility time can more suitably depict an innate vulnerability to stressors and a predisposition to despair under distress. Therefore, in this study, we aimed to determine constitutive genetic factors in mice that contribute to baseline performance in the FST and TST, by means of a quantitative trait loci (QTL) approach. It is known that most antidepressants maximally reduce the TST duration of immobility with doses less than those required for the FST (Liu and Gershenfeld 2001), and that selective serotonin reuptake inhibitors are more active in the TST than in the FST (Porsolt and Lenegre 1992). These differences in the profile of pharmacological responsiveness in the FST and TST render it interesting to see how much the genetic underpinnings of the FST and TST immobilities overlap or are distinct. In light of evident polygenic bases for the behavioral characteristics and multiple molecular interactions of immobility, any analysis limited to treating each locus independently would not be sufficient. It is important to establish whether and how the loci contributing to phenotype interact. Such epistatic interactions have been reported to contribute to the variability of other complex phenotypes, including circadian behavior in mice (Shimomura et al. 2001). In the present study, we investigated the role of locus interactions in the FST and TST immobilities by performing genome-wide pairwise interaction analysis, in addition to conducting a conventional single-locus QTL assay.
The similarity between the mouse and human genomes and the likely availability of genomic sequences of several mouse strains in the near future make mice an excellent model for elucidating complex traits. We hope that the molecular dissection of the psychological variations in mice could help to identify genetic substrates associated with the vulnerability to clinical depression and anxiety in humans which antidepressants ameliorate, and to develop novel therapeutics targeting new genes.
RESULTS
Behavioral Measurements of F0, F1, and F2 Mice
We first examined the immobility profiles of four conventionally used mouse strains (eight-week-old males), C57BL/6 (B6), BALB/c, DBA/2, and C3H/He (C3), in the FST and TST (Table1), to determine strain differences in our measuring system. The automated devices employed in the present study were previously reported to be reliable for antidepressant screening using the FST (Sugiura et al. 1997) and TST (Okada et al. 1989). In both behavioral tests, B6 mice showed the longest and C3 mice displayed the shortest immobility times in our system, making these two extremes suitable for genetic analysis. Next, we tested the two strains for a gender-dependent sensitivity to the FST and TST, and observed no significantly different immobilities between male and female cohorts in both paradigms (Table 1). Therefore, we prepared F1 mice from intercrosses between B6 females and C3 males. Although cross-specific effects in the F1 generation (Ramos et al. 1999) were not examined, further examination of male and female B6C3 F1 hybrid phenotypes did not show any inter-gender differences in immobility responses (Table 1). We used a total of 560 F2 animals from the F1 parents for phenotypic and genetic analyses. The F2 distributions of immobility periods in both the FST (Fig.1A) and TST (Fig. 1B) were unimodal and roughly symmetrical (skewness: 0.39 for FST, 0.36 for TST), and their distribution widths almost conformed to those of normal distributions (kurtosis: −0.19 for FST, −0.28 for TST), supporting polygenic regulation of these traits. The phenotypic analysis of F1 and F2 generations estimated broad-sense heritabilities of 0.53 and 0.45 for the FST and TST, respectively. The latter value is higher than that (0.31) reported by Liu and Gershenfeld (2001). The phenotypic correlation between the FST and TST immobilities in the F1 mice (n = 124) (Fig. 2A) was 0.166, and 0.129 in the F2 mice (n = 560) (Fig. 2B). The genetic correlation of the two phenotypes estimated by using the F1 and F2 populations was 0.09 (Falconer and Mackay 1996).
Summary of the Immobility Times for F0, F1, and F2 Mice
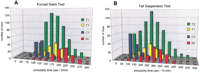
Frequency histogram of phenotypic measurements for each generation. (A) The distribution of immobility times for the forced swim test. The numbers of mice used for behavioral scoring were 126 for B6, 124 for C3, 126 for F1, and 560 for F2. (B) The distribution of immobility times for the tail suspension test. The numbers of mice used in the analysis were 122 for B6, 121 for C3, 124 for F1, and 560 for F2.
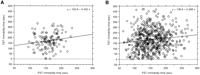
Correlation of immobility times between the forced swim test (FST) (X-axis) and tail suspension test (TST) (Y-axis). (A) Correlation in F1 mice (n = 124). Correlation coefficient r = 0.166, P = 0.063 (B) Correlation in F2 mice (n = 560). r = 0.129, P = 0.002
Single-Locus QTL Analysis
The genome screen was performed by genotyping all 560 F2 mice using 120 fluorescently labeled primers covering the whole genome with an average intermarker distance of 11 cM (Dietrich et al. 1996). The largest intermarker interval was 23 cM, which spanned betweenD5Mit388 and D5Mit10. Single-locus QTL mapping was performed on the data using CARTOGRAPHER 1.21with the method of composite interval mapping (Lloyd et al. 2001). Composite interval mapping has several advantages over simple interval mapping (Zeng 1993). In the former, the markers can be used more efficiently as boundaries for locating QTLs, and the resolution of QTL locations can be greatly increased. Additionally, in simple interval mapping when QTLs are linked in the repulsion or the coupling phase, peaks of the test statistics can be underestimated or overestimated, respectively. The results of a whole genome analysis using the composite interval mapping approach are shown in Figure3. The peak lods which exceeded the threshold (lod 2.8) for suggestive linkage (Lander and Kruglyak 1995) were obtained on chromosomes 6, 8 (two QTLs on 8), 11, and 17 for the FST, and on chromosomes 4, 8, 11, and 14 for the TST (Fig. 3). The signal on chromosome 2 for the FST fell just below the threshold. Significant thresholds (genome-screen P-value < 0.05) calculated using the ZMAPQTL program inCARTOGRAPHER, were evaluated to be 3.65 for the FST and 3.60 for the TST by 3000 permutations of the data sets of behavioral scores and genotypes for all 560 mice. In the FST, one of the two linkage peaks on chromosome 8 and the peak on chromosome 11 fulfilled the criteria of genome-wide significance (Fig. 3). In the TST, the peak lod score on chromosome 11 reached a significant level (Fig. 3). The signal on chromosome 4 in the FST was close to a significant level. Two genomic regions, representing a common locus for the FST and TST, one near the D8Mit242 marker and the second adjacent toD11Mit271, showed an overlap in each test with a 1-lod support interval (∼90% confidence interval).
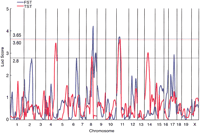
Lod score plots for the whole genome obtained for 560 F2 animals. The results of both the forced swim test (FST) and tail suspension test (TST) are shown. Lod scores were calculated usingCARTOGRAPHER and the composite interval mapping approach under the unconstrained genetic model. Thresholds of significant linkage (genome-wide P < 0.05) for the FST and TST were estimated by permutation analysis, and were 3.65 and 3.60, respectively. A suggestive lod score was taken as 2.8 (Lander and Kruglyak 1995).
The mean phenotypic values for each QTL and results of tests for additive and dominant models with respect to the C3 allele are shown in Table 2. The QTL on chromosome 6 for the FST is best fitted by a dominant model for the C3-like QTL byCARTOGRAPHER, although the C3 allele is associated with increased immobility. Another dominance for the FST was detected for the C3-like QTL on chromosome 11. The QTLs for the FST on the two loci of chromosome 8 linked to the D8Mit242 andD8Mit93 fit additive models in which the B6-like QTLs are associated with increased immobility time (Table 2). The QTL for the TST linked to the D8Mit242 fit the same additive model, but the B6 allele had an opposite effect on the phenotype. The other QTLs acting in an additive fashion were seen on chromosome 17 for the FST, and chromosomes 4, 11, and 14 for the TST (Table 2). The common QTL which is linked to the D11Mit271 showed a different fit model for each phenotype, but the C3-derived allele reduced immobilities in both tests. The finding that three of the QTLs described here are best fitted by models in which the C3-like QTL is associated with increased immobility duration (Table 2) is consistent with polygenic traits for which sensitive (B6) and resistant (C3) strains to the stress-related behavioral tests may carry both increasing and decreasing alleles, although most decreasing alleles are usually derived from the resistant strain. Figure 4 compares the linkage results of two overlapping loci for the FST and TST obtained by performing different algorithms, and shows that the heights and positions of suggestive and significant QTLs are almost the same in composite interval mapping and simple interval mapping. However, between the two programs there were several inconsistencies with small QTLs for the FST and TST. This may have been derived from the residual genetic influences of neighboring markers, variables which simple interval mapping does not take into account (Zeng 1994). The other significant and suggestive QTLs listed in Table 2 were also confirmed by the MAPQTL (data not shown). Assuming that these QTLs act independently and additively, the suggestive and significant QTLs (Table 2) account for 33% of the genetic variation for immobility in the FST and 26% for the TST.
QTLs Influencing Immobility Times in the Forced Swim Test and Tail Suspension Test
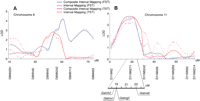
Comparison of lod score curves analyzed by means of composite interval mapping and interval mapping on (A) chromosome 8 and (B) chromosome 11. The two chromosomes showed overlapping QTLs between the forced swim test (FST) and tail suspension test (TST). The composite interval mapping was performed usingCARTOGRAPHER, and interval mapping byMAPQTL.
Two-Locus Interaction Analysis
The relatively small proportions of variance explained by the independent QTLs in the FST and TST imply contributions from a number of other QTLs with small effects and/or with epistatic actions. Therefore, we examined all pairwise combinations of marker loci for associations with the traits in a novel two-dimensional genome scan to detect epistatic interactions. The combination of genotypes examined for the pairwise loci (locus 1:locus 2) included three different groups: B6/B6:B6/B6 {120 × (120 + 1)/2 = 7260 combinations for each FST and TST}, C3/C3:C3/C3 (7260 for each), and B6/B6:C3/C3 (120 × 120 = 14,400 for each). The last category of genotype combination was used in analysis to determine potential interactions between immobility-reducing alleles carried by both B6 and C3 mice, and between immobility-enhancing alleles of B6 and C3. We computed the two-way ANOVA F-statistic and corresponding lod score for each marker pair by using our own analysis tool (Nakaya et al. 1999). Significant genome-wide thresholds of F-values and lod scores (for α = 0.05 and 0.01) were simulated by 1000 permutations for the three different genotype pair categories in the FST and TST. These analyses revealed two pairs of B6-derived double homozygotes at the marker combinations of D11Mit271:DXMit172 and D6Mit183:D11Mit271, that exceeded the α = 0.01 and 0.05 permutation critical values, respectively (Fig. 5A, Table3). The two pairs accounted for 8.3% of phenotypic variation of the TST. As shown in Figure 5, the double B6 homozygotes at the D11Mit271:DXMit172 locus pair (Fig. 5B) and the D6Mit183:D11Mit271 pair (Fig. 5C) exhibited increments of immobility larger than the additive effects of single B6 homozygotes at each locus, suggesting ‘true’ epistatic interactions in these two pairs of locus combinations. The D11Mit271 is one of the major QTLs for the TST. However, the D6Mit183 is located at the bottom between two neighboring lod peaks in the composite interval mapping and simple interval mapping for TST (data not shown). Thus, this locus alone does not seem to have a meaningful effect on the TST phenotype. Marker D6Mit183 is roughly 21 cM proximal to the FST-QTL on the same chromosome. DXMit172 showed a nonsignificant peak of lod (<1) in the composite interval and simple interval analyses of TST, suggesting that in isolation this locus has only a weak effect. Since mean TST immobility did not differ significantly between males and females of parental B6 mice (Table 1) and of the F2 mice with doubly homozygous B6 alleles at theD11Mit271 and DXMit172 loci (Fig. 5B), the B6 allele at DXMit172 locus is deemed to act dominantly to enhance immobility in combination with the B6 alleles at theD11Mit271. Additional digenic clusters that approached the significance threshold (for α = 0.05) included: B6/B6:B6/B6 atD11Mit271:D19Mit10 in the FST (lod 4.4 < critical lod 4.5), C3/C3:B6/B6 at D4Mit269: D17Mit185 in the FST (lod 4.3 < 4.4), and C3/C3:B6/B6 at D14Mit257: DXMit170in the TST (lod 4.3 < 4.4)
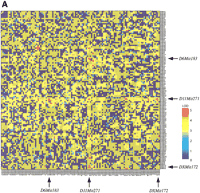
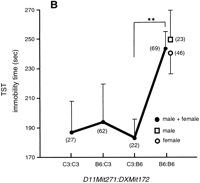
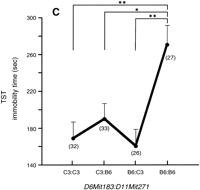
Genome-wide scan for tail suspension immobility. (A) Pairwise marker genome scan. The x and y axes of the figure show genetic markers that are homozygous for B6 alleles for all chromosomes. The axis starts with chromosome 1 (left of xaxis, top of y axis) and ends with chromosome X (right ofx axis, bottom of y axis). The color scale indicates lod scores. The markers for significant locus pairs (Table 3) are indicated by arrows. (B) Graph showing the genotype vs. the mean immobility times in the tail suspension test (TST) at a significantly interacting locus pair: the double B6 homozygote at the locus combination of D11Mit271:DXMit172 showed a lod score of 5.6 (significant at α = 0.01). Parentheses show the number of animals with indicated genotypes. ** P < 0.01 by Bonferroni/Dunn test. (C) The double B6 homozygotes at the locus pair of D6Mit183:D11Mit271 showed the lod score of 5.0 (significant at α = 0.05). * P < 0.05.
Significant Marker Pairs from Genome-Wide Interaction Analysis
Of the marker combinations of the four major single QTLs (Table 2) positioned on the diagonal, running from the top left to bottom right diagonal of Figure 5A, the chromosome 4 and 11 markers showed relatively high lod scores but the chromosome 8 and 14 markers did not. An explanation may be that in the former two marker loci, B6-derived alleles increased TST immobility in a “recessive” Mendelian fashion, whereas in the latter two loci, B6 alleles decreased immobility time in a “dose-dependent” or “dominant” manner (Table 2).
We named the FST- and TST-QTLs identified in this study Fst-1to Fst-4 and Tst-1 to Tst-6, respectively, according to the magnitude of single-locus lod scores and epistatic lods. The data are summarized in Figure 6.
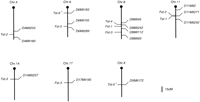
Chromosomal locations of mapped FST- and TST-loci. Each vertical bar represents a mouse chromosome, with the centromere denoted by a black circle. Loci to the left of each chromosome are those identified in this study, and loci to the right are flanking microsatellite markers. Loci with asterisks are those identified only by the epistatic interaction analysis.
Candidate Gene Analysis
The region of overlapping peak lods for the FST and TST on chromosome 11 (90% confidence interval) spanned the GABAAgene cluster, encoding α1 (Gabra1), α6 (Gabra6), and γ2 (Gabrg2) subunit genes. The human syntenic region of this mouse genomic interval corresponds to 5q32–q35 (http://www3.ncbi.nlm.nih.gov/Homology/), where an additional human GABAA subunit gene (β2) is located. We localized the mouse β2 subunit (Gabrb2) close to the Gabra1 andGabrg2 genes by radiation hybrid mapping (Fig. 4B). The one-lod support interval of the peak near the DXMit172, which interacts with the D11Mit271 locus in the TST contains another GABAA subunit gene, α3 (Gabra3) (http://www.informatics.jax.org/). Activation of GABAAreceptors results in an inward flow of chloride ions and consequently neuronal hyperpolarization (Roberts and Sherman 1993). These receptors are pentameric complexes of different subunit polypeptides (α1–6, β1–3, γ1–3, etc.) (Cherubini and Conti 2001). Reduced cortical GABA levels in depressed patients have been noted by proton magnetic resonance spectroscopy (Sanacora et al. 1999). Human linkage studies of bipolar disorder have identified susceptibility loci on 5q32–35 (Edenberg et al. 1997), and Xq26–28 (Pekkarinen et al. 1995; Stine et al. 1997) to which the GABRA3 maps. Linkage analysis of panic disorder also highlighted 5q33 (Crowe at al. 2001) and Xq28 (Crowe at al. 2001; Gelernter et al. 2001). In addition, a nonsynonymous polymorphism of the Gabrg2 gene is reported as a candidate for a QTL involved in alcohol withdrawal (Buck and Hood 1998), and clinical comorbidity of depression and alcoholism is well known (Ross et al. 1988). This evidence prompted us to screen for functional polymorphisms of the GABAA gene family in the B6 and C3 strains as excellent candidates for the QTLs on chromosome 11. A knockout of the gene encoding a 65-kD isoform of glutamate decarboxylase (located on mouse chromosome 2), a GABA-synthesizing enzyme, resulted in decreased immobility in the FST (Stork et al. 2000), further supporting the idea. Examination of the open reading frames of these genes identified one missense polymorphism in the Gabra6 gene: Glu357Gln (1069G > C: B6 > C3). However, since α6 is localized almost exclusively in cerebellar granule cells (Fritschy and Mohler 1995), functional significance of the polymorphism in immobility time is unclear. Expression levels of the other genes were evaluated in the B6 and C3 mice, since alterations in promoter sequences could alter gene expression in the regions of the brain responsible for emotions, for example, the frontal cortex and hippocampus (Watanabe 1999). Quantitative RT-PCR analysis revealed a significantly reduced expression of the Gabra1 gene (P < 0.05) in the frontal cortex of B6 mice compared to C3 mice (Table4). The α1 subunit is ubiquitously distributed in the brain (Wisden et al. 1992). Further genomic scrutiny of the Gabra1 gene is warranted.
Expression Levels of the GABAA Subunit Genes in B6 and C3 Mice
DISCUSSION
Our phenotypic survey showed that the order of FST immobility among mouse strains is similar to that reported by Lucki et al. (2001). For TST immobility, however, the present results are not consistent with those of Liu and Gershenfeld (2001), who reported an order of C3 – Balb/cJ – B6 – DBA/2J for long-to-short immobility period and a significantly greater immobility duration of female B6 mice compared to males. As recently pointed out by Mayorga and Lucki (2001), one of the confounding factors in TST experiments is a “tail-climbing” behavior seen particularly in B6 mice. The tail climbing period tends to be scored as immobility by the machine. To prevent this behavior, and thus reduce this source of error, we fixed the tip of the mouse tail to a small hook using tape. This hook was connected to the end of a perpendicular line wire, attached to a strain gauge. This contrasts with fixing the mouse tail to a horizontal bar as described by Mayorga and Lucki (2001). When a retaining bar is in close vicinity to a mouse, there is an increased tendency for the mouse to climb up its tail and grasp the bar. Using our method, the proportion of mice showing this climbing behavior was about 10% and less than 5% in the B6 F0 and F1/F2 populations, respectively. Interestingly, almost all of the mice that showed tail-climbing were female. These mice were excluded from the present analyses. Other potential causes of discrepancy in the TST immobility data between our lab and that of Liu and Gershenfeld (2001) may be drift in genetic strains propagated in different countries (Japan and the U.S.), and/or a lack of replicability of behavioral testing between different laboratories as demonstrated by Crabbe et al. (1999).
It is also interesting that the response to antidepressants differs between mouse strains. For example, B6 mice are reported to be responsive to desipramine whereas C3 mice are not (Lucki et al. 2001). Although we did not examine pharmacogenetic traits in this study, differential sensitivity to drugs may also be related to phenotypic variations between mouse strains.
To characterize the genetic polymorphisms affecting immobility periods in the FST and TST, we conducted a comprehensive QTL analysis, applying a novel pairwise epistatic analysis in addition to conventional composite/simple interval mappings. An interesting and unexpected finding of the present study is the small number of shared QTLs between the FST and TST despite the similarity between the test paradigms: the combined variance of QTLs on chromosomes 8 and 11 was 47% of the total variance explained by all major QTLs for the FST, and 48% of those for the TST (Table 1). The degree of sharing depends, of course, on the parent strain combinations used to make the intercross progeny. Moreover, it is noteworthy that the potentially common QTL on chromosome 8 exhibited the opposite effect on the immobility times of the FST and TST. The other common QTL, located on chromosome 11 and whose lod curves almost completely overlapped in the FST and TST, seemed to act in different genetic modes regarding the C3-derived allele. It acted in the FST in a dominant fashion by decreasing immobility and in an additive manner in the TST. All these factors should contribute to the small value of genetic correlation (0.09) found in the two phenotypes. Although many types of antidepressive therapeutics are generally effective in alleviating despair-like behavior in both tests, these results imply that the distinct gene pathways underlying the two phenotypes may correspond to the differences in pharmacological profiles of antidepressants that reduce immobilities in the FST and TST (Porsolt and Lenegre 1992; Liu and Gershenfeld 2001; Lucki et al. 2001).
Antidepressants are used clinically to combat both depression and anxiety disorders, with the two diseases often occurring together (Breier et al. 1984; Savino et al. 1993). Therefore it is intriguing to compare the QTLs detected in the present study to those reported for stress/anxiety-related paradigms. Flint et al. (1995) mapped emotionality traits in mice defined by open-field activity, Y-maze performance and performance in an elevated plus maze to chromosomes 1, 4, 12, 15, 17, and 18. Their QTLs on chromosomes 4 and 17 are approximately 20 cM and 15 cM proximal to the TST-QTL on chromosome 4 and FST-QTL on chromosome 17 in our study, respectively, suggesting a potential overlap. QTLs for contextual fear conditioning (Caldarone et al. 1997; Wehner et al. 1997) and light-to-dark transition (Mathis et al. 1995; Gershenfeld and Paul 1997) were correlated to chromosomes 1, 2, 3, 10, and 16, but none of them coincided with our chromosomes. The QTLs exclusively observed in the FST and TST sensitivities may unveil susceptibility loci for as yet unpursued emotional traits.
We focused on the GABAA subunit genes as candidates for QTLs on chromosomes 11 and X. Benzodiazepine compounds, which are used as anxiolytics, are known to be generally ineffective in ameliorating immobility in the screening tests, and in treating depression, although they act on the GABAA receptor complex. Thus, the GABAA genes may not seem to have a direct relevance to immobility and depression. However, the benzodiazepines have a muscle relaxant action and can bind to a “peripheral type” receptor that exists in the brain and is distinct from the GABAA complex (Lin et al. 1993). In addition, there are manifold combinations of subunits in the GABAA pentameric assembly, the stoichiometry of each combination varying among different brain regions (Mehta and Ticku 1999). Specific agents for probing individual GABAAsubunits are not available at present. It is therefore difficult to delineate the roles of specific GABAA subunit genes in immobile behaviors and clinical targets from only the pharmacological observations. We have found reduced expression of the Gabra1gene in the frontal cortex of B6 mice compared to C3 mice. However, in order to determine the causative effect of the gene, further studies including transgenic experiments will be necessary.
Our epistatic interaction analysis identified two pairs of genomic loci contributing to the immobility response in the TST. The locus on chromosome 11 shared by both pairs was detected by single QTL analysis, but the pendant locus of each pair emerged only with the pairwise analysis. These epistatic QTL strategies could provide important information for disentangling complex human traits. At present this analysis is difficult to conduct in human linkage studies, partly due to sample heterogeneity and the limitations of sample numbers. The residual variances in the FST and TST which are not explained by the present QTLs are likely due to minor genetic loci and their complex and higher-order interactions. These results may be relevant to the human linkage evidence that indicates multiple predisposing loci with weak to moderate effects for affective illnesses (Detera-Wadleigh et al. 1999) and panic disorder (Crowe et al. 2001; Gelernter et al. 2001).
We have embarked on refining the regions of individual QTLs and identifying responsible genes, by developing consomic mice (Nadeau et al. 2000). The present multipronged QTL analyses and future work will be of benefit in identifying human alleles that predispose to general distress, a risk factor for psychiatric disorders, and will provide a rationale for the design of new drugs.
METHODS
Mice
The four inbred strains of BALB/c, C3H/He, C57BL/6, and DBA/2 Cr, and B6C3 F1 hybrid mice (female B6 × male C3) were obtained from Japan SLC (Shizuoka, Japan). The F2 generation was produced by randomly intercrossing the F1s. Two hundreds and sixty of the F2 animals were male, and 300 were female.
Behavioral Measurements
On day 1, TST was performed. An automated TST device (NS-TS/4, NEUROSCIENCE, Tokyo, Japan) equipped with a four-channel scoring system was used to measure the duration (sec) of immobility in the TST. The machine analyzed four animals simultaneously. A mouse was suspended by the tail with Scotch tape from a small hook at one end of a perpendicular line wire, which was connected to a strain gauge. The strain gauge detected movements of the mouse and transmitted them to a central unit. The total duration of immobility was automatically calculated as the time the force of the mouse's movements was below a present threshold criterion (i.e., immobile and not struggling) during a 10-min TST session. Data used in analysis were collected after a 100-sec accustomization period.
On day 2, the pre-session of FST was conducted. Each mouse was placed in a transparent glass cylinder (25 cm high, 20 cm in diameter), containing water at 25°C ± 0.5 to a depth of 14 cm, and was forced to swim for 15 min. On day 3, the mouse was placed in the same pool, and the duration of swimming was measured by using Supermex (Muromati Kikai, Tokyo). Supermex consists of a sensor monitor mounted above the swimming pool to detect heat changes across multiple zones of the water surface, through an array of Fresnel lenses. The body heat radiated by an animal is detected by the sensor head of the monitor, which contains paired infrared pyroelectric detectors. Our Supermex system was capable of analyzing 16 channels, allowing simultaneous scoring of 16 animals in individual cylinder pools. The immobility time (sec) was calculated as the difference between a duration of session (300 sec) and swimming (moving) time.
The TST is thought to be less stressful than the FST (Thierry et al. 1986), and therefore the prior performances of the TST did not influence the phenotypic measurements of subsequent FST experiments (data not shown). We adopted a two-session procedure in the FST, instead of a conventional single session for mice. Using this regime, we could reduce phenotypic variance.
Genotyping
DNA was extracted from 1-cm tail biopsies by using the Automatic DNA Isolation System NA-1000 (KURABO, Osaka, Japan). The DNA was used as a template in a 7.5–μL PCR. All PCRs were carried out in 96-well plates using a GeneAmp PCR System 9700 (Applied Biosystems). All F2 mice were genotyped for 120 polymorphic microsatellite markers distributed throughout the genome on average at 11 cM intervals (3.3 ∼ 23 cM). Seventy percent of these markers were chosen from the panel described by Schalkwyk et al. (1999), and the remainder from an online data base (http://carbon.wi.mit.edu:8000/cgi-bin/mouse/gmap_search?database=mouserelease). The primers for several markers were redesigned. PCR reactions were performed using fluorescently labeled primers and AmpliTaq-Gold (Applied Biosystems), and amplicons were analyzed on a 377 or 3700 sequencer (Applied Biosystems). Alleles were scored usingGENOTYPER software (Applied Biosystems).
Single-Marker QTL Analysis
We used the QTL CARTOGRAPHER computer package v.1.21 for Windows (developed by Basten et al.:http://www.stat.wisc.edu/biosci/qtlcart/qtlcart.html) to screen for QTLs by composite interval mapping. Composite interval mapping is a combination of simple interval mapping and multiple linear regression (Zeng 1993, 1994). The latter is implemented to control for residual genetic effects. Genome-wide significance (for α = 0.05) of logarithm of odds (lod) score was empirically assessed using the permutation program of the CARTOGRAPHER package. To compare the performance of composite interval mapping with that of simple interval mapping, MAPQTL 4.0 (Plant Research International, The Netherlands) was also employed. Statistical evaluation of behavioral measurements was carried out usingSTATVIEW (SAS Institute, Cary, NC).
Pairwise Genome Analysis
To assess the effect of interaction between two marker loci of a quantitative trait, we developed a program (available from the authors upon request) that performs thorough ANOVA with respect to all marker pairs. For each marker pair, the program first divides the set of individuals into two classes according to whether or not each individual has a specified pattern of genotypes at the two marker loci (e.g., B6/B6:C3/C3 at locus 1:locus 2). Next, it estimates the significance of the genotypes of the markers by comparing the variances of the trait of the two classes with that of all individuals. To indicate the significance of marker pairs, we used the F-value and corresponding lod score. The program outputs a list of marker pairs in descending order of significance. The program also calculates the main and interactive effects of the two markers to determine whether a high lod score for a marker pair is due to a combinatorial effect on the trait, or an addition of independent effects. The details of the approach and the relationship between the F-value and lod score are described elsewhere (Nakaya et al. 1999). Thresholds for significant (α = 0.05 and 0.01) lod scores and F-values for interactions were estimated through permutation testing (1000 permutations). The proportion of variance explained by a locus pair is defined as r2 = (s02 − s12)/s2, where s02 and s12 are the residual variance under the null and alternative hypotheses, respectively. s2 is the trait variance.
Quantitative RT-PCR
Seven-week-old male C3 and B6 mice (six individuals for each strain) were housed for one week under standard laboratory conditions, with free access to food and water. At 8 weeks, animals were decapitated and total RNA was extracted from the frontal cortex and hippocampus, by the acid guanidium thiocyanate/phenol chloroform extraction method (ISOGEN, NIPPON Gene, Toyama, Japan). Single-stranded cDNA was synthesized using SuperScript II RT (LIFE TECHNOLOGIES, Grand Island, NY) with random hexamers, and it was converted to double-stranded cDNA by T4 DNA polymerase (LIFE TECHNOLOGIES). Transcripts of three distinct subunits of γ-aminobutyric acid type A (GABAA) receptor, α1 (GenBank # NM_010250), α3 (NM_008067), and β2 (NM_008070) were quantified using a LightCycler-RNA Amplification Kit SYBR Green I (Roche, Mannheim, Germany). The expression level of each subunit was normalized to that of GAPDH.
Sequence Analysis and Radiation Hybrid Mapping
The nucleotide differences in the GABAA α1, α3, β2, and γ2 (NM_008073) subunits between C3 and B6 mice were examined by sequencing the open reading frame of each RT-PCR product. The sequence variations of the GABAA α6 subunits (U77409, U77410, andU77411) between C3 and B6 strains were analyzed by amplification of protein-coding exons from genomic DNAs and sequencing. The chromosomal location of the β2 subunit gene in the mouse was determined by RH mapping, using a mouse/hamster radiation hybrid panel (Research Genetics, Huntsville, AL). The map position was obtained by submitting PCR results tohttp://www.jax.org/resources/documents/cmdata/rhmap/rhsubmit.html.
WEB SITE REFERENCES
http://carbon.wi.mit.edu:8000/cgi-bin/mouse/gmap_search?database =mouserelease; mouse microsatellite marker information is available on this site.
http://www.informatics.jax.org/; mouse gene maps are available on this site.
http://www.stat.wisc.edu/biosci/qtlcart/qtlcart.html; the QTL CARTOGRAPHER computer package can be downloaded from this site.
http://www3.ncbi.nlm.nih.gov/Homology/; human-mouse conserved synteny maps are available on this site.
Acknowledgments
We thank Dr. J. Meerabux for her critical reading of the manuscript, and Drs. H. Yasue and T. Hayashi for their kind instruction on using the CARTOGRAPHER software. This work was partly funded by a grant for Research on Brain Science (H12-Nou-006) from the Ministry of Health Labor and Welfare, Japan, and a Grant-in-Aid for Scientific Research (Hoga), Ministry of Education, Japan (No. 12877153).
The publication costs of this article were defrayed in part by payment of page charges. This article must therefore be hereby marked “advertisement” in accordance with 18 USC section 1734 solely to indicate this fact.
Footnotes
-
↵3 Present address: Laboratory for Molecular Psychiatry, RIKEN Brain Science Institute, 2-1 Hirosawa, Wako, Saitama, 351-0198, Japan.
-
3Corresponding author.
-
E-MAIL takeo{at}brain.riken.go.jp; FAX 81-48-467-5916.
-
Article and publication are at http://www.genome.org/cgi/doi/10.1101/gr.222602.
-
- Received November 5, 2001.
- Accepted January 11, 2002.
- Cold Spring Harbor Laboratory Press


