
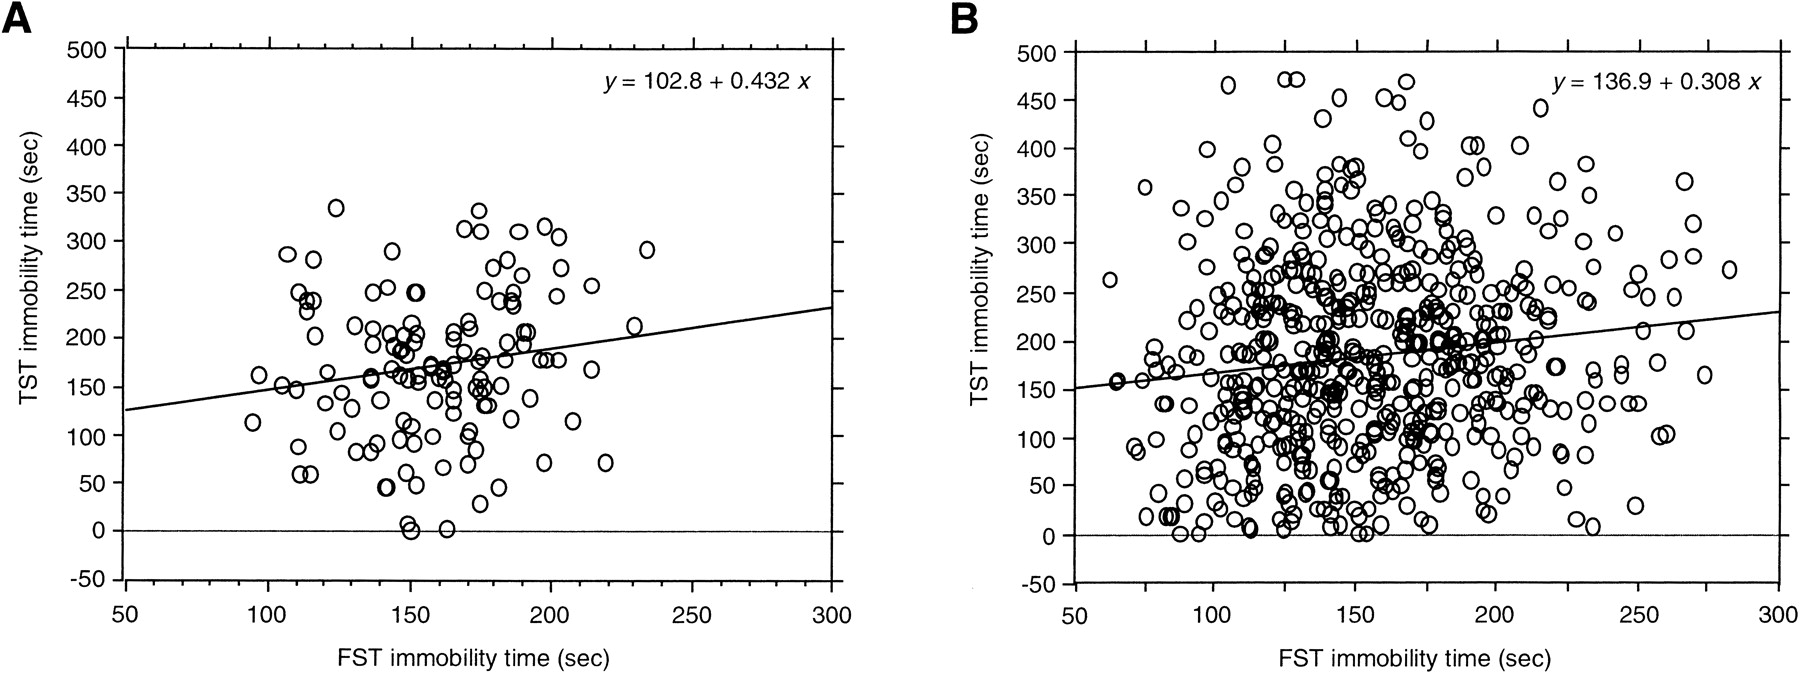
Figure 2.
Correlation of immobility times between the forced swim test (FST) (X-axis) and tail suspension test (TST) (Y-axis). (A) Correlation in F1 mice (n = 124). Correlation coefficient r = 0.166, P = 0.063 (B) Correlation in F2 mice (n = 560). r = 0.129, P = 0.002


