
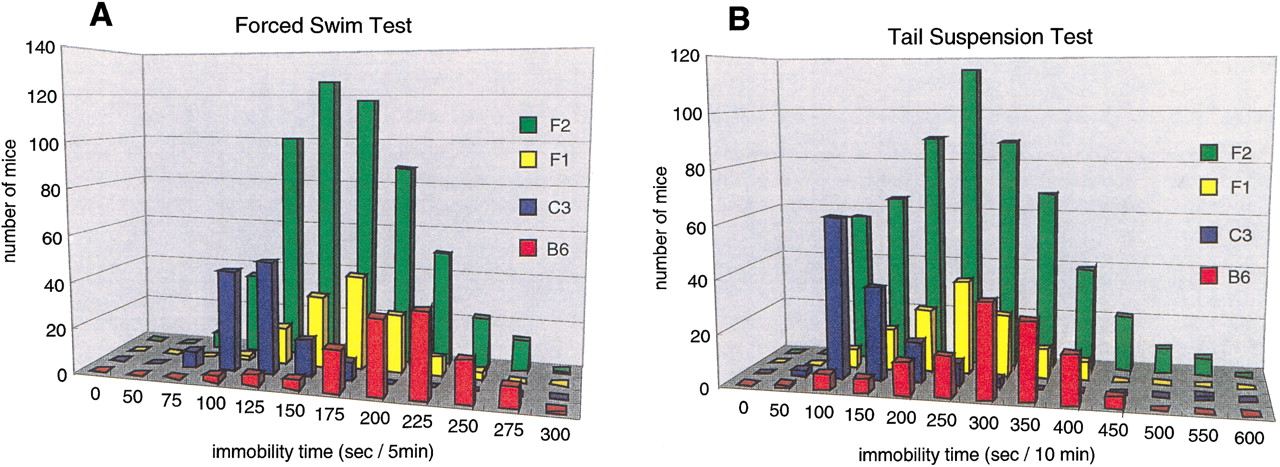
Figure 1.
Frequency histogram of phenotypic measurements for each generation. (A) The distribution of immobility times for the forced swim test. The numbers of mice used for behavioral scoring were 126 for B6, 124 for C3, 126 for F1, and 560 for F2. (B) The distribution of immobility times for the tail suspension test. The numbers of mice used in the analysis were 122 for B6, 121 for C3, 124 for F1, and 560 for F2.


