
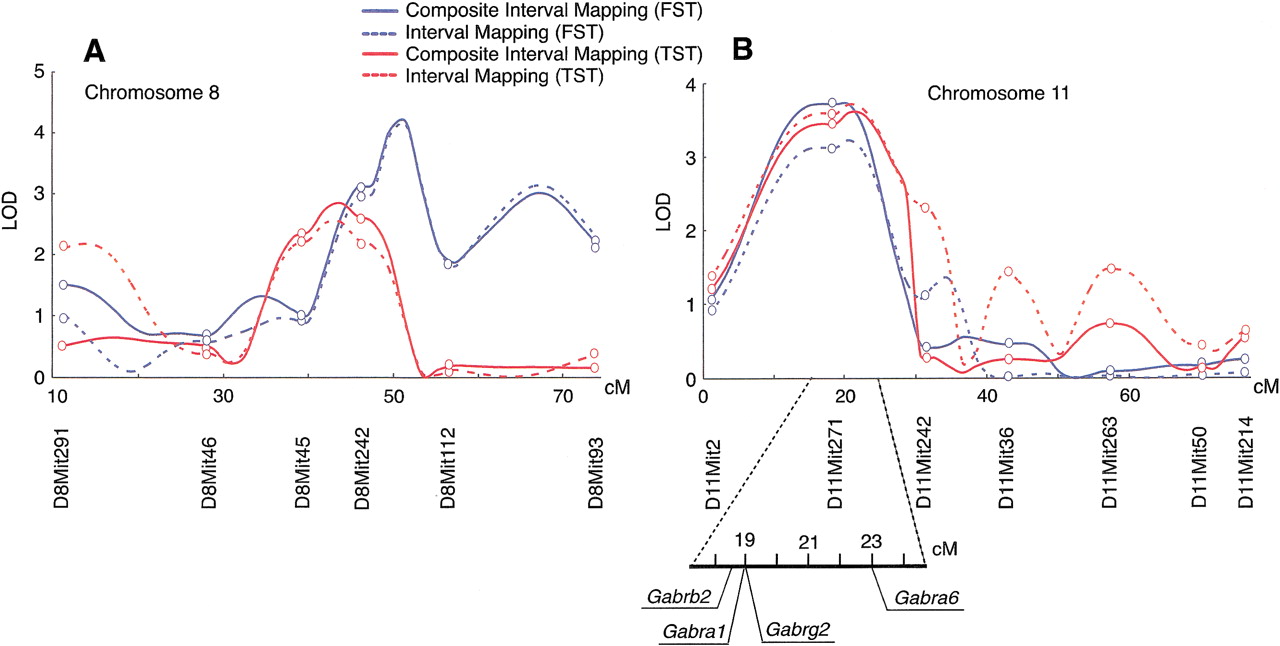
Figure 4.
Comparison of lod score curves analyzed by means of composite interval mapping and interval mapping on (A) chromosome 8 and (B) chromosome 11. The two chromosomes showed overlapping QTLs between the forced swim test (FST) and tail suspension test (TST). The composite interval mapping was performed usingCARTOGRAPHER, and interval mapping byMAPQTL.


