
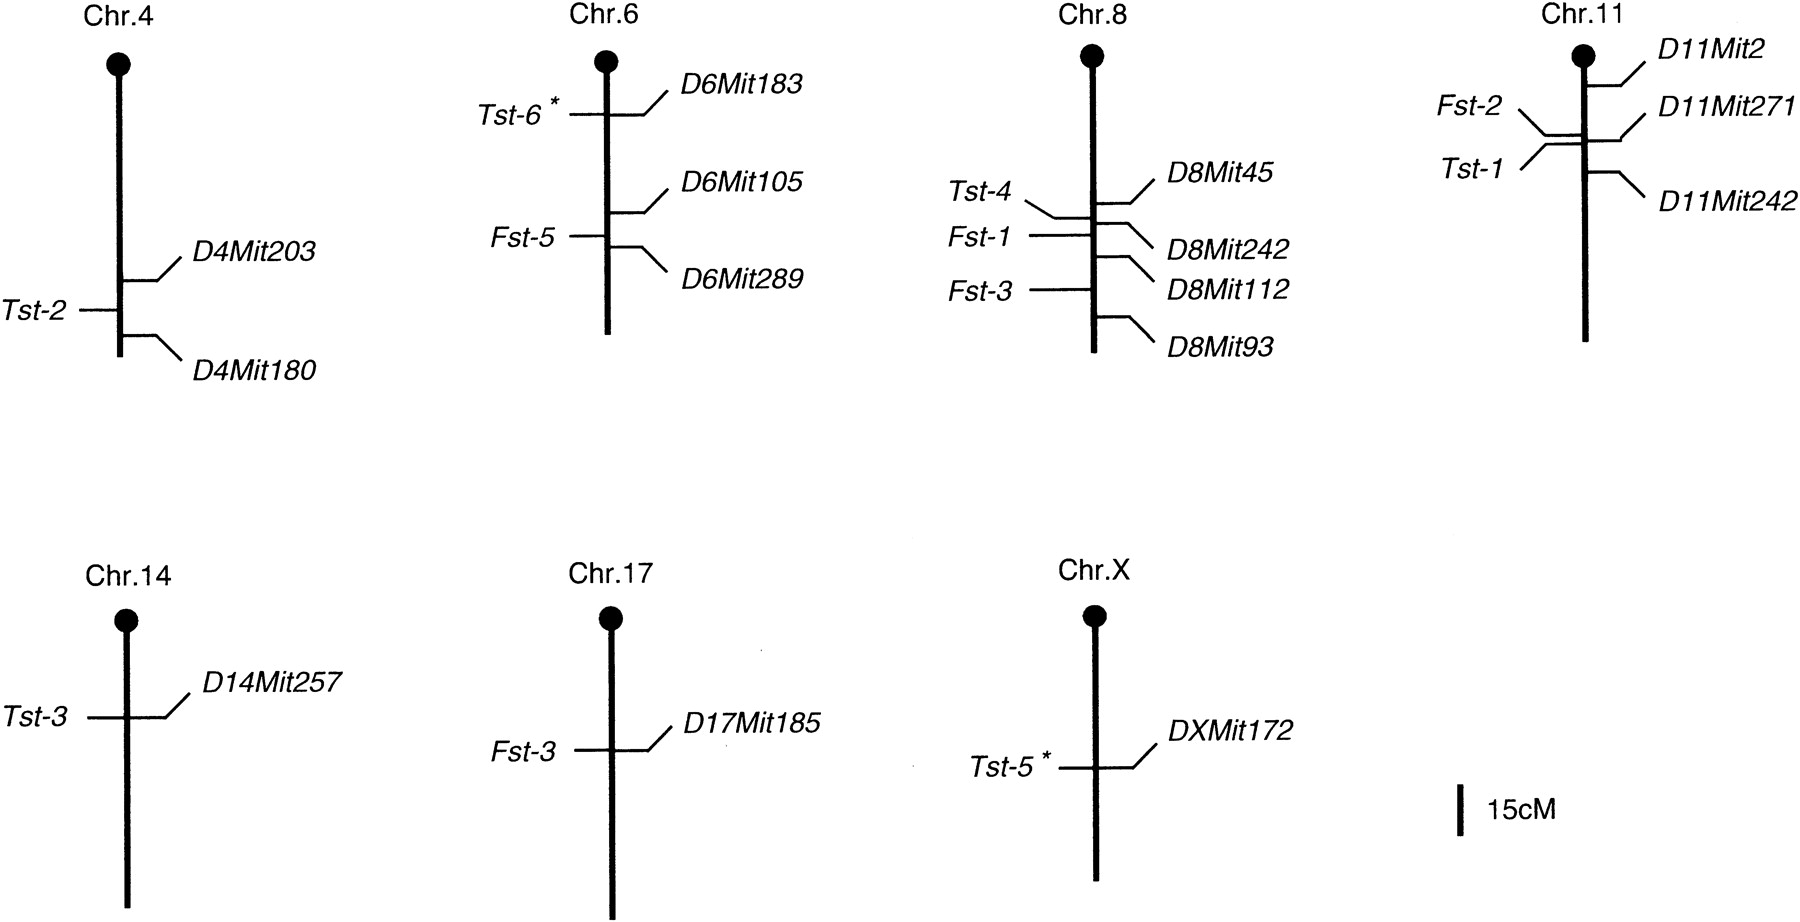
Figure 6.
Chromosomal locations of mapped FST- and TST-loci. Each vertical bar represents a mouse chromosome, with the centromere denoted by a black circle. Loci to the left of each chromosome are those identified in this study, and loci to the right are flanking microsatellite markers. Loci with asterisks are those identified only by the epistatic interaction analysis.


