
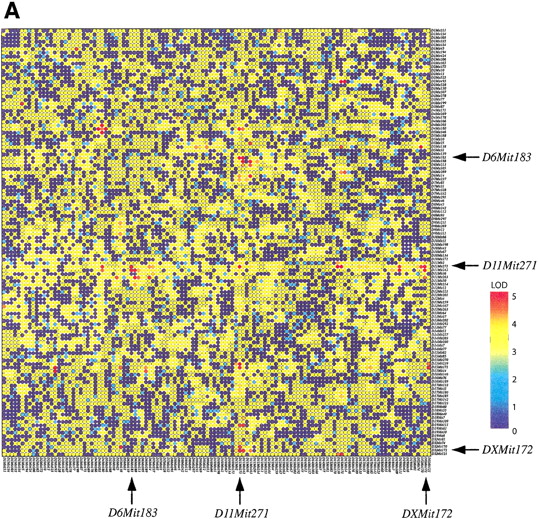
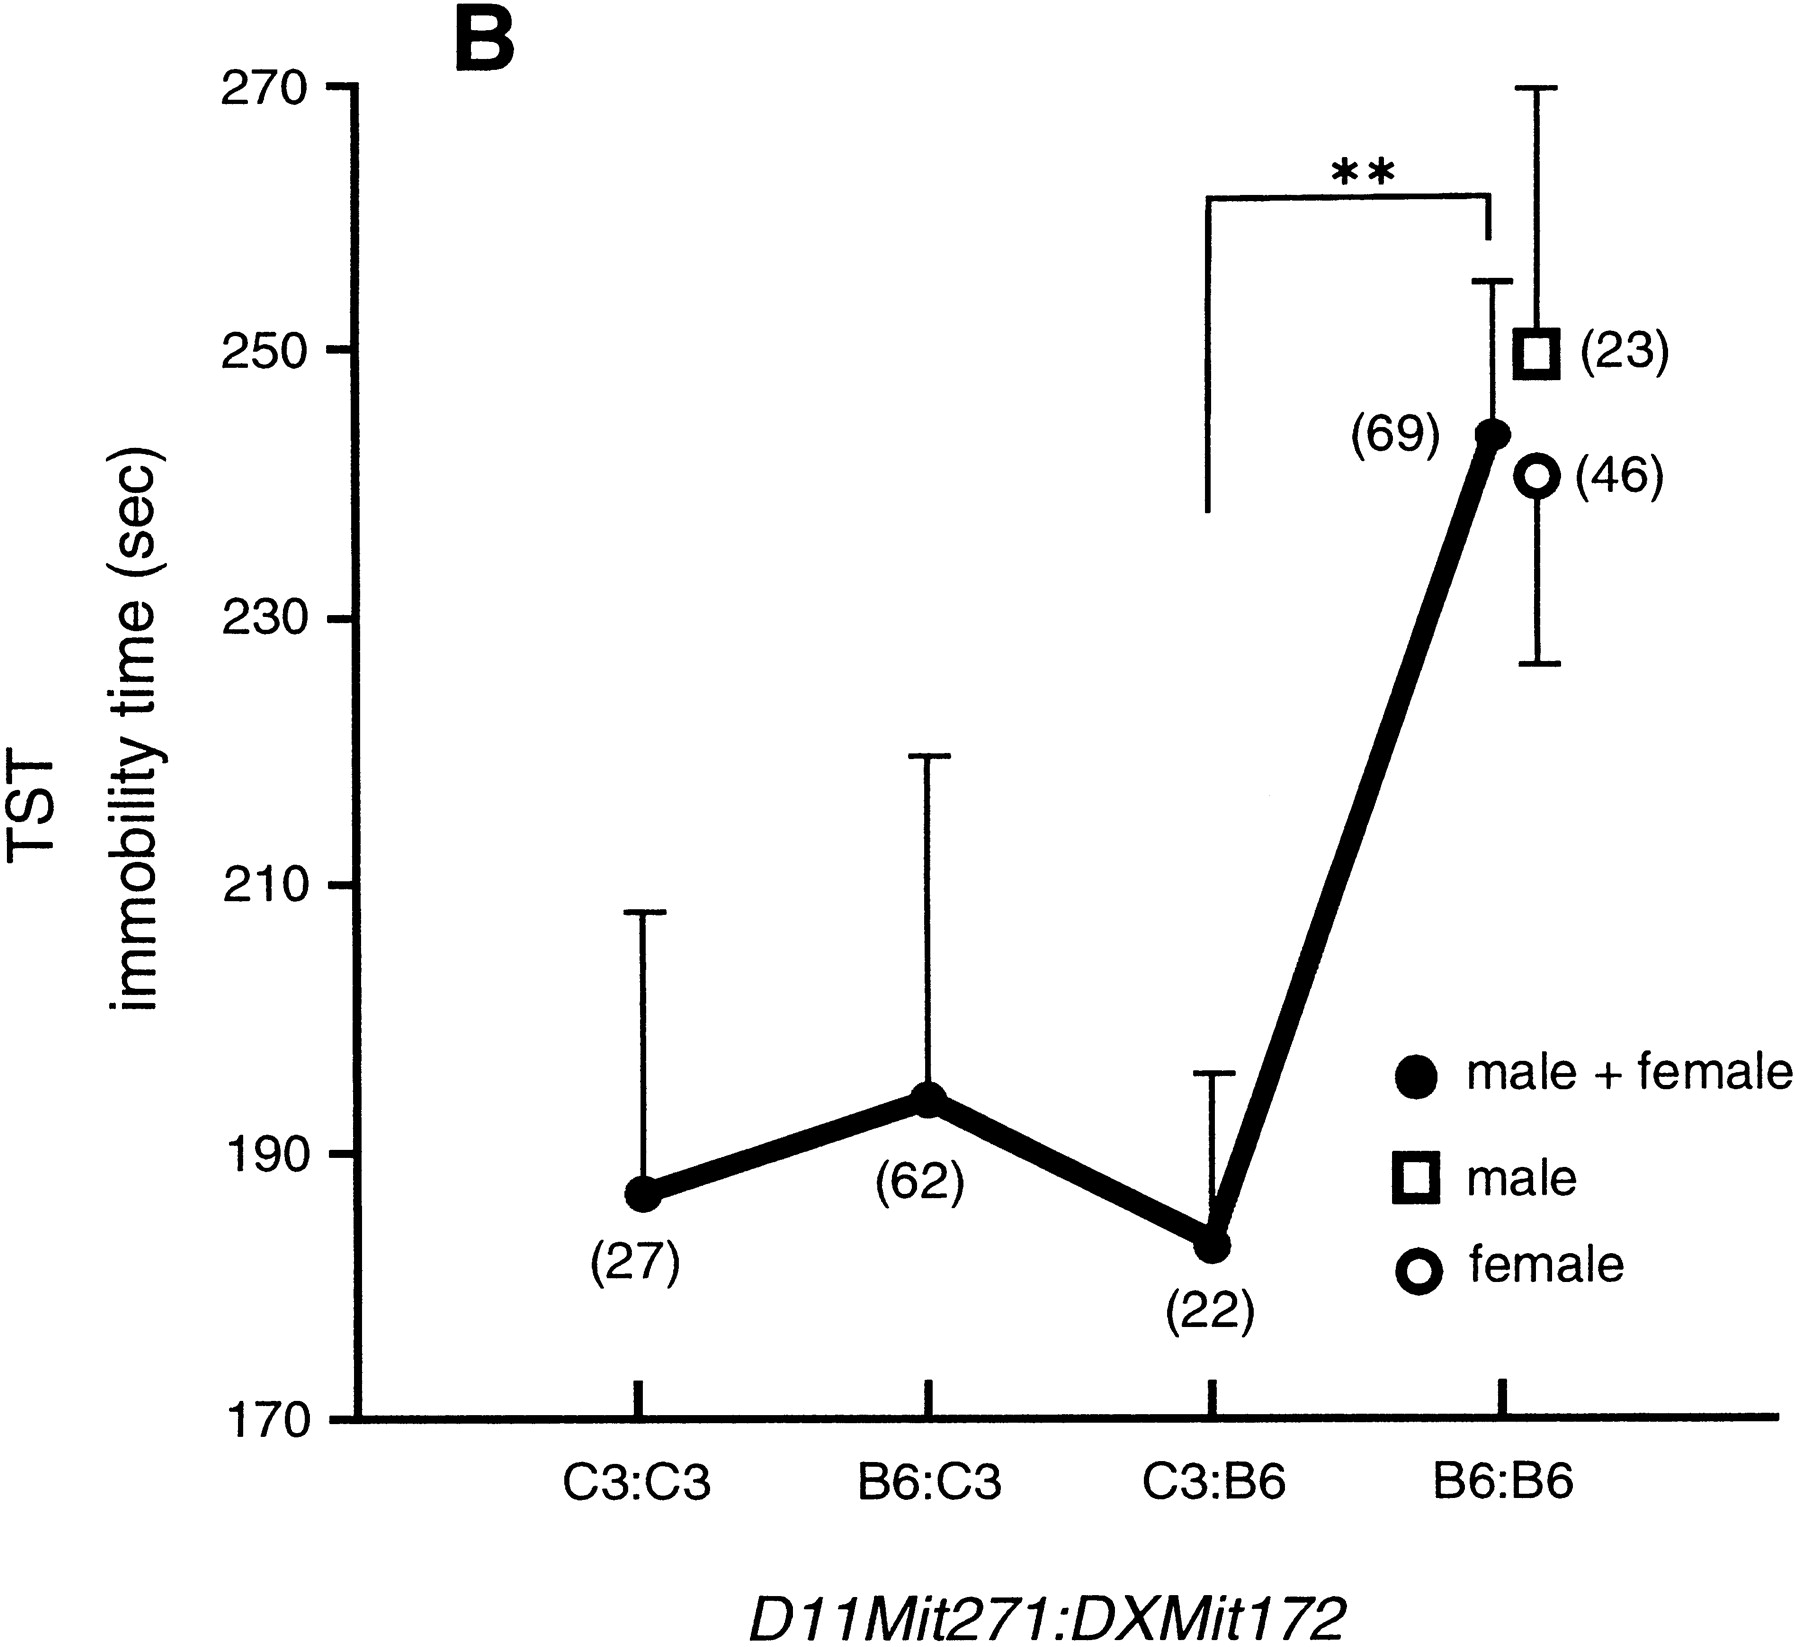
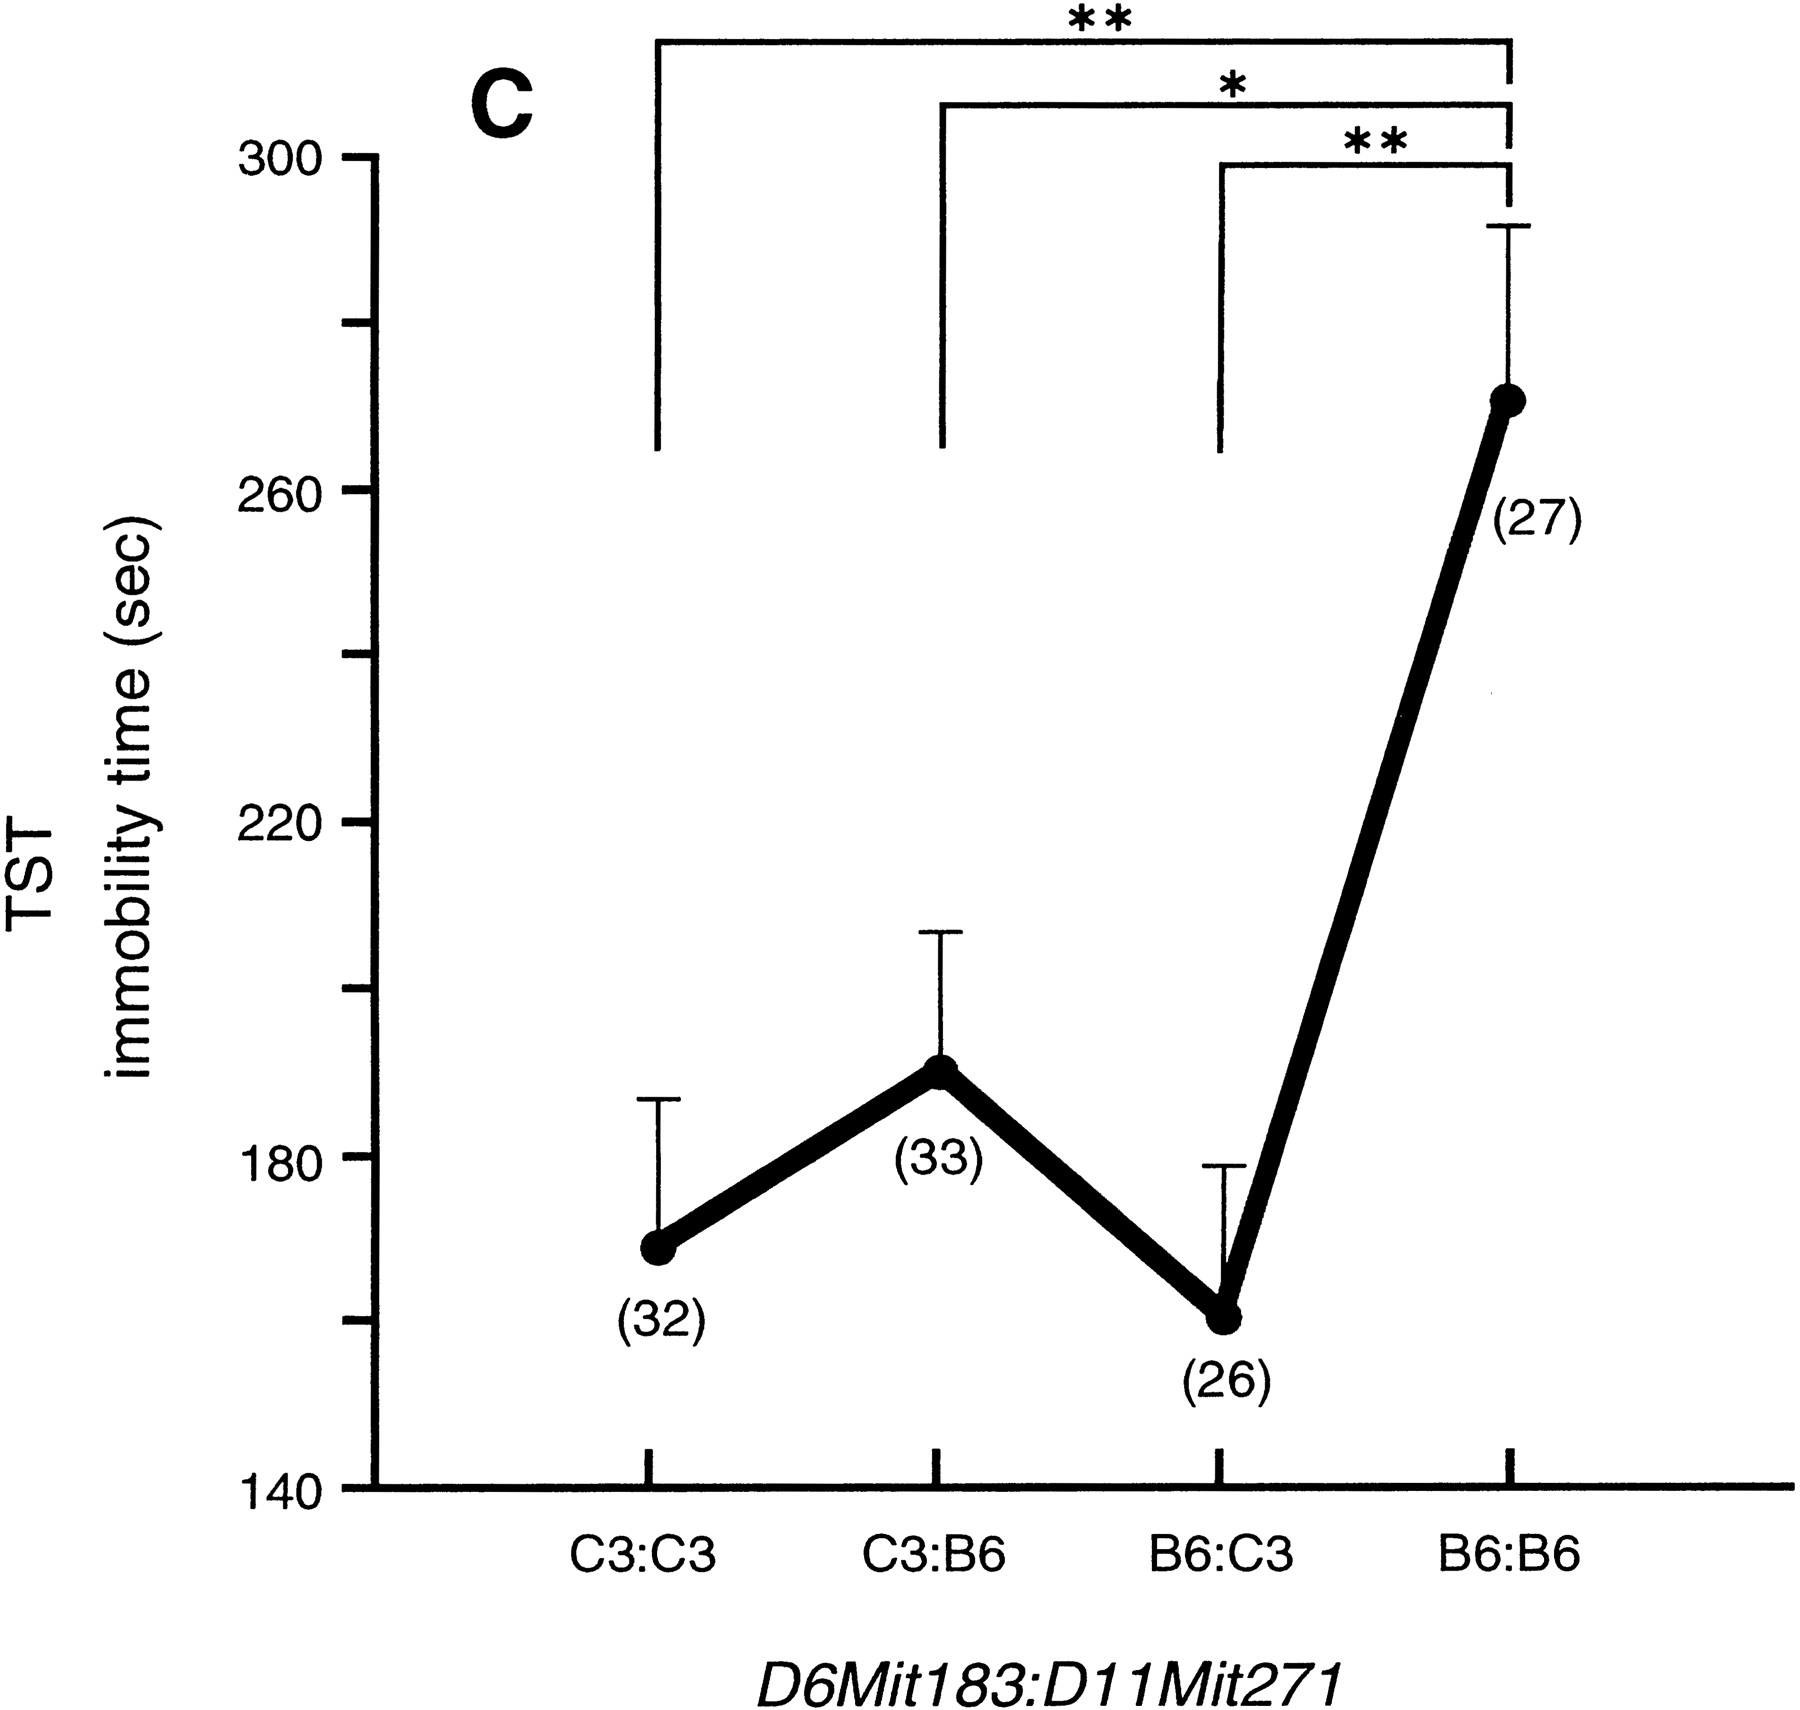
Genome-wide scan for tail suspension immobility. (A) Pairwise marker genome scan. The x and y axes of the figure show genetic markers that are homozygous for B6 alleles for all chromosomes. The axis starts with chromosome 1 (left of xaxis, top of y axis) and ends with chromosome X (right ofx axis, bottom of y axis). The color scale indicates lod scores. The markers for significant locus pairs (Table 3) are indicated by arrows. (B) Graph showing the genotype vs. the mean immobility times in the tail suspension test (TST) at a significantly interacting locus pair: the double B6 homozygote at the locus combination of D11Mit271:DXMit172 showed a lod score of 5.6 (significant at α = 0.01). Parentheses show the number of animals with indicated genotypes. ** P < 0.01 by Bonferroni/Dunn test. (C) The double B6 homozygotes at the locus pair of D6Mit183:D11Mit271 showed the lod score of 5.0 (significant at α = 0.05). * P < 0.05.


