
Abstract
Functional gene programs play a wide range of roles in health and disease by orchestrating transcriptional coregulation to govern cell identity. Understanding these intricate gene programs is essential for unraveling the complexities of biological systems; however, deciphering them remains a significant challenge. Recent advancements in single-cell RNA sequencing (scRNA-seq) and spatial transcriptomics (ST) technologies have empowered the comprehensive characterization of gene programs at both single-cell and spatial resolutions. Here, we present DeCEP, a computational framework designed to characterize context-specific gene programs using scRNA-seq and ST data. DeCEP leverages functional gene lists and directed graphs to construct functional networks underlying distinct cellular or spatial contexts. It then identifies context-dependent hub genes associated with specific gene programs based on network topology and assigns gene program activity to individual cells or spatial locations. Through evaluation on both simulated and real biological data sets, DeCEP demonstrates complementary strengths over existing methods by enabling more fine-grained characterization of gene programs within specific contexts, particularly those characterized by pronounced transcriptional heterogeneity. Furthermore, we showcase the ability of DeCEP in elucidating biological insights through case studies on normal liver tissue, Alzheimer's disease, and cancer.
A given biological process is often carried out by a series of coordinated gene programs, which are composed of functionally related genes that orchestrate transcriptional coregulation (Thomas 2017; Pope and Medzhitov 2018). These functional gene programs govern cell identity in health and disease (Kotliar et al. 2019). Their activation often varies across different cell types or states, particularly during development and disease (Cha and Lee 2020). For example, the gene programs of cancer cells within tumor tissue exhibit significant dysfunction compared with those of normal cells (Hanahan 2022). They also display significant plasticity during key processes such as tumor progression, metastasis, and immune escape (Suhail et al. 2019; Yuan et al. 2019). Recent advances in single-cell RNA sequencing (scRNA-seq) technologies have allowed the characterization of gene programs at an unprecedented resolution (Hwang et al. 2018; Kashima et al. 2020). Furthermore, the development of spatial transcriptomics (ST) technologies has enabled the depiction of spatial coregulation patterns of gene programs within a specific tissue (Rao et al. 2021; Moses and Pachter 2022; Walker et al. 2022). However, current computational methods for systematically deciphering gene programs underlying distinct cellular or spatial contexts using scRNA-seq and ST data remain limited.
The existing methods available for characterizing gene programs using scRNA-seq and ST data can be categorized into two groups: gene set scoring methods (Ji et al. 2020; Noureen et al. 2022) and matrix factorization–based methods (Kotliar et al. 2019). Gene set scoring methods rely on predefined gene sets to evaluate the activity of gene programs for each cell or spatial location. These methods are straightforward, are user-friendly, and offer clear interpretability (Aibar et al. 2017; Frost 2020). However, they assume uniform transcriptional coregulation of functional genes representing gene programs across all cells or entire tissue sections, calculating the scores in a consistent manner for each cell or spatial location. Therefore, these methods hinder the acquisition of deeper biological insights at a fine-grained level as they overlook the heterogeneity underlying distinct cellular or spatial contexts. Matrix factorization–based methods rely on a predefined number of factors (Fertig et al. 2010; Kotliar et al. 2019). However, the factors derived from unsupervised learning often lack sufficient interpretability for characterizing gene programs (Kotliar et al. 2019; Levitin et al. 2019). In contrast, supervised learning methods yield more interpretable factors, but they require multiple gene sets to represent these factors. Consequently, users need to consider both the number of gene sets included and their specific composition, that is, the genes contained within each gene set (Buettner et al. 2017; Wu et al. 2020). This complexity increases the sensitivity of these methods to input variability. Even slight perturbations in the selected gene sets can propagate through the factorization process, potentially introducing biases in the identification of gene programs. Moreover, neither method adequately incorporates location information into the characterization of gene programs, resulting in a lack of tailoring for the unique features of ST data. On the other hand, although current methods specifically developed for ST data, such as SpaGCN (Hu et al. 2021), BayesSpace (Zhao et al. 2021), and SpatialDE (Svensson et al. 2018), effectively incorporate spatial location information, they are designed to identify spatial domains or spatially variable genes. These approaches often lack a direct, function-centric perspective and do not provide interpretable characterizations of gene programs. Consequently, there is a clear need for a novel computational method that can accurately delineate context-specific gene programs using scRNA-seq and ST data at both the gene level and the cellular or spatial location level.
Gene networks are widely used in data-driven biological research (Barabási and Oltvai 2004), with WGCNA being a prominent example (Langfelder and Horvath 2008). Current gene network–based methods utilizing scRNA-seq or ST data mainly focus on identifying gene interactions and corresponding gene modules and hub genes within specific cell types or spatial domains (Mohammadi et al. 2019; Acharyya et al. 2022; Nouri et al. 2024). These methods typically perform in an unsupervised manner, dividing gene modules based on coexpression patterns of genes without incorporating predefined gene sets. The hub genes identified within these modules often require further functional annotation. Such annotations often exhibit complex functional overlaps, making them difficult to interpret clearly. Furthermore, these approaches do not fully consider various cellular or spatial contexts, such as continuous cell states or spatial gradients, limiting the diversity of data interpretation. As a result, we propose applying this network concept and adopting a new design to better characterize context-specific gene programs at the gene level. Specifically, we aim to construct networks centered around functional genes that represent gene programs using predefined gene sets and incorporating context-specific information. Directed graphs, particularly Bayesian networks, are extensively applied in transcriptomics data modeling (Friedman et al. 2000). This hierarchical approach is effective for analyzing potential regulatory relationships among molecules, facilitating the implementation of our overall strategy.
Building on this, we present DeCEP, a computational framework developed to decipher context-specific gene programs using scRNA-seq and ST data. DeCEP employs directed graphs (Koller and Friedman 2009) to characterize the heterogeneous transcriptional coregulation of gene programs within specific cellular and spatial contexts, such as cell types, cell states, disease conditions, and spatial locations. This approach enables DeCEP to integrate a priori functional gene lists and directed graphs to construct functional networks, which are then used to pinpoint context-dependent hub genes that drive gene programs. These genes identified by network topology may play a key role in governing cell identity. Consequently, DeCEP utilizes context-dependent hub genes to characterize the activity of gene programs for individual cells or spatial locations, defined as DeCEP scores or states.
DeCEP accounts for the heterogeneity of gene programs across different contexts, enabling interpretable and context-specific characterization of each program. This design allows DeCEP to complement existing approaches, offering distinct benefits to users conducting microscopic and in-depth analyses within specific contexts. We demonstrate its more refined ability to identify context-specific gene programs by analyzing both simulated and real biological data. Furthermore, we showcase its capability to uncover biological insights through applications involving data sets from normal liver tissue, Alzheimer's disease (AD), and cancer.
Results
Overview of DeCEP
We developed DeCEP, a computational framework to decipher context-specific gene programs using scRNA-seq and ST data (Fig. 1). For scRNA-seq data, DeCEP requires user-defined functional gene lists, a gene expression matrix, and cellular context labels (such as cell types, states, or disease conditions). The framework processes these inputs based on the context labels, which can be either discrete or continuous. For discrete labels, DeCEP filters the expression matrix by each label category, treating the resulting subsets as separate inputs for the next step. For continuous labels, DeCEP creates a new expression matrix using the time-lag method (Chaitankar et al. 2010). The processed data, enriched with context-specific information, are used to construct functional networks through structure learning of probabilistic graphical models (PGMs) (Tsamardinos et al. 2006). To improve the robustness of the functional networks, DeCEP iteratively constructs them via bootstrap resampling (Hesterberg 2011), identifies edges with sufficient strength, and generates the final networks. It then identifies context-dependent hub genes involved in gene programs by analyzing the network topology, assigning weights to the hub genes based on the number and strength of their associated edges. Finally, DeCEP calculates the DeCEP scores for each cell by weighting the expression values of these hub genes. To more precisely capture subtle similarities and differences between cells in specific contexts, DeCEP incorporates an imputation step to refine the gene expression profiles. DeCEP can further convert the scores into DeCEP states by finding natural breaks in the data using the Fisher–Jenks algorithm (Fig. 1A; North 2009).
The workflow of DeCEP. (A) DeCEP leverages pre-existing functional gene lists from various databases as prior knowledge to construct static or dynamic functional networks using directed graphs that are tailored to specific cellular contexts in single-cell RNA sequencing (scRNA-seq) data. Based on the topology of these functional networks, DeCEP identifies context-dependent hub genes, calculates DeCEP scores, and determines the states of individual cells. (B) DeCEP anchors cell states to spatial locations in spatial transcriptomics (ST) data. DeCEP constructs functional networks tailored to spatial contexts, focusing on regions of interest (ROIs) and their corresponding neighborhoods. DeCEP then identifies spatially dependent hub genes and assigns DeCEP scores.
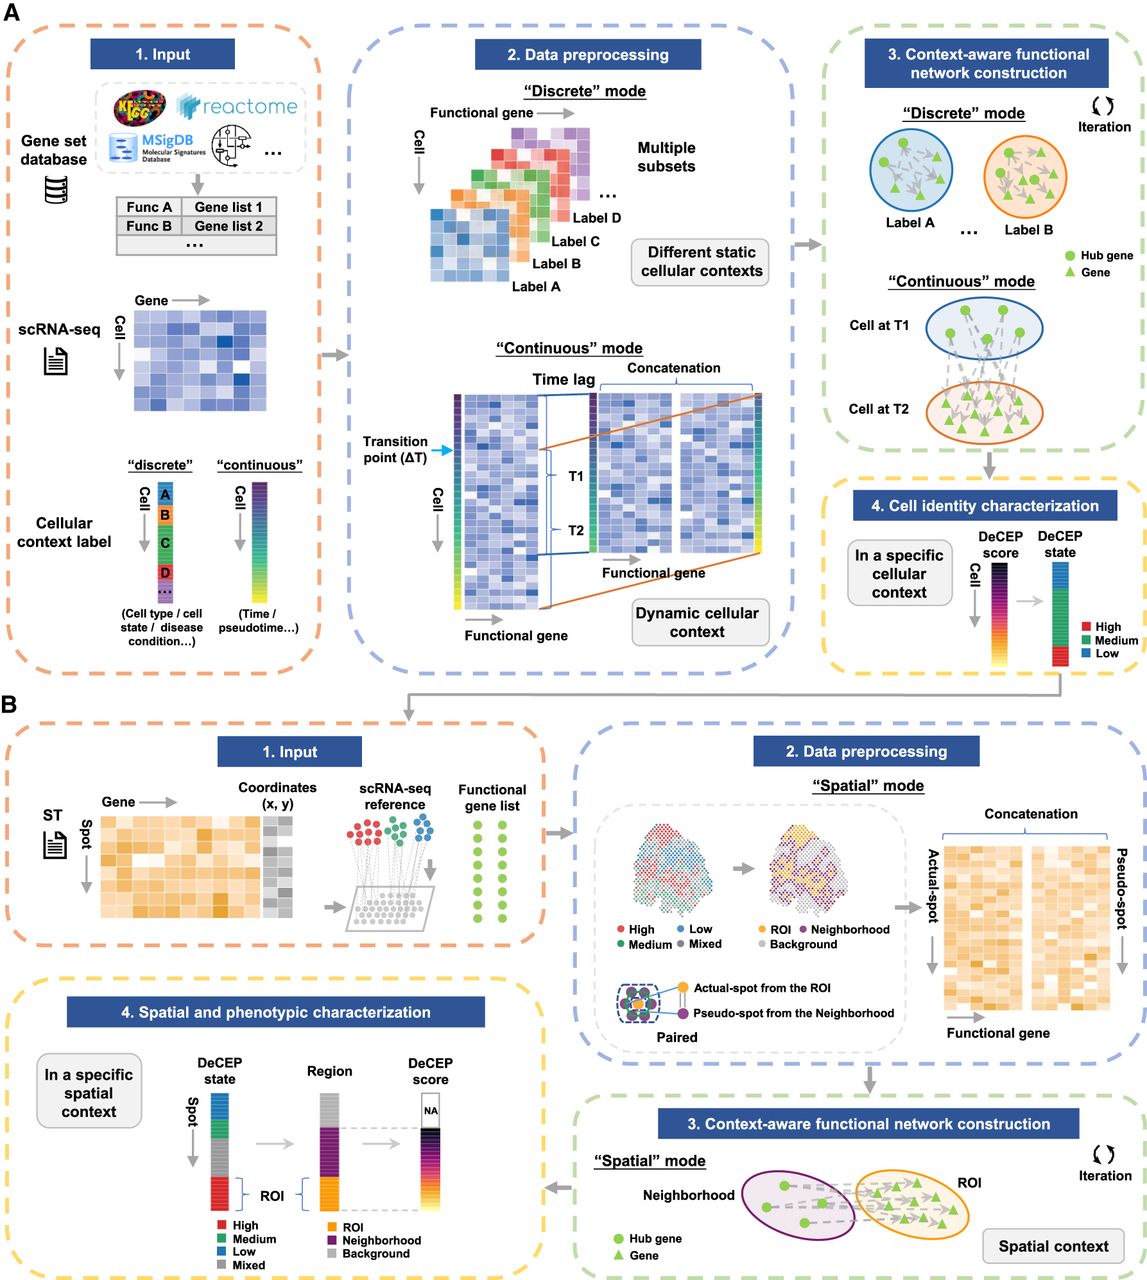
For ST data, DeCEP requires a spot-by-gene expression matrix and the corresponding spatial coordinates. It first determines the functional states of spatial locations using a reference scRNA-seq data set labeled with a clearly defined DeCEP state for each cell. Users can define the region of interest (ROI) based on these DeCEP states of spatial locations. DeCEP identifies neighboring spots for each spot within the ROI based on a user-specified distance threshold. If a spot in the ROI corresponds to multiple neighboring spots, they are synthesized into a single pseudospot. This process generates paired data that integrates both the ROI and its neighborhood, enriched with spatial context information. Similar to scRNA-seq data, DeCEP constructs context-specific functional networks utilizing PGMs, obtains the weights of context-dependent hub genes, and calculates the DeCEP scores for the ROI and the corresponding neighborhood (Fig. 1B).
Overall, DeCEP is a user-friendly computational framework for deciphering context-specific gene programs. Its function-centric approach is applicable to scRNA-seq and ST data not only for pinpointing context-dependent hub genes at the gene level but also for assigning scores or states of functional activity at the cell or spot level.
Benchmarking of DeCEP on simulated data
To evaluate the performance of DeCEP in characterizing context-specific gene programs at the cellular level, we generated multiple simulated data sets across various cellular contexts using Splatter (Zappia et al. 2017). Specifically, we conducted three independent simulations, each representing a single cell type, labeled as simulation tests 1 to 3. The degree of gene expression differences among cells increased from test 1 to test 3. Based on the unsupervised clustering results obtained using the standard Seurat v4 workflow (Hao et al. 2021), we assigned the cells from each of the three simulated data sets into four clusters, with each data set containing clusters labeled from zero to three (Supplemental Fig. S1). We applied consensus clustering (Wilkerson and Hayes 2010) to the highly variable genes in each data set to generate functional gene lists and performed DeCEP in “discrete” mode, with the simulated cell type in each of the three simulations treated as a specific cellular context. For comparison, we applied five existing methods, including Seurat (Hao et al. 2021), AUCell (Aibar et al. 2017), Vision (DeTomaso et al. 2019), VAM (Frost 2020), and UCell (Andreatta and Carmona 2021), to characterize gene programs using the same functional gene lists. We employed the supervised k-nearest neighbor (kNN) algorithm with 10-fold cross-validation to assess the ability of each method to identify cell clusters based on simulated gene program activity. Higher performance, as measured by the metrics, suggests that a method more precisely captures the biologically relevant signals that potentially reflect simulated gene program activity within specific cellular contexts, thereby facilitating the identification of similarities and differences among cells. Accordingly, we employed the performance evaluation of multiclass classification as a benchmarking approach. Here, it provides an indirect yet informative proxy to assess their potential in characterizing context-specific gene programs by quantifying the effectiveness of feature extraction in fine-grained data analysis. To validate the rationality of this evaluation strategy, we conducted additional analyses demonstrating the supervised separability of cell clusters and the presence of sufficient differential expression signals among cells introduced by the simulated gene programs (Supplemental Figs. S2, S3; Supplemental Note 1).
Our results showed that DeCEP achieved higher accuracy compared with the existing methods across the three simulated data sets (Fig. 2A). We also calculated the F1 score, sensitivity, and specificity for each cell cluster, revealing that DeCEP achieved higher values across these metrics (Fig. 2B; Supplemental Fig. S4A). Notably, the results also revealed increased variability in the sensitivity and specificity among the existing methods, with a trade-off observed when maintaining higher specificity was associated with reduced sensitivity (Supplemental Fig. S4A). Furthermore, we treated each cluster as the positive class and combined the remaining clusters as the negative class to plot receiver operating characteristic (ROC) curves and calculate the area under the ROC curve (AUC) for each cluster. DeCEP still achieved the highest AUC values for each cluster (Fig. 2C; Supplemental Fig. S4B). To eliminate the influence of predefined classification labels in the supervised approach, we also conducted an unsupervised evaluation for each method. Specifically, in each simulated data set, we performed clustering analysis based on simulated gene program activity scores and calculated the silhouette coefficient (SC) for individual cells to assess the ability of each method to effectively cluster and separate cells. The results revealed that DeCEP achieved the highest mean SC values across all data sets compared with the other methods (Fig. 2D; Supplemental Fig. S5). Additionally, we conducted ablation studies to evaluate the contribution of each component within the DeCEP framework (Supplemental Fig. S6; Supplemental Note 2).
Performance evaluation of DeCEP compared with existing methods on simulated data sets. (A) Accuracy of gene program characterization using DeCEP (discrete mode) and existing methods across three simulation tests. (B) F1 score of DeCEP (discrete mode) and existing methods for each cell cluster in simulation tests 1–3. (C) ROC curves and corresponding AUC values of DeCEP (discrete mode) for each cell cluster in simulation tests 1–3. (D) Mean values of the silhouette coefficients (SCs) obtained in simulated tests 1–3 using DeCEP (discrete mode) and existing methods. (E) Correlation strength between gene program activity scores and simulated cell steps in DeCEP (continuous mode) and existing methods.
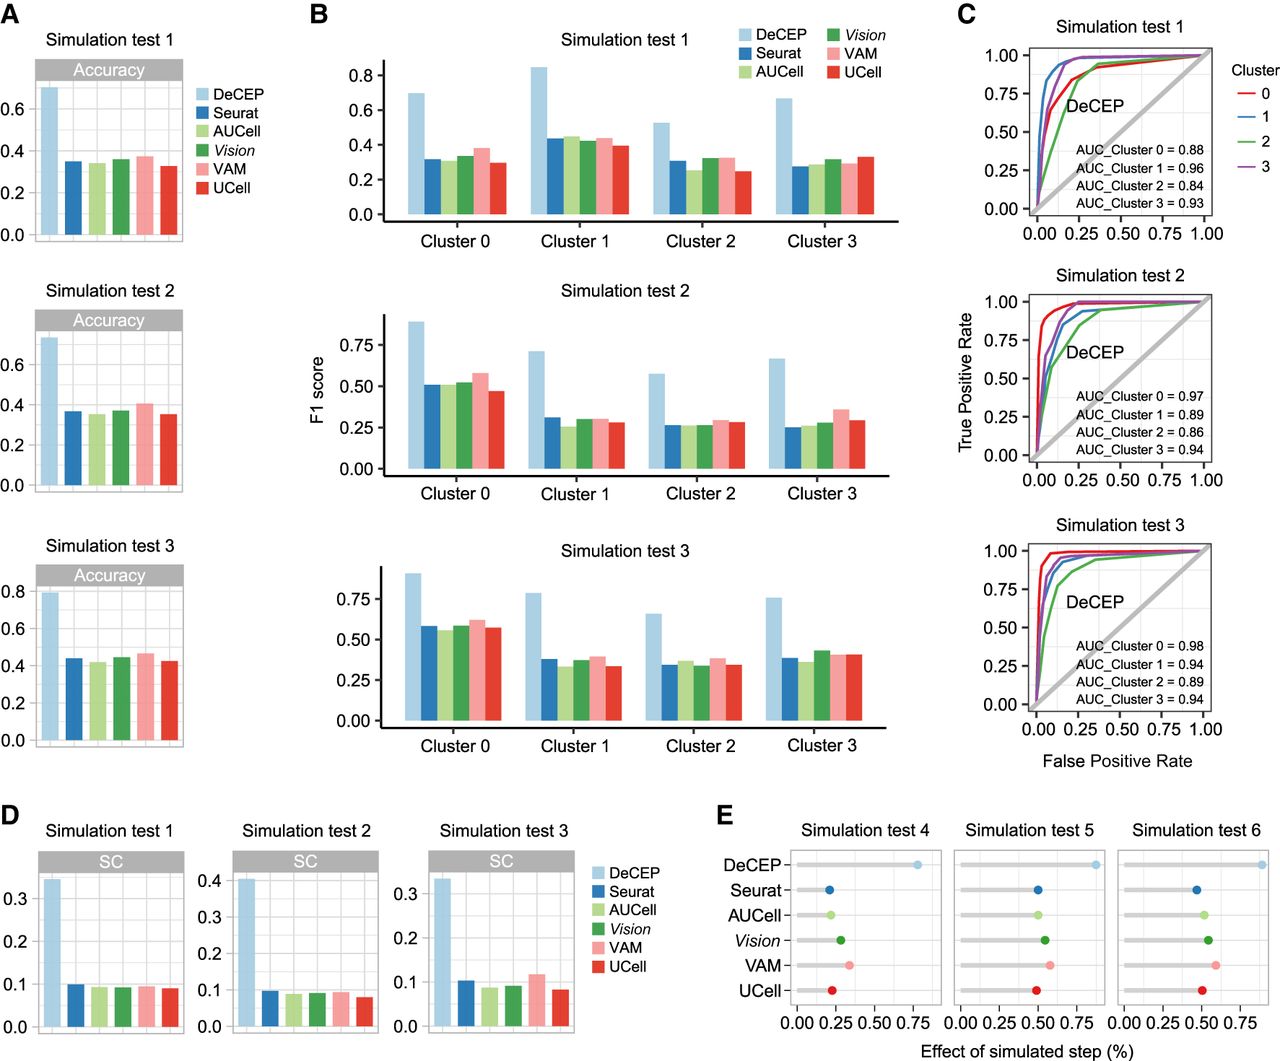
Next, we conducted three additional independent simulations, each containing 50 cell steps, referred to as simulation tests 4–6. As the number of simulation tests increased, the variability in gene expression across cells also gradually increased (Supplemental Fig. S7). We then clustered the simulated genes to generate functional gene lists and applied DeCEP in “continuous” mode, along with the other methods, to characterize gene program activity. To assess the correlation between gene program activity scores and simulated cell steps, we used generalized additive models (GAMs). We assumed that a higher goodness of fit would indicate that gene program changes are more precisely captured during cell state transitions. DeCEP demonstrated the strongest correlation between gene program activity scores and cell steps (Fig. 2E).
In summary, DeCEP demonstrated the ability to precisely capture biologically relevant signals within specific contexts. The effectiveness of its feature extraction, reflected in accurate and robust performance in both “discrete” and “continuous” data scenarios, indirectly suggests its potential for fine-grained characterization of context-specific gene programs at the cellular level.
DeCEP uncovers the nonuniform distribution of liver detoxification function along the hepatic lobule axis
Although DeCEP performs well on simulated data, it is important to assess whether it can handle real biological data, which are much more complex and diverse. We proceeded to evaluate the performance of DeCEP using scRNA-seq and ST data from adult mouse livers (Guilliams et al. 2022; Liang et al. 2022). The hepatic lobule serves as the anatomical and functional unit of the liver, exhibiting a spatially hierarchical microenvironment from portal triads (PTs) to the central vein (CV), which leads to heterogeneous expression of liver functions along the hepatic lobule axis, termed zonation (Manco and Itzkovitz 2021). Detoxification is one of the most important liver functions (Ben-Moshe and Itzkovitz 2019; Manco and Itzkovitz 2021). Because the expression levels of a series of genes involved in liver detoxification, such as Cyp1a2 and Cyp2e1, exhibit significant variation along the hepatic portal–central axis (Ben-Moshe and Itzkovitz 2019), we assumed that the DeCEP scores reflecting detoxification would have a distinct gradient along this axis.
We first applied DeCEP to a publicly available scRNA-seq data set from adult mouse livers (Liang et al. 2022), focusing on hepatocytes. These cells were assigned to periportal, mid-lobule, and pericentral regions (Supplemental Fig. S8; Supplemental Note 3). We evaluated the distribution of liver detoxification by analyzing gene programs associated with drug metabolism–cytochrome P450, metabolism of xenobiotics by cytochrome, glutathione metabolism, and glutamate and glutamine metabolism. This analysis was performed using DeCEP in “discrete” mode, with hepatocytes as the cellular context. The DeCEP scores for hepatocytes across these four gene programs exhibited a gradient increase from the periportal to the pericentral region (Fig. 3A). Using the hepatocyte-specific functional networks constructed by DeCEP, we identified several hub genes that play central roles in regulating these gene programs. Notably, Cyp2e1 emerged as a critical gene involved in both drug metabolism–cytochrome P450 and metabolism of xenobiotics by cytochrome (Fig. 3B). Network analysis revealed a strong interaction between Cyp1a2 and Cyp2e1, with the edge direction suggesting that Cyp1a2 potentially promotes the activation of Cyp2e1 (Supplemental Fig. S9).
DeCEP reveals a heterogeneous distribution of liver detoxification function along the hepatic lobular axis. (A) Bar plots of the DeCEP scores for liver detoxification–related gene programs across the periportal, mid-lobule, and pericentral regions. The DeCEP scores were compared among hepatocytes in the three different liver regions. The Kruskal–Wallis test: (***) P < 0.001. (B) Weights of the hub genes in the gene programs. Some of the hub genes were defined as core genes that were identified more than once in the four gene programs. (C) Distribution of the DeCEP scores for the gene programs as the pseudospace changes from portal triads (PTs) to the central vein (CV). (D) Strength of associations between the DeCEP scores and the pseudospace factor. (E) Comparison of the proportions of detoxification-related gene programs with distinct DeCEP states in different hepatic lobule regions.
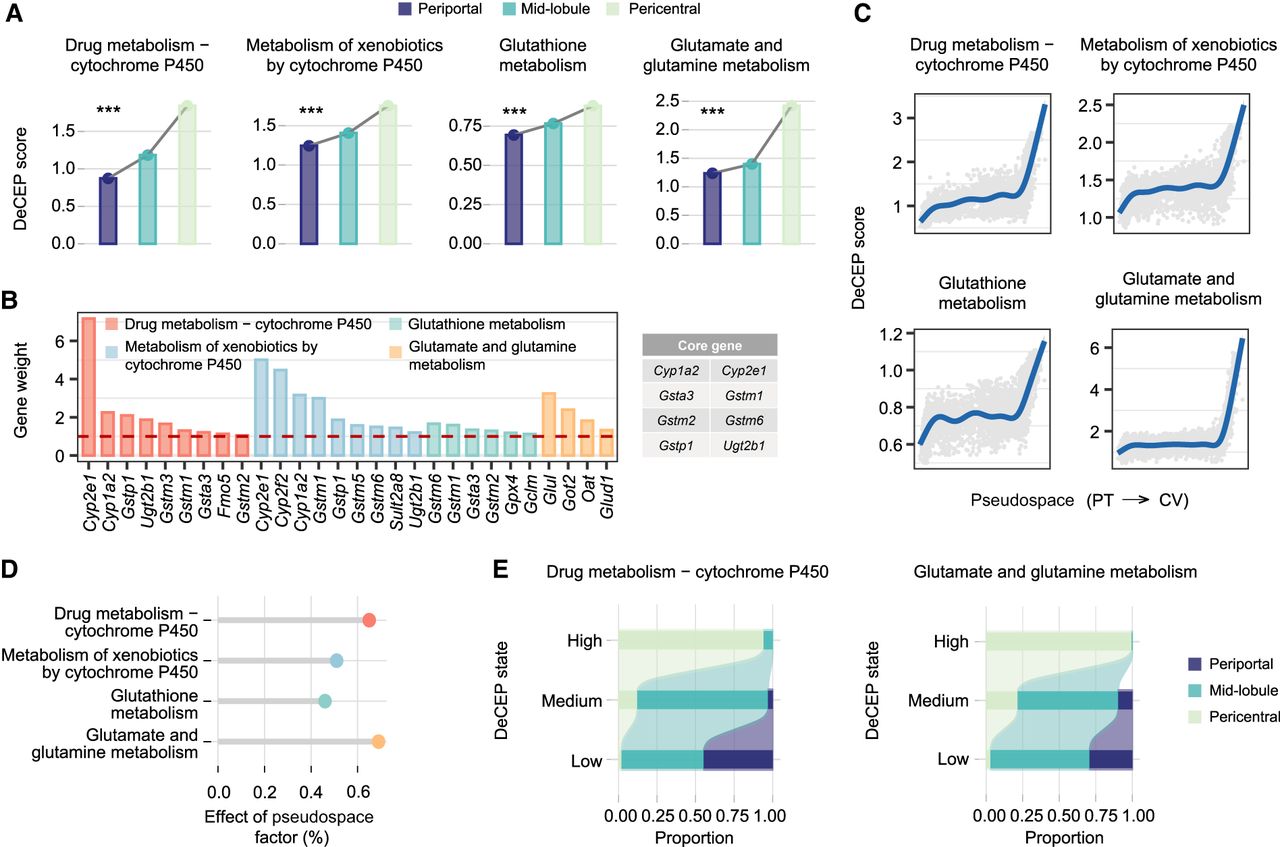
To investigate the dynamic changes in the DeCEP scores along the hepatic lobule axis, we sequentially ordered hepatocytes through pseudospatial analysis and fitted the DeCEP scores of the four gene programs along the lobule axis. This analysis revealed a progressive increase in the DeCEP scores as hepatocytes approached the CV (Fig. 3C; Supplemental Fig. S10A). Among these gene programs, the DeCEP scores for drug metabolism–cytochrome P450 and glutamate and glutamine metabolism exhibited the strongest spatial dependence, with effects exceeding 0.6 (Fig. 3D). By discretizing the DeCEP scores for these two gene programs, we observed that their DeCEP states significantly overlapped with zonation of the hepatic lobule (Fig. 3E). Notably, cells with high DeCEP states tended to be in the pericentral region, whereas cells with medium and low DeCEP states were orderly distributed toward the periportal region (Fig. 3E; Supplemental Fig. S10B). These results collectively demonstrate that DeCEP effectively characterizes key hepatocyte-specific gene programs using the scRNA-seq data.
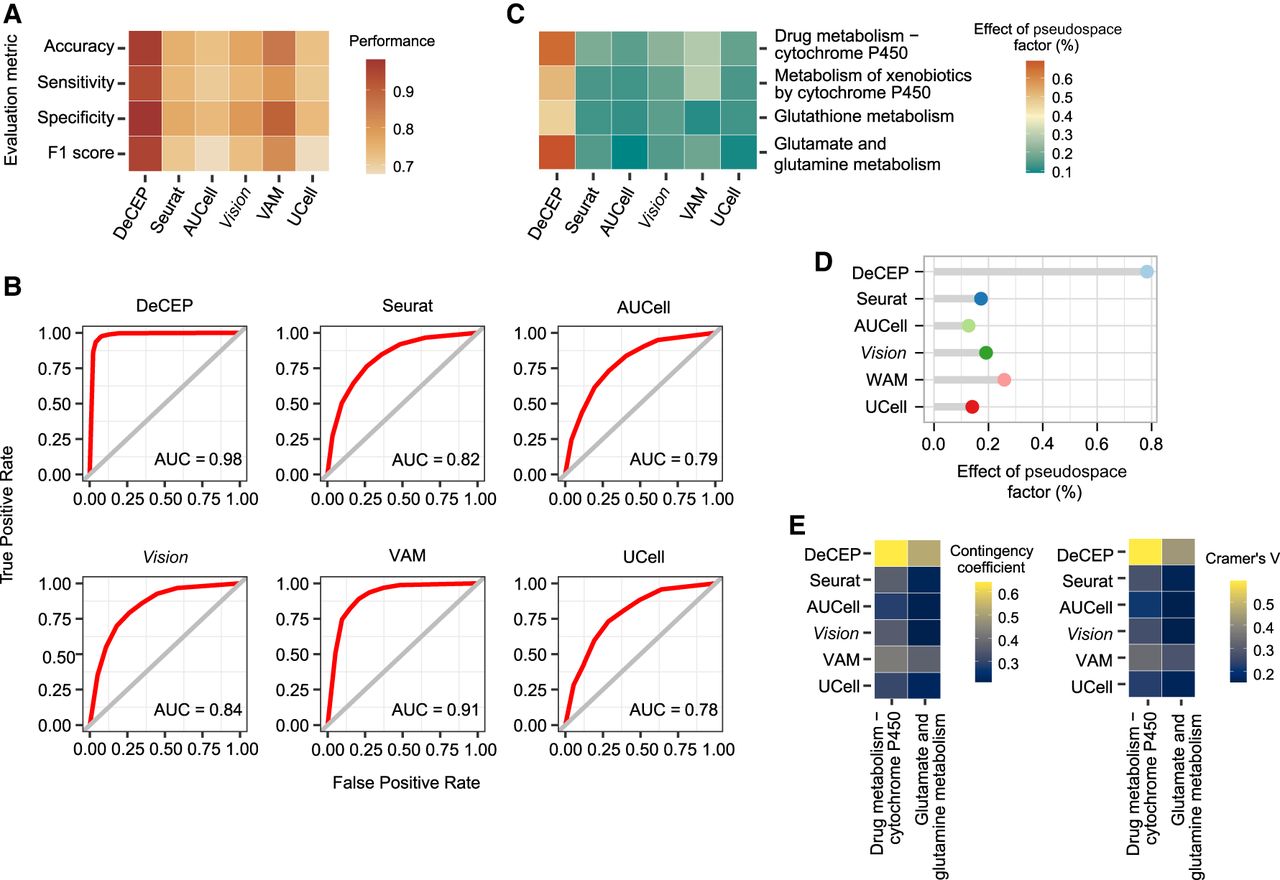
Given the significant differences in liver detoxification function between the periportal and pericentral regions, we employed the kNN algorithm to evaluate the performance of DeCEP by distinguishing periportal and pericentral hepatocytes using the four gene programs. Compared with existing methods, DeCEP showed higher values in several key metrics, including accuracy, sensitivity, specificity, F1 score, and AUC (Fig. 4A,B). We also conducted ablation studies to confirm the contribution of each component within the DeCEP framework in the context of real biological data (Supplemental Fig. S11; Supplemental Note 4). To assess DeCEP's ability to capture changes in gene programs along the hepatic lobule axis, we used GAMs to analyze the correlation between the activity scores of the four gene programs and the pseudospace. Our findings revealed that the correlation strength derived from existing methods was weaker than that from DeCEP (Fig. 4C). Additionally, DeCEP exhibited higher variability in the overall activity of the four detoxification-related gene programs along the hepatic lobule axis compared with existing methods (Fig. 4D). Here, we specifically focused on drug metabolism–cytochrome P450 and glutamate metabolism, as they showed strong spatial dependence (effect >0.6). Applying the same strategy as DeCEP to existing methods, we discretized activity scores to characterize the cell states of these two gene programs. Unlike the distinct regional enrichment observed with DeCEP states, the cell states generated by other methods were scattered across the UMAP plot and lacked biological significance (Supplemental Fig. S12). Our statistical analysis of the associations between discrete cell states and lobule regions indicated that the cell states provided by DeCEP were the most regionally relevant (Fig. 4E). Overall, these results highlighted the effectiveness of DeCEP and its complementary value to existing methods for fine-grained analysis of real biological data from adult mouse liver scRNA-seq.
DeCEP achieves robust performance on the normal liver tissue data set. (A) Accuracy, sensitivity, specificity, and F1 score of detoxification-related gene program characterization using DeCEP and existing methods. (B) ROC curves and corresponding AUC values of DeCEP and existing methods in the adult mouse liver scRNA-seq data. (C) Correlations between individual gene program activity scores and the pseudospace factor in DeCEP and existing methods. (D) Strength of associations between overall gene program activity of detoxification-related gene programs and the pseudospace factor in DeCEP and existing methods. (E) Associations between gene program activity states and hepatic lobule regions in DeCEP and existing methods. The contingency coefficient and Cramer's V are shown.
On the other hand, to further enhance the comprehensiveness of our comparison, we also compared DeCEP with CoGAPS, a matrix factorization–based method (Fertig et al. 2010), in characterizing liver detoxification function. Although CoGAPS is not specifically designed for the direct quantification of specific gene programs, this comparison underscores the unique advantages of DeCEP in enabling the direct and independent characterization of functional gene programs at both the gene and cellular levels. Specifically, we applied CoGAPS to factorize the expression matrix of hepatocytes into eight distinct patterns. Enrichment analysis indicated that pattern 7 was associated with liver detoxification. However, at the cellular level, the activity levels of pattern 7 did not exhibit a significant gradient distribution along the hepatic lobule axis. This may be attributed to the fact that pattern 7 also exhibited significant enrichment for a range of other biological functions, resulting in entangled signals that obscure the specific contribution of liver detoxification and likely account for the absence of a clear spatial gradient. At the gene level, although the marker genes for pattern 7 include several detoxification-related genes, their significance is partially diminished by the presence of complex signals, which renders them less prominent within the overall pattern (see Supplemental Fig. S13; Supplemental Note 5).
We further evaluated the ability of DeCEP to characterize gene programs in an ST data set from an adult mouse liver tissue section (Fig. 5A; Guilliams et al. 2022). First, based on the clustering results of the spots and the expression patterns of the marker genes, we assigned the spots to the periportal, mid-lobule, and pericentral regions (Fig. 5B; Supplemental Fig. S14A–D). The expression levels of zonation-related marker genes exhibited distinct region-specific patterns (Supplemental Fig. S14E). We applied DeCEP to identify the DeCEP states of the spots corresponding to the two most spatially dependent gene programs mentioned earlier. Our analysis revealed that the DeCEP states were consistent with the changes observed across different regions of the hepatic lobule (Fig. 5C). Quantifying the distribution of lobule regions across different DeCEP states showed that spots with high DeCEP states were mainly located in the pericentral region, whereas spots with low DeCEP states were predominantly located in the periportal region (Fig. 5D). Additionally, we assessed the distribution of the DeCEP states of spots across different lobule regions, showing that the proportion of the DeCEP states related to glutamate and glutamine metabolism exhibited more pronounced discrepancies in different lobule regions (Fig. 5E). This signifies that the gene program activity associated with glutamate and glutamine metabolism has greater spatial dependency, consistent with the outcomes derived from single-cell analysis (Fig. 3D).
DeCEP depicts the spatial dependence of detoxification-related gene programs in mouse livers. (A) Hematoxylin and eosin–stained tissue section of an adult mouse liver. (B) Distribution of liver regions in the liver tissue section. (C) Distribution of DeCEP states for the two most spatially dependent gene programs in the liver tissue section. (D,E) Proportions of overlap between different DeCEP states and three liver regions. (F) Associations between hepatic lobule regions and gene program activity states identified by DeCEP and other existing methods. The Kendall's tau-b correlation coefficient and the conditional probability of the high DeCEP state given the pericentral region are shown. (G) Comparison of the proportions of hepatic lobule regions across different gene program activity states identified by DeCEP and existing methods. The red dashed box highlights an abnormally high proportion of the low spot states associated with glutamate and glutamine metabolism identified by existing methods in the pericentral region.
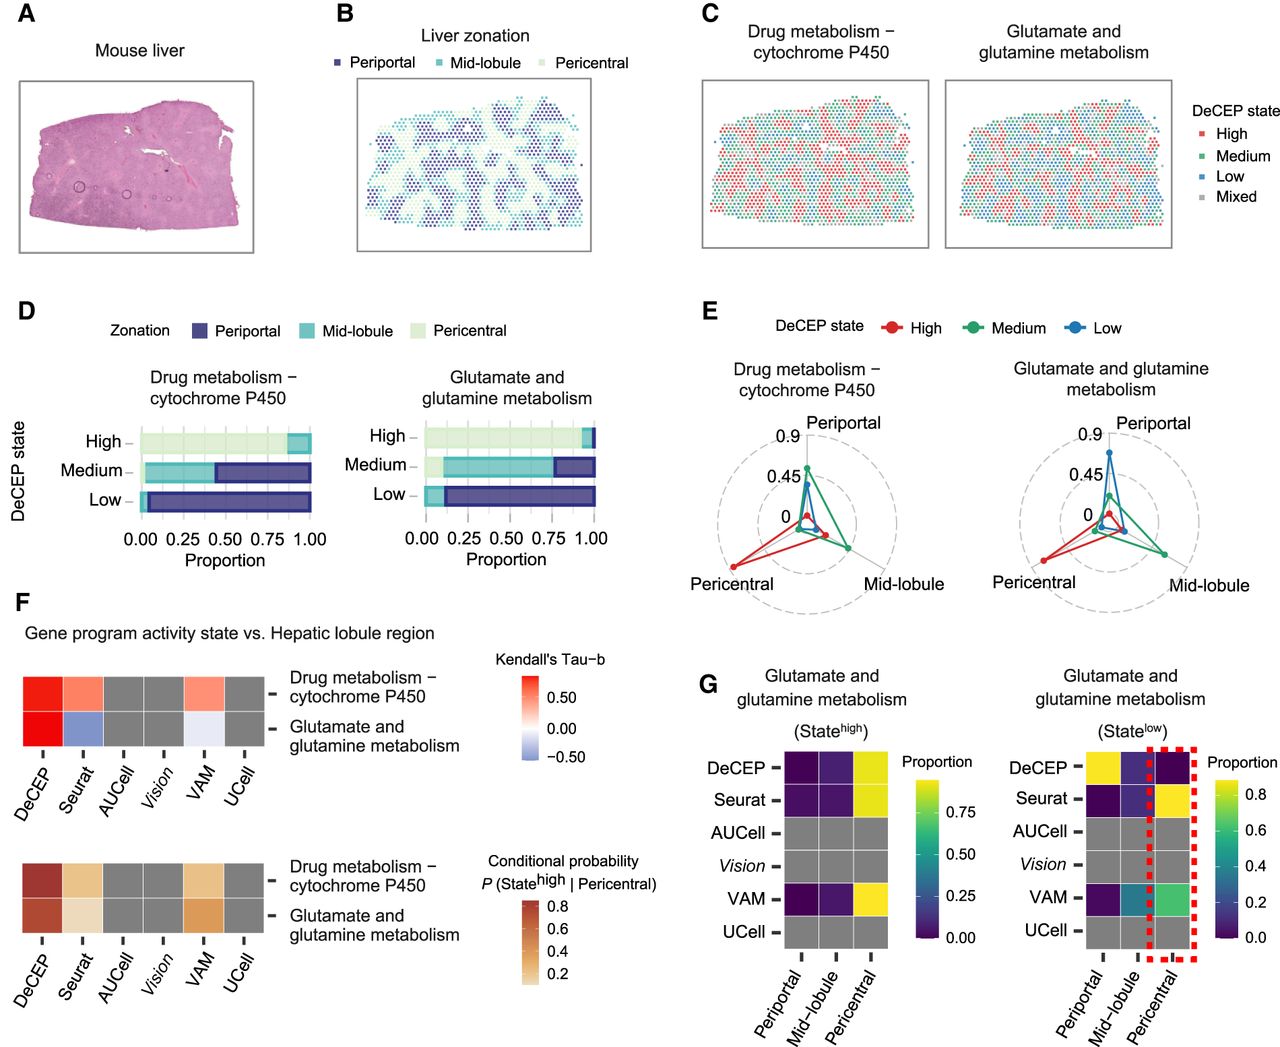
To evaluate the performance of DeCEP on adult mouse liver ST data, we simultaneously applied existing methods to identify the spot states of the same two gene programs. However, AUCell, Vision, and UCell were unable to effectively identify the spot states or produce meaningful results (Supplemental Fig. S15). Although Seurat and VAM generated outputs, their ability to distinguish spot states was limited, as the identified states did not align with the spatial organization of the lobule regions (Supplemental Fig. S15). Notably, the DeCEP states demonstrated the highest correlation with different lobule regions compared with existing methods (Fig. 5F). We further analyzed the distribution of lobule regions across different spot states and found that the low spot states associated with glutamate and glutamine metabolism, identified by Seurat and VAM, had an unusually high proportion in the pericentral region (Fig. 5G), which contradicts the known physiology of the liver (Ben-Moshe and Itzkovitz 2019; Manco and Itzkovitz 2021). This further confirmed the added value of DeCEP in analyzing adult mouse liver ST data. Specifically, DeCEP effectively identifies the activity states of gene programs in specific locations within the liver tissue section compared with existing methods. This capability is essential for identifying specific spatial contexts associated with functional phenotypes and for directly characterizing gene programs within these contexts.
DeCEP elucidates the neuroinflammatory role of astrocytes in AD
Neuroinflammation (NI) is a typical feature of AD and is involved in its pathogenesis and progression (Calsolaro and Edison 2016). Astrocytes are a subtype of glial cells that act as essential regulators of NI, which may have an impact on neurons (Colombo and Farina 2016). We applied DeCEP to a single-nucleus RNA sequencing (snRNA-seq) data set from the hippocampus of AD and wild-type (WT) mice, focusing on astrocytes. We distinguished between two conditions of these cells, which represented high and low levels of NI, termed NI-high and NI-low, respectively (Supplemental Fig. S16; Supplemental Note 6). We treated the two conditions as distinct cellular contexts and applied DeCEP in its “discrete” mode to astrocytes within each context, aiming to decipher context-specific neuroinflammatory gene programs. The DeCEP scores for cellular senescence, chemokine signaling, HIF1A signaling, IL6 signaling, and fatty acid degradation were employed to characterize astrocyte senescence and potential regulation of NI. The DeCEP scores for most of these gene programs were significantly increased in NI-high astrocytes except for fatty acid degradation, which was significantly decreased (Fig. 6A). The elevated levels of chemokine, HIF1A, and IL6 signaling suggest that neuroinflammatory gene programs were abnormally activated in NI-high astrocytes. A study showed that loss of astrocyte mitochondrial fatty acid degradation induces NI (Mi et al. 2023), which was consistent with our results. We also applied other existing methods to quantify the activity scores of these gene programs. The results indicated that these methods were less effective than DeCEP in distinguishing gene program activity between NI-high and NI-low conditions (Fig. 6B; Supplemental Fig. S17), suggesting the potential value of incorporating distinct cellular contexts into gene program characterization.
DeCEP identifies gene programs in astrocytes under different inflammatory conditions. (A) Density plots of known neuroinflammatory gene programs under NI-high and NI-low conditions. The DeCEP scores of NI-high and NI-low astrocytes were compared. The one-sided Wilcoxon rank-sum test: (***) P < 0.001, (**) P < 0.01. (B) Associations between NI conditions and gene program activity scores calculated by DeCEP and other existing methods. The Kendall's tau-b correlation coefficient is shown. (C) Correlation coefficients (r) of the DeCEP scores for cellular senescence versus other neuroinflammatory gene programs. Spearman's rank correlation. (D) Comparison of correlation coefficients (r) between cellular senescence and neuroinflammatory gene program activity scores, as calculated by DeCEP and existing methods. Spearman's rank correlation. (E) Weights of several hub genes associated with these neuroinflammatory gene programs under the NI-high condition. (F) The NI-high-specific functional network of chemokine signaling. The genes highlighted in red are key hub genes.
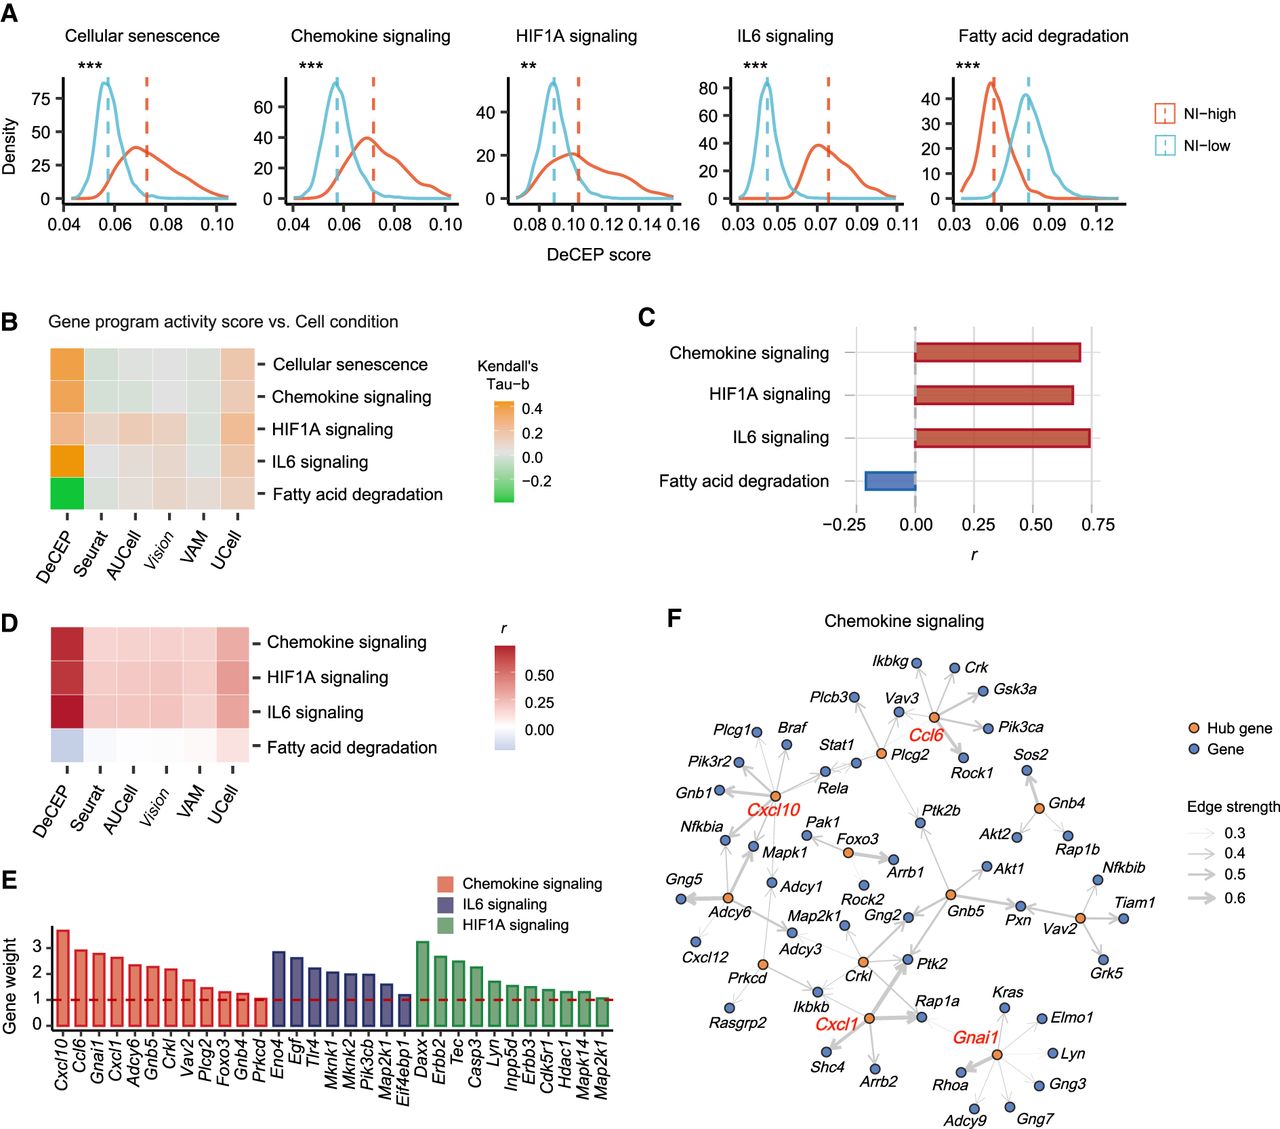
The DeCEP scores for chemokine, HIF1A, and IL6 signaling exhibited significant positive correlations with the DeCEP scores of cellular senescence (Fig. 6C). In contrast, the correlations between the activity scores of neuroinflammatory gene programs and those of cellular senescence, as measured by existing methods, were notably weak (Fig. 6D). This observation further highlighted the potential of DeCEP in capturing biologically relevant associations through fine-grained characterization of context-specific gene programs. Additionally, using the functional networks in NI-low astrocytes as controls, we obtained the NI-high functional networks related to the three gene programs and identified many hub genes (Fig. 6E,F; Supplemental Fig. S18). With respect to chemokine signaling, we identified the most critical neuroinflammatory genes, Cxcl10, Ccl6, Gnai1, and Cxcl1 (gene weight >2.5) (Fig. 6F). With respect to HIF1A signaling, we successfully elucidated the regulation of Hif1a by Tlr4 (Supplemental Fig. S18). Additionally, we performed corresponding ST analysis using AD and WT mouse brain tissue sections (Supplemental Figs. S19–S21; Supplemental Note 7; Choi et al. 2023).
DeCEP reveals the crucial role of cancer cell plasticity during tumor progression
Tumor progression is closely related to the phenotypic plasticity of cancer cells. This phenomenon results in a significant increase in tumor invasiveness, eventually leading to tumor metastasis (Gupta et al. 2019). To dissect this process, we applied DeCEP to an scRNA-seq data set of human cutaneous squamous cell carcinoma (cSCC) (Ji et al. 2020), focusing on tumor keratinocytes (Supplemental Fig. 22; Supplemental Note 8). Among the five identified cell clusters (clusters 0–4), cluster 4 exhibited characteristics of the epithelial–mesenchymal transition (EMT) phenotype. Next, we performed pseudotime analysis to determine the pseudotime of each cell (Supplemental Fig. S23A,B). We selected several key cancer-related gene programs and calculated the DeCEP scores in “continuous” mode, using cell pseudotime ordering as the continuous cellular context. We defined the onset of EMT (indicated as branch 1 in Supplemental Fig. 23A) as the transition point for these gene programs, allowing us to capture dynamic changes occurring before and after EMT. The results revealed that the DeCEP scores of these cancer-related gene programs generally increased with increasing pseudotime (Fig. 7A). Notably, TGFB signaling, Wnt signaling, and focal adhesion exhibited strong pseudotime dependence, with significant effects exceeding 0.6 (Fig. 7B). Additionally, we applied existing methods to quantify the activity of these cancer-related gene programs in the cells. The findings demonstrated that DeCEP exhibited higher correlations with pseudotime compared with existing methods, both at the level of individual gene programs (Fig. 7C) and in the overall trend (Fig. 7D), indicating the capability of DeCEP to capture the dynamic variability of gene programs within specific contexts.
DeCEP uncovers dynamically evolving gene programs in tumor keratinocytes during tumor progression. (A) Distribution of DeCEP scores for cancer-related gene programs over pseudotime. (B) Strength of associations between the DeCEP scores and the pseudotime factor. (C) Correlations between individual gene program activity scores and the pseudotime factor in DeCEP and existing methods. (D) Strength of associations between overall gene program activity of cancer-related gene programs and the pseudotime factor in DeCEP and existing methods. (E) Weights of the hub genes associated with the dynamically evolving gene programs. (F) Comparison of proportions of five cell clusters (clusters 0–4) in high and low DeCEP states. (G) Associations between gene program activity states and cell clusters between DeCEP and existing methods. The contingency coefficient and Cramer's V are shown.
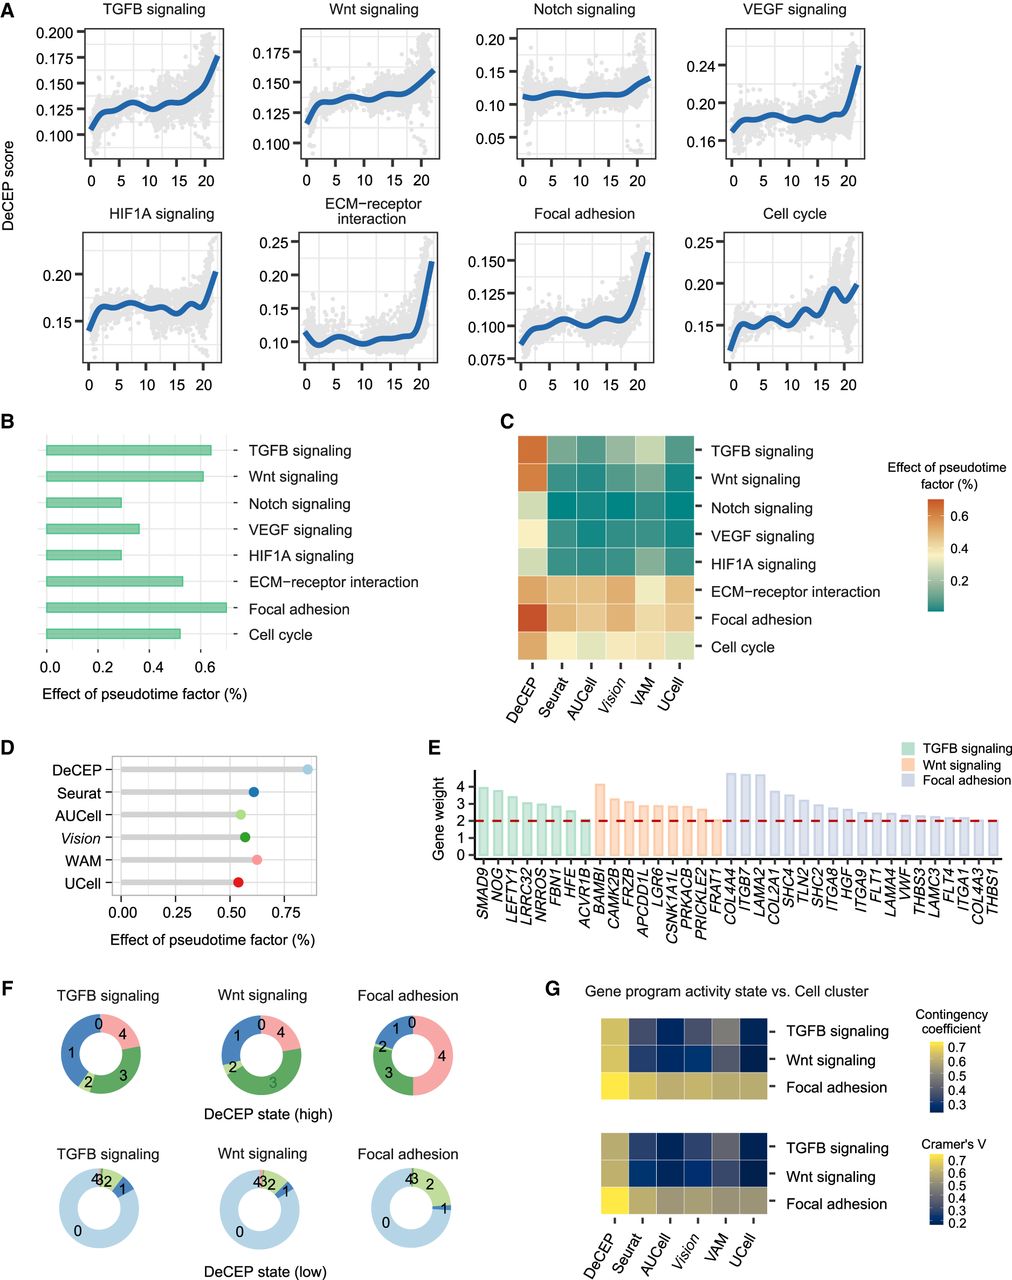
Focusing on the three most pseudotime-dependent gene programs given by DeCEP, we identified several pseudotime-dependent hub genes. These findings suggest that, during cancer progression, the expression of these hub genes at a given time may potentially trigger the expression of a cascade of genes at subsequent time points, such as SMAD9 in TGFB signaling and BAMBI in Wnt signaling (Fig. 7E; Supplemental Fig. S24). Additionally, as cells with high DeCEP states related to focal adhesion were enriched in a larger proportion of cluster 4, we inferred that TGFB and Wnt signaling may become active earlier than focal adhesion (Fig. 7F), suggesting that TGFB and Wnt signaling have potential regulatory effects on focal adhesion. In contrast to the cell states determined by DeCEP, the cell states identified by existing methods were more scattered across the UMAP plot (Supplemental Fig. S25). Here, we examined the associations between the cell states of the gene programs and cell clusters using both DeCEP and existing methods, showing that the DeCEP states exhibited stronger correlation with cell clusters, particularly for the two gene programs related to TGFB and Wnt signaling (Fig. 7G).
We also conducted ST analysis on a human cSCC tissue section (Ji et al. 2020), clustering the spots into 10 clusters, labeled clusters 0–9 (Fig. 8A,B). To validate the inference from the preceding paragraph, we mapped the DeCEP states of TGFB and Wnt signaling to these spots. The spots with high DeCEP states for both gene programs were primarily concentrated in clusters 2 and 5 (Fig. 8C,D). Differential expression analysis revealed that several genes associated with the tumor microenvironment (TME) were significantly upregulated in clusters 2 and 5, suggesting that these spots with high DeCEP states are likely associated with the TME (Supplemental Fig. S26A; Supplemental Table S1). We also observed that clusters 3, 8, and 9 showed high expression of TME-related genes, but the spots in these clusters did not exhibit significantly high DeCEP states. To further explore these differences, we performed additional analyses comparing clusters 3, 8, and 9 with clusters 2 and 5 (Supplemental Note 9). Additionally, enrichment analysis indicated that, compared to spots with low DeCEP states, spots with high DeCEP states for both gene programs were most enriched in focal adhesion and ECM–receptor interaction (Supplemental Fig. S26B). These results support the potential regulatory effects of TGFB and Wnt signaling on focal adhesion, accompanied by interactions between the invasive tumor and the TME.
DeCEP depicts the spatial characteristics of gene programs during tumor invasion. (A) Hematoxylin and eosin–stained tissue section of a human cSCC sample. (B,C) Distribution of spatial domains derived from spatial clustering (B) and the DeCEP states for the two gene programs regulating cancer progression (C) in the cSCC tissue section. (D) Comparison of the proportions of the two gene programs with high DeCEP states across different spatial domains. (E) The ROIs and corresponding neighborhoods are distributed adjacently on the tissue section. (F) Weights of the hub genes involved in TGFB and Wnt signaling with high DeCEP states as the ROIs. (G) The DeCEP scores in the ROIs and corresponding neighborhoods for the two gene programs underlying local tumor invasion. (H) Associations between spot clusters and gene program activity scores identified by DeCEP and existing methods. The Spearman's correlation coefficient (r) is shown. (I) Associations between the gene program activity scores for TGFB and Wnt signaling identified by DeCEP and existing methods. The Spearman's correlation coefficient (r) is shown. (J) Correlation coefficients (r) of the DeCEP scores in the ROIs and ribosomal gene expression levels in the neighborhoods. Spearman's rank correlation.
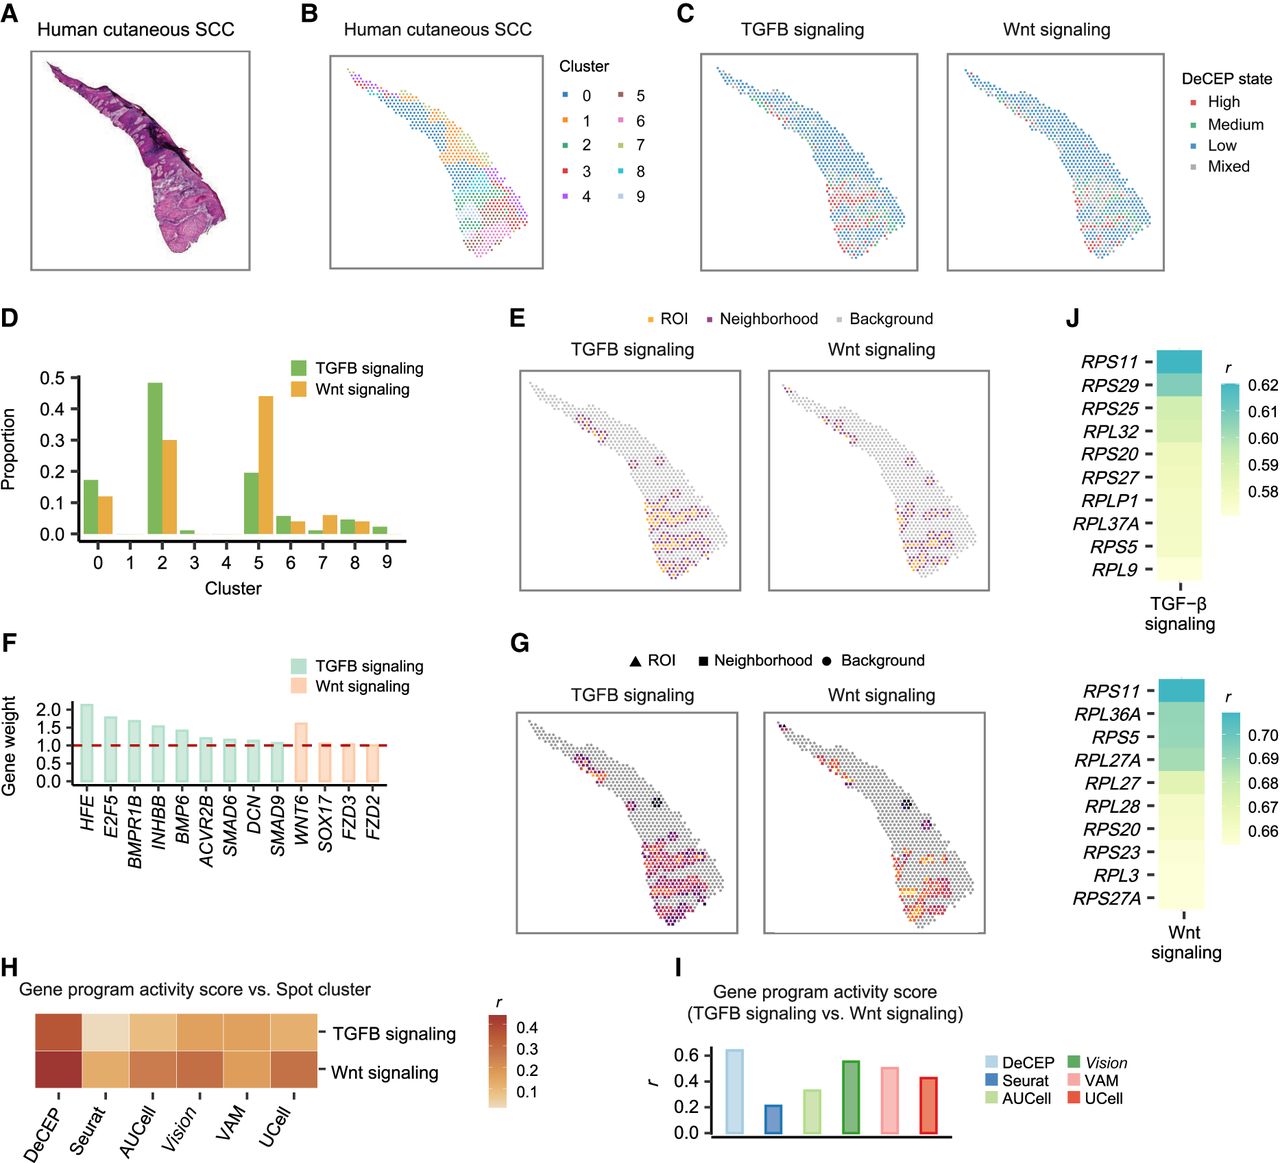
To explore the factors influencing the spots with high DeCEP states of TGFB and Wnt signaling, we selected the regions containing these spots as ROIs. Using DeCEP in its “spatial” mode, we identified both the spots and their surrounding neighborhoods as spatial contexts associated with the tumor invasion phenotype. Further analysis revealed that the ROIs and their corresponding neighborhoods exhibited heightened levels of active cell–cell communication within these spatial contexts compared with other spots (Fig. 8E; Supplemental Fig. S27). We identified several spatially dependent hub genes that may regulate the phenotypic plasticity of cancer cells in the TME, which is crucial for local invasion (Fig. 8F). The DeCEP scores displayed a gradual increase in activity from the surrounding neighborhoods to the ROIs, reflecting progressive tumor invasion (Fig. 8G). We also assessed existing methods for calculating spot scores for the same two gene programs. The results indicated that the variability of activity scores across different spot clusters was lower for these existing methods than for DeCEP (Fig. 8H; Supplemental Fig. S28). Moreover, the correlations between the activity scores for the two gene programs calculated by existing methods were weaker than those derived using DeCEP (Fig. 8I). Correlation analysis between the DeCEP scores of the ROIs and gene expression in the surrounding neighborhoods revealed a significant number of ribosomal genes that were positively correlated with the DeCEP scores (Fig. 8J), suggesting ongoing protein synthesis during tumor invasion. Such insights could not be captured using existing methods. Specifically, the spatial contexts associated with the tumor invasion phenotype identified through DeCEP provide a valuable foundation for obtaining fine-grained information in a function-centric manner. By effectively identifying the ROIs and their neighborhoods, DeCEP enhances the diversity of hierarchical data analysis and interpretation. Compared to existing methods, DeCEP focuses on the quantification of specific spatial contexts, better capturing the variability of cancer-related gene program scores along spatial gradients.
Discussion
In this work, we developed DeCEP, which leverages directed graphs and functional gene lists to decipher context-specific gene programs from scRNA-seq and ST data. DeCEP uses directed graphs to model context-specific functional networks to reveal the transcriptional coregulation of functional genes across different cellular or spatial contexts. DeCEP exploits the intrinsic graph structure to characterize gene programs within specific contexts, distinguishing it from other existing methods. This capability is crucial for identifying heterogeneous expression patterns for gene programs in complex biological systems. Furthermore, DeCEP employs the topology of functional networks to identify context-dependent hub genes and weights these genes to quantify the activity of gene programs in individual cells or spatial locations, denoted as DeCEP scores. In this way, by mapping functional gene programs from the molecular to cellular or spatial dimensions, the outcomes of DeCEP can be more biologically interpretable and insightful. DeCEP can also discretize DeCEP scores from scRNA-seq data into distinct DeCEP states. This depiction stands apart from conventional cell clustering, bringing a diversity of data interpretations. Such scRNA-seq data with the assigned DeCEP states can further serve as a valuable reference for identifying ROIs in the corresponding ST data.
We benchmarked DeCEP using both simulated and real biological data. By evaluating the ability of different methods to capture biologically relevant signals that potentially reflect gene program activity within specific contexts, we indirectly inferred their potential to characterize context-specific gene programs. The results showed that DeCEP is capable of more precisely capturing subtle similarities and differences among cells within these contexts, further demonstrating its capability in extracting information for fine-grained data analysis. Although the evaluation does not directly reflect the overall superiority of one method over another, it provides support for the effectiveness and robustness of DeCEP. Furthermore, in analyses of multiple real biological data, DeCEP exhibited an enhanced ability to reveal additional biological insights relative to existing methods.
In fact, DeCEP and existing methods are suitable for different application scenarios. Existing gene set scoring methods allow rapid and direct functional quantification of large numbers of cells with unknown labels (Noureen et al. 2022), thus facilitating initial data exploration. Although DeCEP is not suitable for such large-scale analyses, it provides indispensable complementary value for further fine-grained data analysis. It is specifically appropriate for microlevel characterization of gene programs within specific contexts, particularly those exhibiting pronounced transcriptional heterogeneity. At the cellular level, DeCEP's enhanced ability to sensitively detect biologically relevant signals enables a fine-grained dissection of gene program activity in individual cells, thereby uncovering subtle yet meaningful biological insights. Furthermore, at the gene level, DeCEP facilitates the identification of heterogeneous transcriptional coregulation of functional gene programs in complex biological systems, as demonstrated by the application to AD and cancer data. Because existing gene set scoring methods lack steps for constructing gene networks, they are unable to identify hub genes, which limits the comprehensiveness of their results.
The lack of a direct comparison between DeCEP and existing methods at the gene level poses a challenge in assessing its effectiveness in characterizing gene programs at this scale. Nonetheless, the functional network construction of DeCEP primarily aims to capture the transcriptional coregulation of gene programs within specific contexts, laying the foundation for mapping these heterogeneous expression patterns from the gene level to the cellular level. Therefore, the evaluation of DeCEP in characterizing gene programs at the cellular level within specific contexts indirectly reflects its accuracy at the gene level. This inference is supported by comparative analyses conducted by breaking down the components of the DeCEP framework in both simulated and normal liver tissue data sets (Supplemental Figs. S6, S11).
Additionally, the innovative combination of directed graphs and a priori functional gene lists enables DeCEP to tailor the characterization of gene programs with a functional orientation. Its function-centric direct acquisition strategy avoids de novo identification or mutual interference of gene programs found in matrix factorization–based methods. This allows for the direct and independent characterization of distinct functional gene programs at both the gene and cellular levels, thereby improving interpretability.
On the other hand, compared with existing methods, DeCEP can conduct detailed spatially dependent characterization of gene programs on ST data. Its versatility has been validated in multiple data sets. Indeed, the analysis strategy employed by DeCEP for ST data is significantly different from existing methods. Existing methods assume that functional genes, which represent gene programs, exhibit uniform transcriptional coregulation across a given entire tissue section. Consequently, they advocate for directly characterizing gene program activity consistently across spatial locations within the section, overlooking the significant transcriptional heterogeneity present in ST data and the potential spatial dependence of gene programs. In contrast to these existing methods, DeCEP utilizes scRNA-seq data, in which each cell has been labeled with a clearly defined DeCEP state, as a reference to determine the DeCEP states of spatial locations within the ST data. Spatial locations that exhibit the same DeCEP state reflect the potential for a shared functional phenotype. By leveraging this specific phenotype and considering the distance between spatial locations, DeCEP can delineate specific ROIs and their neighborhoods. This approach enhances the diversity and depth of ST data interpretation. Moreover, by focusing on specific ROIs and their neighborhoods, DeCEP can comprehensively consider spatial contexts during the process of functional network construction and the quantification of spatial locations. Although the differing logical frameworks of DeCEP and existing methods for ST data hinder direct comparability, we conducted a comprehensive analysis comparing DeCEP with existing methods using real biological data. The performance metrics suggest that DeCEP provides enhanced characterization of spatially dependent gene programs within spatial contexts relative to existing methods (see Supplemental Note 10).
We acknowledge several limitations of this study. First, although DeCEP enables direct and independent characterization of specific gene programs in a function-centric manner, its current design may limit the discovery of previously unrecognized genes involved in biological processes. Second, for ST data, DeCEP depends on scRNA-seq data as a reference, which may reduce its convenience for use. Moreover, DeCEP is exclusively applicable to sequencing-based ST data and does not support imaging-based ST data (for further discussion, see Supplemental Note 11).
Methods
Details of the DeCEP framework
DeCEP is a comprehensive framework for identifying context-specific gene programs in single-cell and ST data.
Data preprocessing of scRNA-seq data
First, DeCEP requires the functional gene list obtained from databases as prior knowledge, denoted as G = {g1, g2, …, gn}. Here, n denotes the number of genes in the functional gene list. The raw gene expression matrix requires library size normalization and log2 transformation. The normalized expression matrix of a total of p cells and q genes is denoted as , in which xij represents the expression of gene j in cell i. DeCEP also requires clear cellular context labels (such as cell types, cell states, and disease conditions) to characterize context-specific gene programs.
DeCEP classifies cellular context labels into “discrete” and “continuous” types. If the cellular context labels are discrete, DeCEP selects cells based on the labels’ categories (K = {k1, k2, …, km}) and filters to obtain multiple subsets of X, denoted as , where pi is the number of cells with a cellular context label ki, and m denotes the total number of discrete label categories. If the cellular context labels are continuous (T = {t1, t2, …, tp}), DeCEP employs the time-lag method (Chaitankar et al. 2010) to transform X into a processed matrix that contains context-specific information. DeCEP arranges the cells in ascending order of T, uses the user-defined ΔT as the transition point for the functional gene program that may influence cell fate decisions, and processes X to generate two matrices: and . Here, T1 represents the cellular context before ΔT, and T2 represents the cellular context after ΔT. Specifically, and correspond to the cells with cellular context labels from t1 to (tp − ΔT) and from (t1 + ΔT) to tp, respectively, and and indicate the genes associated with T1 and T2. DeCEP then concatenates and by columns to create the processed matrix . Here, pΔT is the number of rows of the concatenated matrix. Each row contains concatenated gene expression values from a pair made up of one cell within T1 and another cell within T2. This transformed matrix based on the time-lag method allows for the exploration of the dynamic variability of gene programs before and after ΔT.
Finally, DeCEP matches the processed matrix with n genes in the functional gene list and obtains a matrix or a matrix as inputs for the next step in the “discrete” or “continuous” modes, respectively. Additionally, if , the number of genes matching the functional gene list is insufficient to characterize the gene program adequately. Because the number of genes across different functional gene lists varied significantly, we empirically set the threshold to half of the number of genes in each functional gene list. Before constructing functional networks, DeCEP performs Z-score normalization on the input data.
Functional network construction from scRNA-seq data
DeCEP employs PGMs (Koller and Friedman 2009) to construct context-specific functional networks. In the “discrete” mode, DeCEP constructs context-specific functional networks for each of the multiple subsets generated by the preprocessing step, respectively. In the “continuous” mode, DeCEP constructs functional networks using the transformed processed data containing context-specific information. Each network construction corresponds to a specific functional gene list.
The graphical structure represents the coordinated effect of the genes in the functional gene list, where V = {v1, v2, …vN} is a set of nodes representing genes, and E is a directed edge set representing the regulatory effect between genes. Here, N refers to the total number of genes available for constructing the functional network after matching and filtering. Each node vi corresponds to a random variable Xi. The joint probability distribution of X = {X1, X2, …, XN} can be written as follows:
DeCEP employs the max-min hill-climbing (MMHC) algorithm (Tsamardinos et al. 2006) for learning the graph structure. It tests conditional independence with Pearson's correlation, builds the graph skeleton based on the max-min heuristic, and then performs a constrained greedy hill-climbing search to calculate the Bayesian information criterion (BIC) scores (Penny et al. 2007), given by
DeCEP adopts the bootstrap strategy (Hesterberg 2011) to increase the robustness of the edges by sampling C cells with replacement each time and iterating 100 times, where C is the number of cells within a specific cellular context. DeCEP retains edges that appear M (M > 10 × log10C) times out of 100 times and defines M/100 as the edge strength. We set this empirical threshold by incorporating the number of occurrences in 100 iterations and the number of sampled cells. The weight of each node is defined as the sum of the edge strengths when it is a parent node. Nodes with high weights are assigned by DeCEP as hub genes in the gene program. When DeCEP is running in “continuous” mode, it is mandatory to specify genes in T1 as parent nodes and genes in T2 as child nodes. When running in “discrete” mode, there is no mandatory requirement.
Cell identity characterization from scRNA-seq data
DeCEP quantifies the activity of context-specific gene programs based on the weight of genes in the corresponding functional gene list. Accurately quantifying gene program activity is challenging owing to the sparsity and noise inherent in scRNA-seq data (Lähnemann et al. 2020). DeCEP adopts a strategy that incorporates an imputation step to recover the true gene expression level for each gene in cells within a specific cellular context. Specifically, to enhance the gene expression within the functional gene list reflecting the gene program, DeCEP applies MAGIC (van Dijk et al. 2018) to impute probable gene expression in each cell, thereby generating the imputed functional gene matrix , where pcont refers to the number of cells within a specific cellular context, and N denotes the number of genes from the functional gene list that are included in the quantification process based on the constructed network. The weight of N genes is denoted by a vector . The weighted sum of these functional genes can be expressed as follows:
Data preprocessing of ST data
Like scRNA-seq data, the raw gene expression matrix requires library size normalization and log2 transformation. The normalized expression matrix of p spots and q genes is denoted as , in which xij represents the expression of gene j in spatial location i. Each spatial location corresponds to a two-dimensional coordinate (xi, yi). DeCEP also requires an scRNA-seq data set in which DeCEP has been performed as a reference, drawing on RCTD (Cable et al. 2022) to map the DeCEP states of the cells to spatial locations. Specifically, RCTD (Cable et al. 2022) is a deconvolution method that generates probability values for each spot in the ST data, indicating its likelihood of belonging to high, medium, or low DeCEP states based on the scRNA-seq reference. To enhance the accuracy of this process, DeCEP applies strict thresholds. Using the Fisher–Jenks algorithm, it identifies natural breaks in the probabilities associated with a specific state and classifies the spots into three categories: low, medium, and high. A spot is assigned to the specific state only if it is classified as high and its probability exceeds 0.4. If spots do not exhibit dominant DeCEP states, they are assigned as mixed states. A “mixed” spot refers to a location containing cells with multiple DeCEP states, suggesting potential spatial variation in gene program activity. Such variations often provide valuable biological insights. Users can analyze mixed-state spots using the same approach as for spots with high, medium, or low states.
Users can specify the ROI by referring to the DeCEP states of spots. Notably, the ROI contains spatial locations within a tissue section when a specific gene program manifests a shared phenotype. The ROI is not constrained solely to adjacent spots, thus providing flexibility in defining spatial contexts based on biological relevance. DeCEP identifies the neighborhood of the user-specified ROI by calculating the Euclidean distance (d) between the spots inside the ROI and those outside the ROI using the following formula: . This distance measurement helps DeCEP determine the spatial relationships between the spots within and outside the specified ROI. DeCEP uses a user-specified distance threshold r to flexibly identify neighboring spots for each spot within a specific ROI, accommodating both one-to-one and one-to-multiple mappings. Specifically, if the distance between a spot within the specified ROI and another spot outside the ROI satisfies d < r, DeCEP designates the latter as the neighboring spot of the former. In the case of multiple mappings, DeCEP calculates the arithmetic mean of gene expression values from neighboring spots to create a synthetic pseudospot, which is then paired with the corresponding actual spot in the ROI. In this way, the paired data are obtained. Here, psp is the number of rows of the concatenated matrix. Each row contains concatenated gene expression values from a pair made up of one actual spot within the specified ROI and either another actual spot or a synthetic pseudospot from the corresponding neighborhood. As a result, the processed matrix generated from this data transformation contains spatial context information. Subsequently, functional gene list matching and feature scaling are conducted in a similar manner to single-cell expression data processing.
Phenotypic characterization of the ROI and its neighborhoods
The strategies for functional network construction, hub gene identification, and DeCEP score quantification are consistent with those for scRNA-seq data. Similarly, the transformed processed data containing context-specific information are directly used. In the “spatial” mode of DeCEP, it is mandatory to specify genes in qneighborhood as parent nodes and genes in qROI as child nodes to capture the impact of neighborhoods on the ROIs. Establishing such constraints is beneficial for exploring the variability of gene programs and underlying biological insights within spatial contexts. Moreover, capturing this directional influence is particularly valuable for understanding hierarchical regulatory factors associated with the ROIs that users are truly interested in. More explanations can be found in Supplemental Note 12. DeCEP draws on stLearn (Pham et al. 2023) to impute spatial gene expression before calculating the DeCEP scores of the ROI and its neighborhood.
Simulation data
To effectively benchmark DeCEP, we simulated a series of scRNA-seq data sets using Splatter (Zappia et al. 2017) and generated the corresponding simulated gene programs. Further details are provided in the Supplemental Methods.
Existing methods for benchmarking
To evaluate the performance of DeCEP in characterizing context-specific gene programs, we benchmarked it against the following five existing methods: Seurat, AUCell, Vision, VAM, and UCell. The specific parameters used for each method are detailed in the Supplemental Methods.
Evaluation metrics
To evaluate the performance of DeCEP in “discrete” mode, we employed both supervised and unsupervised approaches. For the supervised evaluation, we reported the accuracy, sensitivity, specificity, F1 score, and AUC. To ensure fairness in comparison, the same input data were used for both DeCEP and existing methods. Classification labels were not provided to DeCEP during the evaluation process, thereby avoiding potential information leakage. Further details are provided in Supplemental Note 13. For the unsupervised evaluation, we reported the mean SC. In the “continuous” mode, we used a regression-based approach and assessed performance based on the goodness of fit. For details, please refer to the Supplemental Methods.
Collection of data sets and functional gene lists
All data sets analyzed in this study are publicly available. Details of the data sets and functional gene lists can be found in the Supplemental Methods. Additional information on standard analyses is also provided in the Supplemental Methods.
Software availability
DeCEP is an open-source R package available at GitHub (https://github.com/Lin-bioinfo/DeCEP). The source code and test data are also deposited on Figshare (https://figshare.com/articles/software/CoGPS/25976749) and as Supplemental Code.
Competing interest statement
The authors declare no competing interests.
Acknowledgments
This work was supported by the National Natural Science Foundation of China (82272969, 82472880, and 82441040 to Z.H.); the National Key Research and Development Program of China (2022YFA1302700 to Z.H.); the Natural Science Foundation of Shanghai (21JC1403200 to Z.H.); an open project from State Key Laboratory of Medical Genomics, “111 Center” (ZXQT626001 to Z.H.); and the Fundamental Research Funds for the Central Universities.
Author contributions: L.L. and Z.H. conceived the study. L.L. designed the algorithm, developed the R package, and performed the data analyses. L.L. and Z.H. conceived the applications of the algorithm and interpreted the results. L.L. wrote the manuscript with help from all the authors. Z.H. and X.S. revised the manuscript. Z.H. supervised the study. All authors read and approved the final manuscript.
Notes
[1] Supplementary material [Supplemental material is available for this article.]
[2] Article published online before print. Article, supplemental material, and publication date are at https://www.genome.org/cgi/doi/10.1101/gr.279689.124.
References
- ↵Acharyya S, Zhou X, Baladandayuthapani V. 2022. SpaceX: gene co-expression network estimation for spatial transcriptomics. Bioinformatics 38: 5033–5041. 10.1093/bioinformatics/btac645
- ↵Aibar S, González-Blas CB, Moerman T, Huynh-Thu VA, Imrichova H, Hulselmans G, Rambow F, Marine JC, Geurts P, Aerts J, 2017. SCENIC: single-cell regulatory network inference and clustering. Nat Methods 14: 1083–1086. 10.1038/nmeth.4463
- ↵Andreatta M, Carmona SJ. 2021. UCell: robust and scalable single-cell gene signature scoring. Comput Struct Biotechnol J 19: 3796–3798. 10.1016/j.csbj.2021.06.043
- ↵Barabási AL, Oltvai ZN. 2004. Network biology: understanding the cell's functional organization. Nat Rev Genet 5: 101–113. 10.1038/nrg1272
- ↵Ben-Moshe S, Itzkovitz S. 2019. Spatial heterogeneity in the mammalian liver. Nat Rev Gastroenterol Hepatol 16: 395–410. 10.1038/s41575-019-0134-x
- ↵Buettner F, Pratanwanich N, McCarthy DJ, Marioni JC, Stegle O. 2017. f-scLVM: scalable and versatile factor analysis for single-cell RNA-seq. Genome Biol 18: 212. 10.1186/s13059-017-1334-8
- ↵Cable DM, Murray E, Zou LS, Goeva A, Macosko EZ, Chen F, Irizarry RA. 2022. Robust decomposition of cell type mixtures in spatial transcriptomics. Nat Biotechnol 40: 517–526. 10.1038/s41587-021-00830-w
- ↵Calsolaro V, Edison P. 2016. Neuroinflammation in Alzheimer's disease: current evidence and future directions. Alzheimers Dement 12: 719–732. 10.1016/j.jalz.2016.02.010
- ↵Cha J, Lee I. 2020. Single-cell network biology for resolving cellular heterogeneity in human diseases. Exp Mol Med 52: 1798–1808. 10.1038/s12276-020-00528-0
- ↵Chaitankar V, Ghosh P, Perkins EJ, Gong P, Zhang C. 2010. Time lagged information theoretic approaches to the reverse engineering of gene regulatory networks. BMC Bioinformatics 11 Suppl 6: S19. 10.1186/1471-2105-11-S6-S19
- ↵Choi H, Lee EJ, Shin JS, Kim H, Bae S, Choi Y, Lee DS. 2023. Spatiotemporal characterization of glial cell activation in an Alzheimer's disease model by spatially resolved transcriptomics. Exp Mol Med 55: 2564–2575. 10.1038/s12276-023-01123-9
- ↵Colombo E, Farina C. 2016. Astrocytes: key regulators of neuroinflammation. Trends Immunol 37: 608–620. 10.1016/j.it.2016.06.006
- ↵DeTomaso D, Jones MG, Subramaniam M, Ashuach T, Ye CJ, Yosef N. 2019. Functional interpretation of single cell similarity maps. Nat Commun 10: 4376. 10.1038/s41467-019-12235-0
- ↵Fertig EJ, Ding J, Favorov AV, Parmigiani G, Ochs MF. 2010. CoGAPS: an R/C++ package to identify patterns and biological process activity in transcriptomic data. Bioinformatics 26: 2792–2793. 10.1093/bioinformatics/btq503
- ↵Friedman N, Linial M, Nachman I, Pe'er D. 2000. Using Bayesian networks to analyze expression data. In Proceedings of the Fourth Annual International Conference on Computational Molecular Biology, Tokyo, pp. 127–135. Association for Computing Machinery, New York.
- ↵Frost HR. 2020. Variance-adjusted Mahalanobis (VAM): a fast and accurate method for cell-specific gene set scoring. Nucleic Acids Res 48: e94. 10.1093/nar/gkaa582
- ↵Guilliams M, Bonnardel J, Haest B, Vanderborght B, Wagner C, Remmerie A, Bujko A, Martens L, Thoné T, Browaeys R, 2022. Spatial proteogenomics reveals distinct and evolutionarily conserved hepatic macrophage niches. Cell 185: 379–396.e38. 10.1016/j.cell.2021.12.018
- ↵Gupta PB, Pastushenko I, Skibinski A, Blanpain C, Kuperwasser C. 2019. Phenotypic plasticity: driver of cancer initiation, progression, and therapy resistance. Cell Stem Cell 24: 65–78. 10.1016/j.stem.2018.11.011
- ↵Hanahan D. 2022. Hallmarks of cancer: new dimensions. Cancer Discov 12: 31–46. 10.1158/2159-8290.CD-21-1059
- ↵Hao Y, Hao S, Andersen-Nissen E, Mauck WMIII, Zheng S, Butler A, Lee MJ, Wilk AJ, Darby C, Zager M, 2021. Integrated analysis of multimodal single-cell data. Cell 184: 3573–3587.e29. 10.1016/j.cell.2021.04.048
- ↵Hesterberg T. 2011. Bootstrap. Wiley Interdiscip Rev Comput Stat 3: 497–526. 10.1002/wics.182
- ↵Hu J, Li X, Coleman K, Schroeder A, Ma N, Irwin DJ, Lee EB, Shinohara RT, Li M. 2021. SpaGCN: integrating gene expression, spatial location and histology to identify spatial domains and spatially variable genes by graph convolutional network. Nat Methods 18: 1342–1351. 10.1038/s41592-021-01255-8
- ↵Hwang B, Lee JH, Bang D. 2018. Single-cell RNA sequencing technologies and bioinformatics pipelines. Exp Mol Med 50: 1–14. 10.1038/s12276-018-0071-8
- ↵Ji AL, Rubin AJ, Thrane K, Jiang S, Reynolds DL, Meyers RM, Guo MG, George BM, Mollbrink A, Bergenstråhle J, 2020. Multimodal analysis of composition and spatial architecture in human squamous cell carcinoma. Cell 182: 1661–1662. 10.1016/j.cell.2020.08.043
- ↵Kashima Y, Sakamoto Y, Kaneko K, Seki M, Suzuki Y, Suzuki A. 2020. Single-cell sequencing techniques from individual to multiomics analyses. Exp Mol Med 52: 1419–1427. 10.1038/s12276-020-00499-2
- ↵Koller D, Friedman N. 2009. Probabilistic graphical models: principles and techniques. MIT Press, Cambridge, MA.
- ↵Kotliar D, Veres A, Nagy MA, Tabrizi S, Hodis E, Melton DA, Sabeti PC. 2019. Identifying gene expression programs of cell-type identity and cellular activity with single-cell RNA-seq. eLife 8: e43803. 10.7554/eLife.43803
- ↵Lähnemann D, Köster J, Szczurek E, McCarthy DJ, Hicks SC, Robinson MD, Vallejos CA, Campbell KR, Beerenwinkel N, Mahfouz A, 2020. Eleven grand challenges in single-cell data science. Genome Biol 21: 31. 10.1186/s13059-020-1926-6
- ↵Langfelder P, Horvath S. 2008. WGCNA: an R package for weighted correlation network analysis. BMC Bioinformatics 9: 559. 10.1186/1471-2105-9-559
- ↵Levitin HM, Yuan J, Cheng YL, Ruiz FJ, Bush EC, Bruce JN, Canoll P, Iavarone A, Lasorella A, Blei DM, 2019. De novo gene signature identification from single-cell RNA-seq with hierarchical Poisson factorization. Mol Syst Biol 15: e8557. 10.15252/msb.20188557
- ↵Liang Y, Kaneko K, Xin B, Lee J, Sun X, Zhang K, Feng GS. 2022. Temporal analyses of postnatal liver development and maturation by single-cell transcriptomics. Dev Cell 57: 398–414.e5. 10.1016/j.devcel.2022.01.004
- ↵Manco R, Itzkovitz S. 2021. Liver zonation. J Hepatol 74: 466–468. 10.1016/j.jhep.2020.09.003
- ↵Mi Y, Qi G, Vitali F, Shang Y, Raikes AC, Wang T, Jin Y, Brinton RD, Gu H, Yin F. 2023. Loss of fatty acid degradation by astrocytic mitochondria triggers neuroinflammation and neurodegeneration. Nat Metab 5: 445–465. 10.1038/s42255-023-00756-4
- ↵Mohammadi S, Davila-Velderrain J, Kellis M. 2019. Reconstruction of cell-type-specific interactomes at single-cell resolution. Cell Syst 9: 559–568.e4. 10.1016/j.cels.2019.10.007
- ↵Moses L, Pachter L. 2022. Museum of spatial transcriptomics. Nat Methods 19: 534–546. 10.1038/s41592-022-01409-2
- ↵North MA. 2009. A method for implementing a statistically significant number of data classes in the Jenks algorithm. In 2009 Sixth International Conference on Fuzzy Systems and Knowledge Discovery, Tianjin, China, Vol. 1, pp. 35–38. IEEE, Piscataway, NJ.
- ↵Noureen N, Wang X, Zheng S. 2022. Protocol to benchmark gene expression signature scoring techniques for single-cell RNA sequencing data in cancer. STAR Protoc 3: 101877. 10.1016/j.xpro.2022.101877
- ↵Nouri N, Gaglia G, Mattoo H, de Rinaldis E, Savova V. 2024. GENIX enables comparative network analysis of single-cell RNA sequencing to reveal signatures of therapeutic interventions. Cell Rep Methods 4: 100794. 10.1016/j.crmeth.2024.100794
- ↵Penny WD, Mattout J, Trujillo-Barreto N. 2007. Bayesian model selection and averaging. In Statistical parametric mapping: the analysis of functional brain images (ed. Friston KJ, et al.), Chapter 35, pp. 454–467. Elsevier, London.
- ↵Pham D, Tan X, Balderson B, Xu J, Grice LF, Yoon S, Willis EF, Tran M, Lam PY, Raghubar A, 2023. Robust mapping of spatiotemporal trajectories and cell-cell interactions in healthy and diseased tissues. Nat Commun 14: 7739. 10.1038/s41467-023-43120-6
- ↵Pope SD, Medzhitov R. 2018. Emerging principles of gene expression programs and their regulation. Mol Cell 71: 389–397. 10.1016/j.molcel.2018.07.017
- ↵Rao A, Barkley D, França GS, Yanai I. 2021. Exploring tissue architecture using spatial transcriptomics. Nature 596: 211–220. 10.1038/s41586-021-03634-9
- ↵R Core Team. 2022. R: a language and environment for statistical computing. R Foundation for Statistical Computing, Vienna. https://www.R-project.org/.
- ↵Suhail Y, Cain MP, Vanaja K, Kurywchak PA, Levchenko A, Kalluri R, Kshitiz. 2019. Systems biology of cancer metastasis. Cell Syst 9: 109–127. 10.1016/j.cels.2019.07.003
- ↵Svensson V, Teichmann SA, Stegle O. 2018. SpatialDE: identification of spatially variable genes. Nat Methods 15: 343–346. 10.1038/nmeth.4636
- ↵Thomas PD. 2017. The Gene Ontology and the meaning of biological function. Methods Mol Biol 1446: 15–24. 10.1007/978-1-4939-3743-1_2
- ↵Tsamardinos I, Brown LE, Aliferis CF. 2006. The max-min hill-climbing Bayesian network structure learning algorithm. Mach Learn 65: 31–78. 10.1007/s10994-006-6889-7
- ↵van Dijk D, Sharma R, Nainys J, Yim K, Kathail P, Carr AJ, Burdziak C, Moon KR, Chaffer CL, Pattabiraman D, 2018. Recovering gene interactions from single-cell data using data diffusion. Cell 174: 716–729.e27. 10.1016/j.cell.2018.05.061
- ↵Walker BL, Cang Z, Ren H, Bourgain-Chang E, Nie Q. 2022. Deciphering tissue structure and function using spatial transcriptomics. Commun Biol 5: 220. 10.1038/s42003-022-03175-5
- ↵Wilkerson MD, Hayes DN. 2010. ConsensusClusterPlus: a class discovery tool with confidence assessments and item tracking. Bioinformatics 26: 1572–1573. 10.1093/bioinformatics/btq170
- ↵Wu P, An M, Zou HR, Zhong CY, Wang W, Wu CP. 2020. A robust semi-supervised NMF model for single cell RNA-seq data. PeerJ 8: e10091. 10.7717/peerj.10091
- ↵Yuan S, Norgard RJ, Stanger BZ. 2019. Cellular plasticity in cancer. Cancer Discov 9: 837–851. 10.1158/2159-8290.CD-19-0015
- ↵Zappia L, Phipson B, Oshlack A. 2017. Splatter: simulation of single-cell RNA sequencing data. Genome Biol 18: 174. 10.1186/s13059-017-1305-0
- ↵Zhao E, Stone MR, Ren X, Guenthoer J, Smythe KS, Pulliam T, Williams SR, Uytingco CR, Taylor SEB, Nghiem P, 2021. Spatial transcriptomics at subspot resolution with BayesSpace. Nat Biotechnol 39: 1375–1384. 10.1038/s41587-021-00935-2