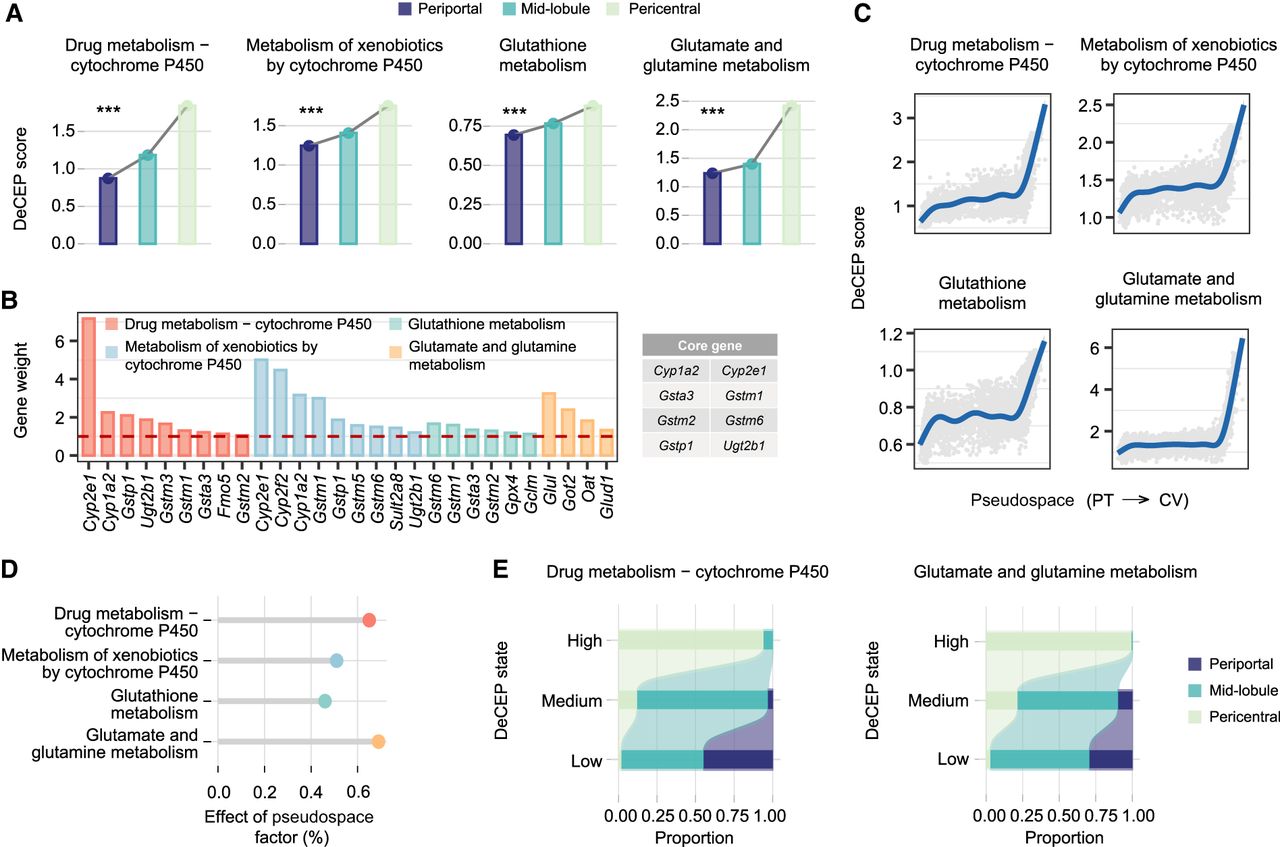
DeCEP reveals a heterogeneous distribution of liver detoxification function along the hepatic lobular axis. (A) Bar plots of the DeCEP scores for liver detoxification–related gene programs across the periportal, mid-lobule, and pericentral regions. The DeCEP scores were compared among hepatocytes in the three different liver regions. The Kruskal–Wallis test: (***) P < 0.001. (B) Weights of the hub genes in the gene programs. Some of the hub genes were defined as core genes that were identified more than once in the four gene programs. (C) Distribution of the DeCEP scores for the gene programs as the pseudospace changes from portal triads (PTs) to the central vein (CV). (D) Strength of associations between the DeCEP scores and the pseudospace factor. (E) Comparison of the proportions of detoxification-related gene programs with distinct DeCEP states in different hepatic lobule regions.