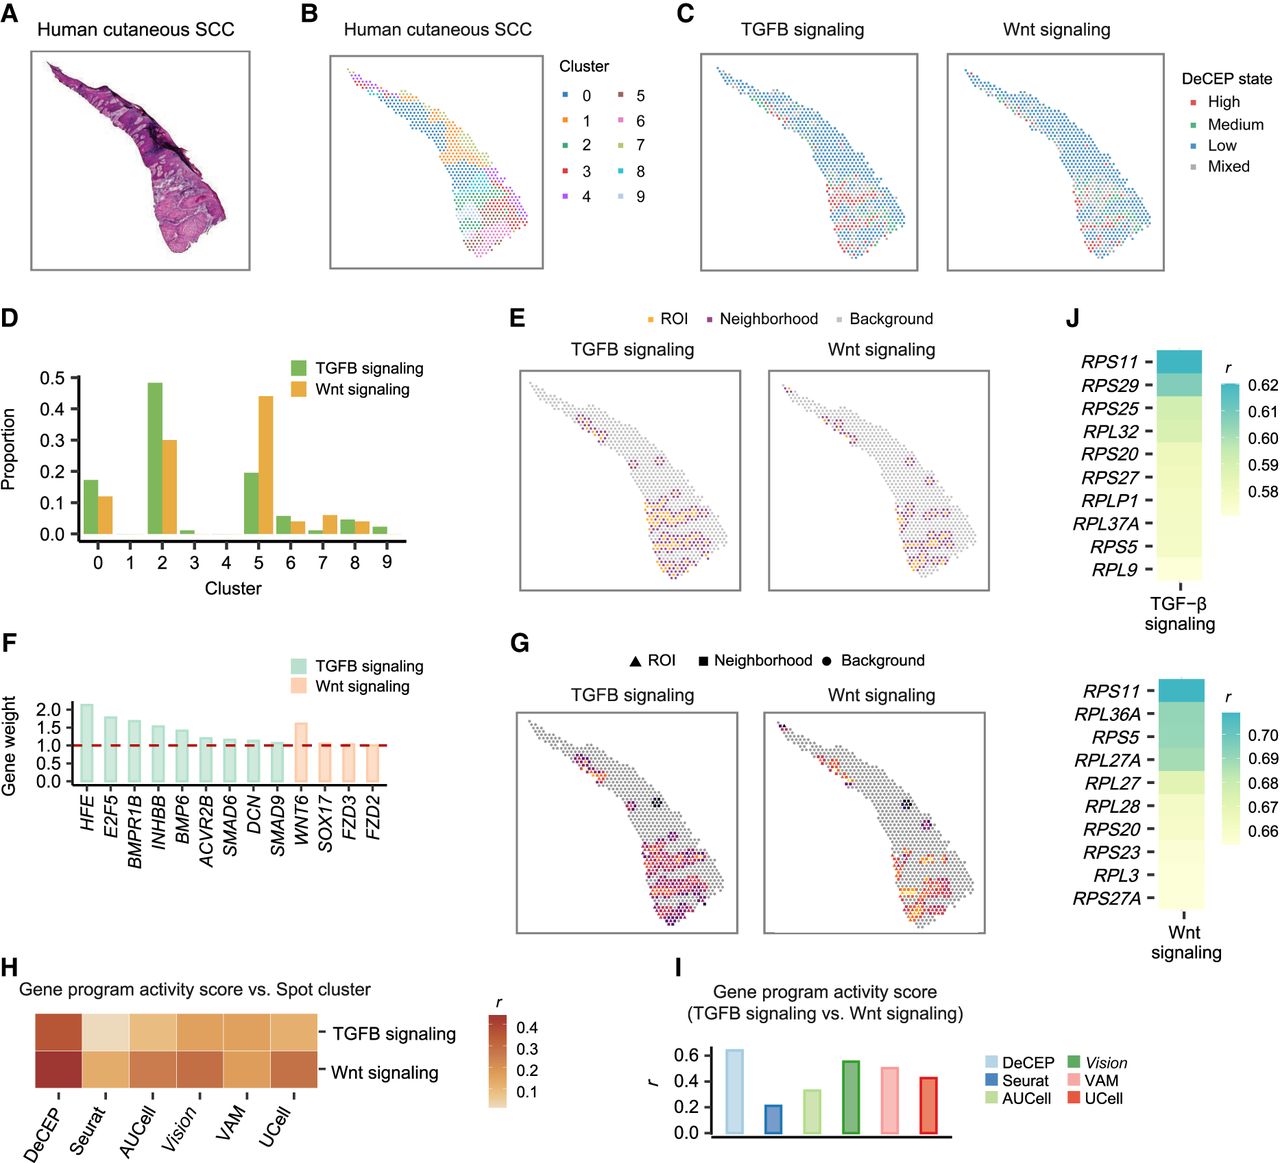
DeCEP depicts the spatial characteristics of gene programs during tumor invasion. (A) Hematoxylin and eosin–stained tissue section of a human cSCC sample. (B,C) Distribution of spatial domains derived from spatial clustering (B) and the DeCEP states for the two gene programs regulating cancer progression (C) in the cSCC tissue section. (D) Comparison of the proportions of the two gene programs with high DeCEP states across different spatial domains. (E) The ROIs and corresponding neighborhoods are distributed adjacently on the tissue section. (F) Weights of the hub genes involved in TGFB and Wnt signaling with high DeCEP states as the ROIs. (G) The DeCEP scores in the ROIs and corresponding neighborhoods for the two gene programs underlying local tumor invasion. (H) Associations between spot clusters and gene program activity scores identified by DeCEP and existing methods. The Spearman's correlation coefficient (r) is shown. (I) Associations between the gene program activity scores for TGFB and Wnt signaling identified by DeCEP and existing methods. The Spearman's correlation coefficient (r) is shown. (J) Correlation coefficients (r) of the DeCEP scores in the ROIs and ribosomal gene expression levels in the neighborhoods. Spearman's rank correlation.