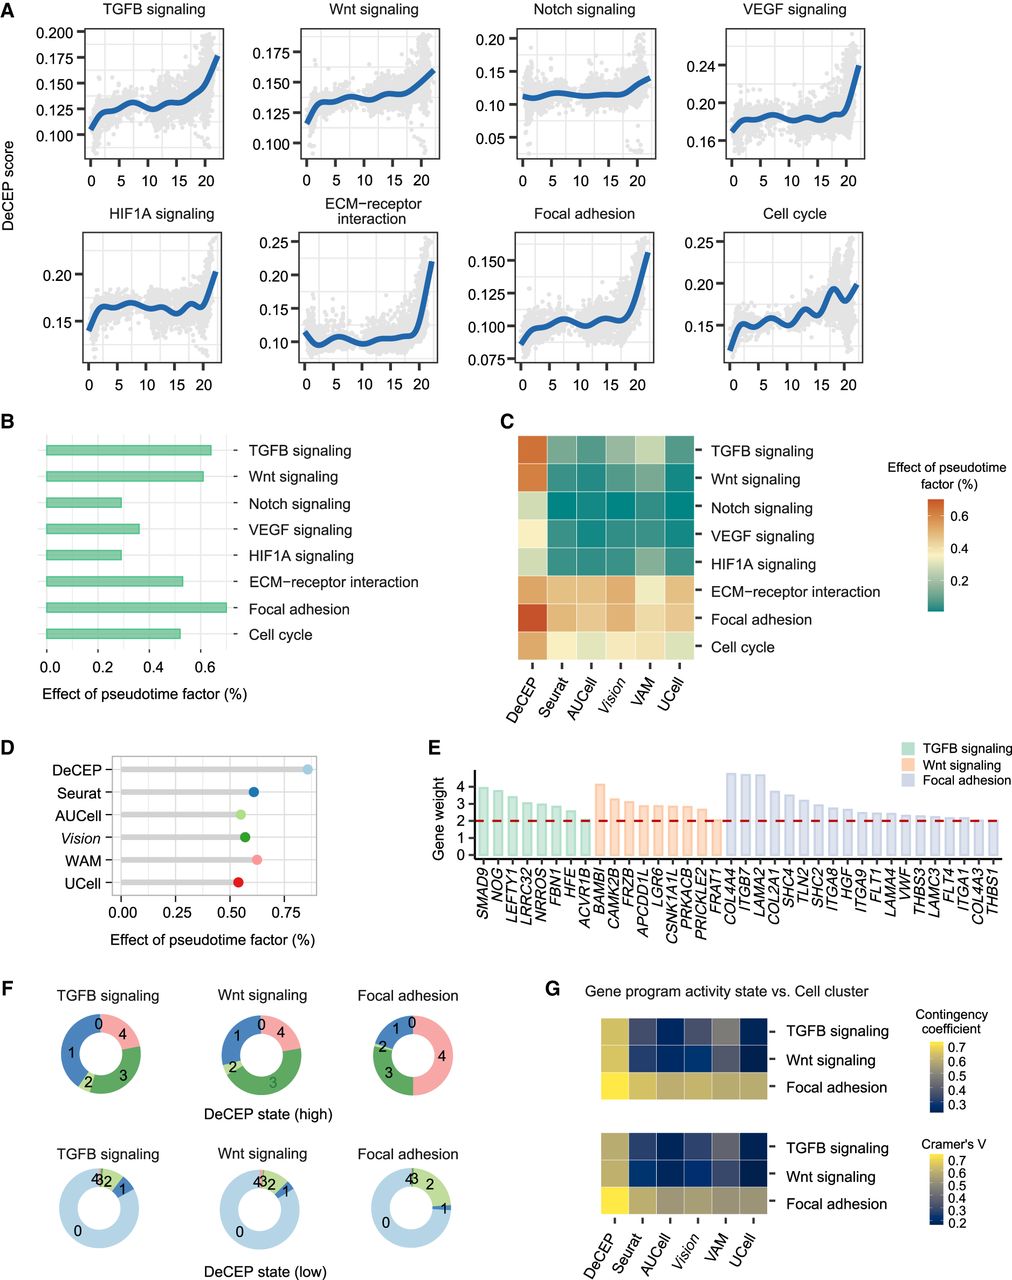
DeCEP uncovers dynamically evolving gene programs in tumor keratinocytes during tumor progression. (A) Distribution of DeCEP scores for cancer-related gene programs over pseudotime. (B) Strength of associations between the DeCEP scores and the pseudotime factor. (C) Correlations between individual gene program activity scores and the pseudotime factor in DeCEP and existing methods. (D) Strength of associations between overall gene program activity of cancer-related gene programs and the pseudotime factor in DeCEP and existing methods. (E) Weights of the hub genes associated with the dynamically evolving gene programs. (F) Comparison of proportions of five cell clusters (clusters 0–4) in high and low DeCEP states. (G) Associations between gene program activity states and cell clusters between DeCEP and existing methods. The contingency coefficient and Cramer's V are shown.