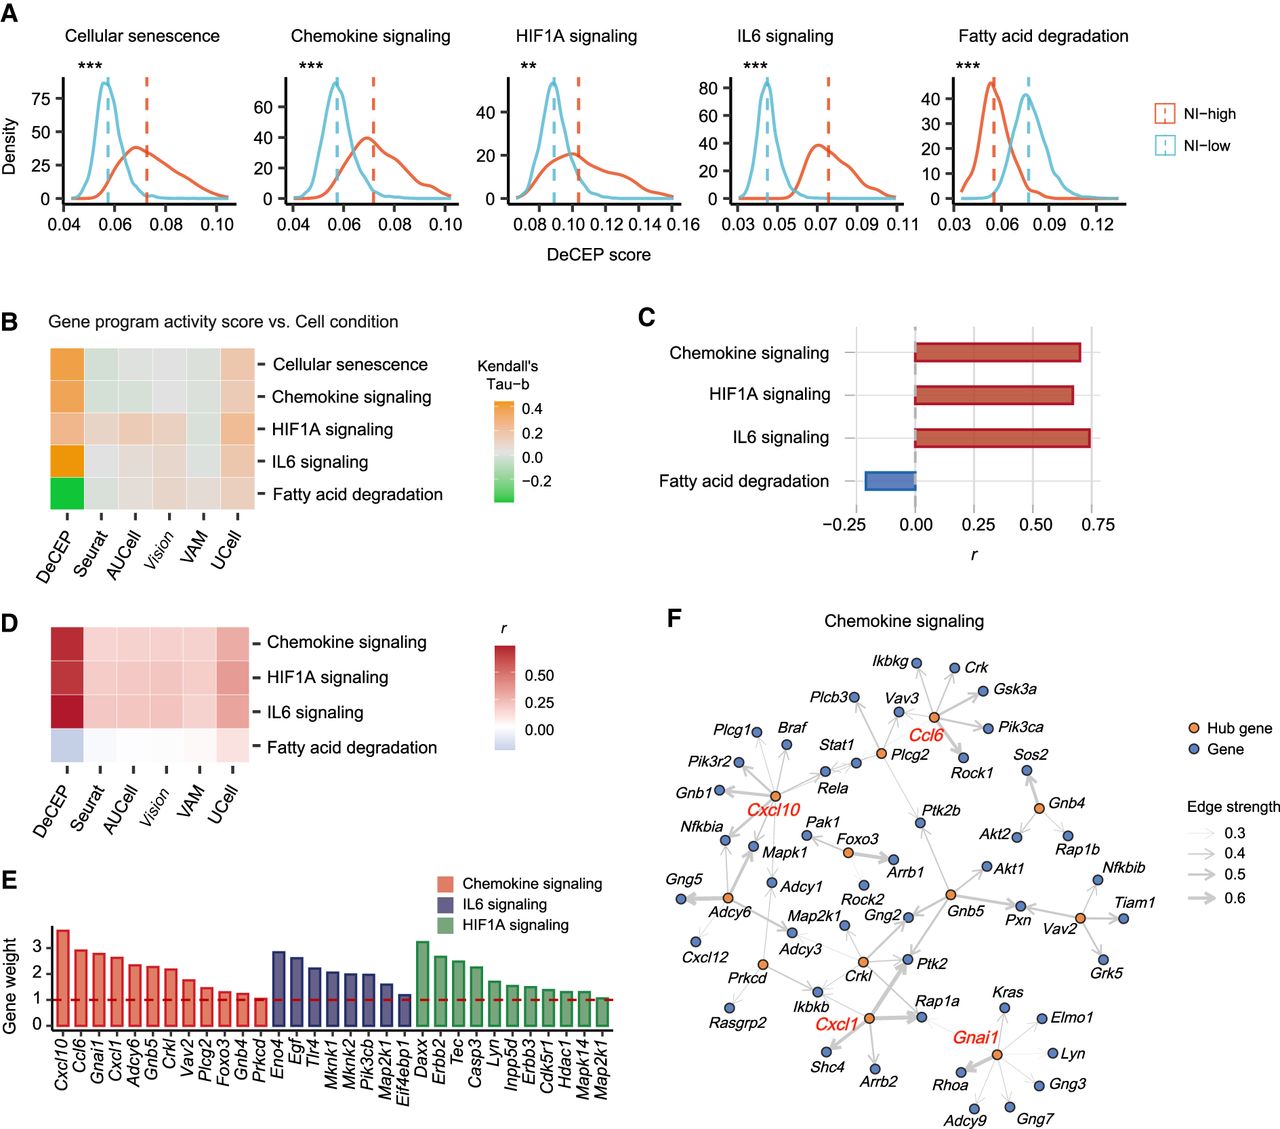
DeCEP identifies gene programs in astrocytes under different inflammatory conditions. (A) Density plots of known neuroinflammatory gene programs under NI-high and NI-low conditions. The DeCEP scores of NI-high and NI-low astrocytes were compared. The one-sided Wilcoxon rank-sum test: (***) P < 0.001, (**) P < 0.01. (B) Associations between NI conditions and gene program activity scores calculated by DeCEP and other existing methods. The Kendall's tau-b correlation coefficient is shown. (C) Correlation coefficients (r) of the DeCEP scores for cellular senescence versus other neuroinflammatory gene programs. Spearman's rank correlation. (D) Comparison of correlation coefficients (r) between cellular senescence and neuroinflammatory gene program activity scores, as calculated by DeCEP and existing methods. Spearman's rank correlation. (E) Weights of several hub genes associated with these neuroinflammatory gene programs under the NI-high condition. (F) The NI-high-specific functional network of chemokine signaling. The genes highlighted in red are key hub genes.