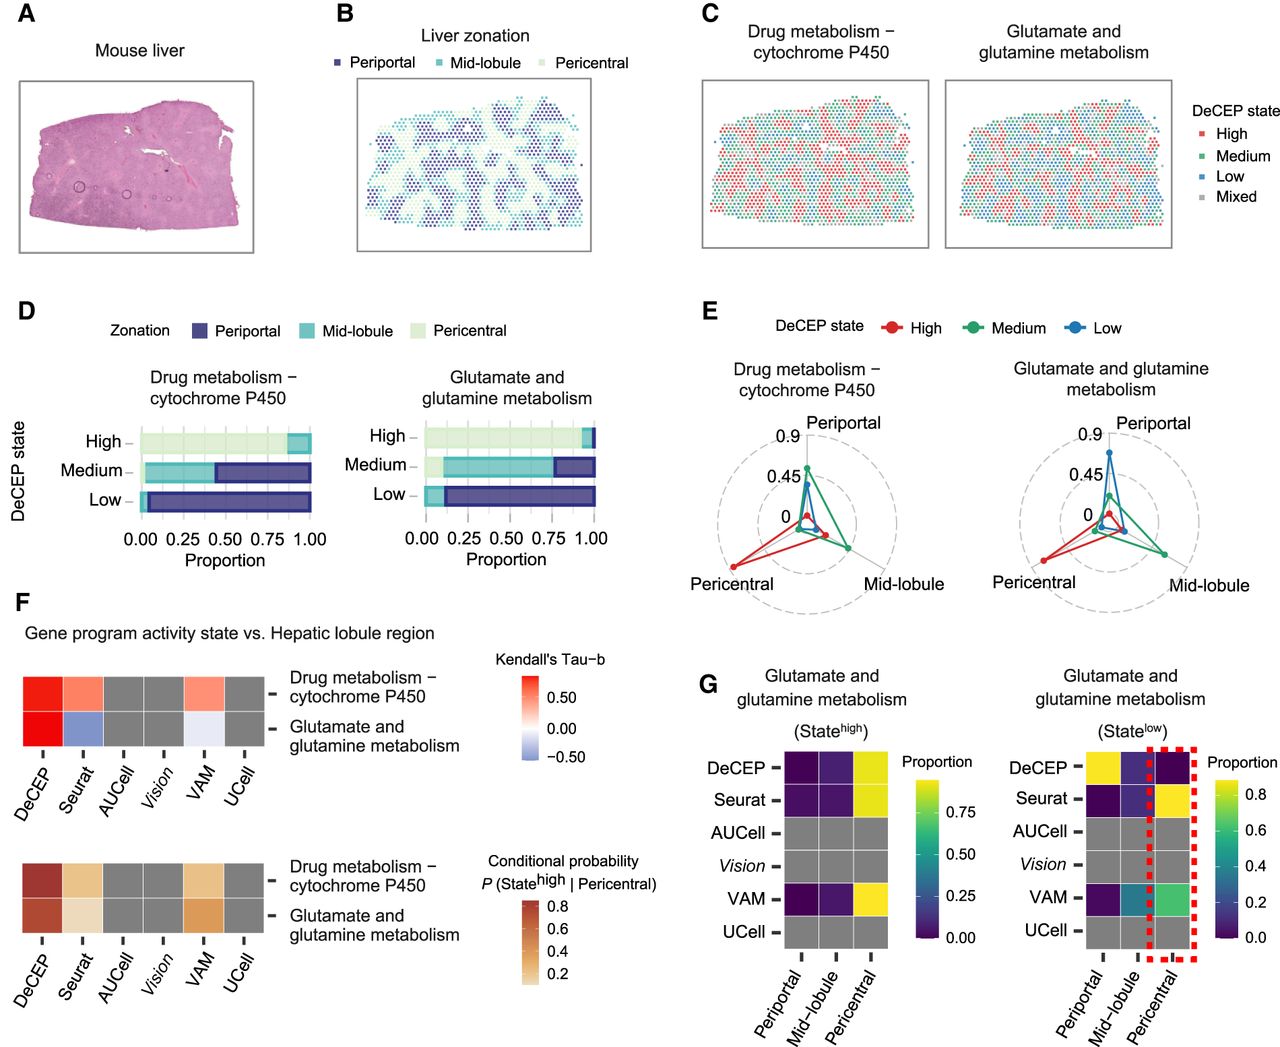
DeCEP depicts the spatial dependence of detoxification-related gene programs in mouse livers. (A) Hematoxylin and eosin–stained tissue section of an adult mouse liver. (B) Distribution of liver regions in the liver tissue section. (C) Distribution of DeCEP states for the two most spatially dependent gene programs in the liver tissue section. (D,E) Proportions of overlap between different DeCEP states and three liver regions. (F) Associations between hepatic lobule regions and gene program activity states identified by DeCEP and other existing methods. The Kendall's tau-b correlation coefficient and the conditional probability of the high DeCEP state given the pericentral region are shown. (G) Comparison of the proportions of hepatic lobule regions across different gene program activity states identified by DeCEP and existing methods. The red dashed box highlights an abnormally high proportion of the low spot states associated with glutamate and glutamine metabolism identified by existing methods in the pericentral region.