
Abstract
To defend against microbes, animals regulate a complex immune response. The Drosophila innate immune system deploys a large transcriptional induction of signaling proteins, antimicrobial effectors, and other critical immune factors. This transcriptional response is encoded in enhancers, cis-regulatory sequences that modulate gene expression by binding transcription factors (TFs). Although enhancers and transcription factor binding sites (TFBSs) have been identified for several immune responsive genes in Drosophila, most enhancers that regulate immune-induced genes are unknown. By identifying enhancers, we can understand how their composition controls expression and contributes to infection outcome. We employ self-transcribing active regulatory-region sequencing (STARR-seq) in a hemocyte-like cell line to identify immune-specific enhancers across the D. melanogaster genome and perform ATAC-seq in hemocytes extracted from adult flies to assess the chromatin state of these enhancers before and after immune stimulus. We identify hundreds of enhancers responsive to IMD stimulation, one of the two primary immune signaling pathways in Drosophila. As expected, immune enhancers are enriched for motifs of Relish, an NF-kB factor, and Kay/Jra, a bZip heterodimer pair, involved in the Imd and JNK pathways respectively, compared with enhancers active in unstimulated cells. However, when grouping enhancers by their target gene's expression timing or functional role or by the enhancers’ chromatin accessibility pre- or post-stimulus, different groups of TFBS motifs are enriched, suggesting distinct regulatory logic for different parts of the immune response. Identification and characterization of the diverse array of enhancers that regulate the innate immune response expand our understanding of how animals fight infections.
When encountering pathogenic microbes, animals must regulate an effective immune response to survive infections. The fruit fly Drosophila melanogaster relies on its innate immune system to defend against invading pathogens, without the aid of an adaptive immune system (Lemaitre and Hoffmann 2007; Buchon et al. 2014). From the fat body, a liver-like organ, and hemocytes, Drosophila blood cells, flies produce a large transcriptional response, inducing more than 1000 genes upon challenge with bacteria and fungi (De Gregorio et al. 2001; Troha et al. 2018; Ramirez-Corona et al. 2021). The resulting proteins carry out a variety of functions, including killing pathogens, relaying signals within and between cells, redistributing metabolic resources, and balancing the costs and the benefits of a persistent immune response.
The immune transcriptional response in flies is regulated by several intertwined pathways that modulate the activity of key transcription factors (TFs). The Imd pathway responds to DAP-type peptidoglycan, predominantly from Gram-negative bacteria, and activates the NF-kB TF Relish. The Toll pathway activates an NF-kB TF, Dif, and is stimulated by fungi and Lys-type peptidoglycan from Gram-positive bacteria (Valanne et al. 2011). The pathways interact in several ways: Some genes can be induced by either pathway; heterodimers between Dif and Relish have been reported; and some immune stimuli appear to stimulate both pathways (Tanji et al. 2007, 2010; Valanne et al. 2010; Troha et al. 2018). JNK signaling is triggered by Imd stimulation via Tak1, a TGFB-associated kinase, activating the Kay/Jra heterodimer, also called AP-1 (Tafesh-Edwards and Eleftherianos 2020). Mutation of key genes in these pathways results in loss of immune-responsive transcription and decreased infection survival (De Gregorio et al. 2002; Brun et al. 2006; Bond and Foley 2009). RNA-seq experiments revealed that these pathways can orchestrate temporal and pathogen specificity within the immune response (Troha et al. 2018; Schlamp et al. 2021).
Transcriptional programs are encoded in enhancers: cis-regulatory sequences composed of TF binding sites that, when bound, regulate expression of target genes. Tens of immune regulatory sequences have been identified by searching for NF-kB and other motifs upstream of genes that encode antimicrobial peptides and other highly induced immune genes (Senger et al. 2004; Busse et al. 2007). However, the vast majority of enhancers that control the approximately 1000 immune-responsive genes are unknown. Identifying immune enhancers is critical to understanding how innate immunity coordinates a complex response upon infection. Flies provide an innate-only immune system to study these pathways, which are conserved not only across insects but also in mammals (Dushay and Eldon 1998; Yu et al. 2022).
To identify immune regulated enhancers genome wide, we used self-transcribing active regulatory-region sequencing (STARR-seq) (Arnold et al. 2013; Muerdter et al. 2015). This high-throughput activity-based assay identifies sequences that act as enhancers to drive their own transcription. We performed this assay in S2* cells, a D. melanogaster hemocyte-like cell line that is more immune responsive than its S2 parental line (Samakovlis et al. 1992; Cherbas et al. 2011). We focused on the immune response to a Gram-negative bacterium, as it induces an immune response in a cell-autonomous manner that is reproducible in cell culture. To induce this immune response in S2* cells, we pretreated cells with the steroid hormone 20-Hydroxyecdysone (20E) before addition of heat-killed Serratia marcescens (HKSM), a Gram-negative bacterium. In whole organisms, 20E has been shown to regulate development as well as immunity, and treatment of S2* cells with 20E induces expression of PGRP-LC, a critical receptor in the Imd pathway (Rus et al. 2013). By analyzing the enhancers revealed by STARR-seq, we aim to relate TF binding site content to enhancer and target gene function. Also, by comparing these data to chromatin accessibility in hemocytes before and after immune stimulation, we aim to characterize the in vivo chromatin dynamics of immune-responsive enhancers.
Results
A STARR-seq assay reveals thousands of enhancers active in immune-stimulated cells
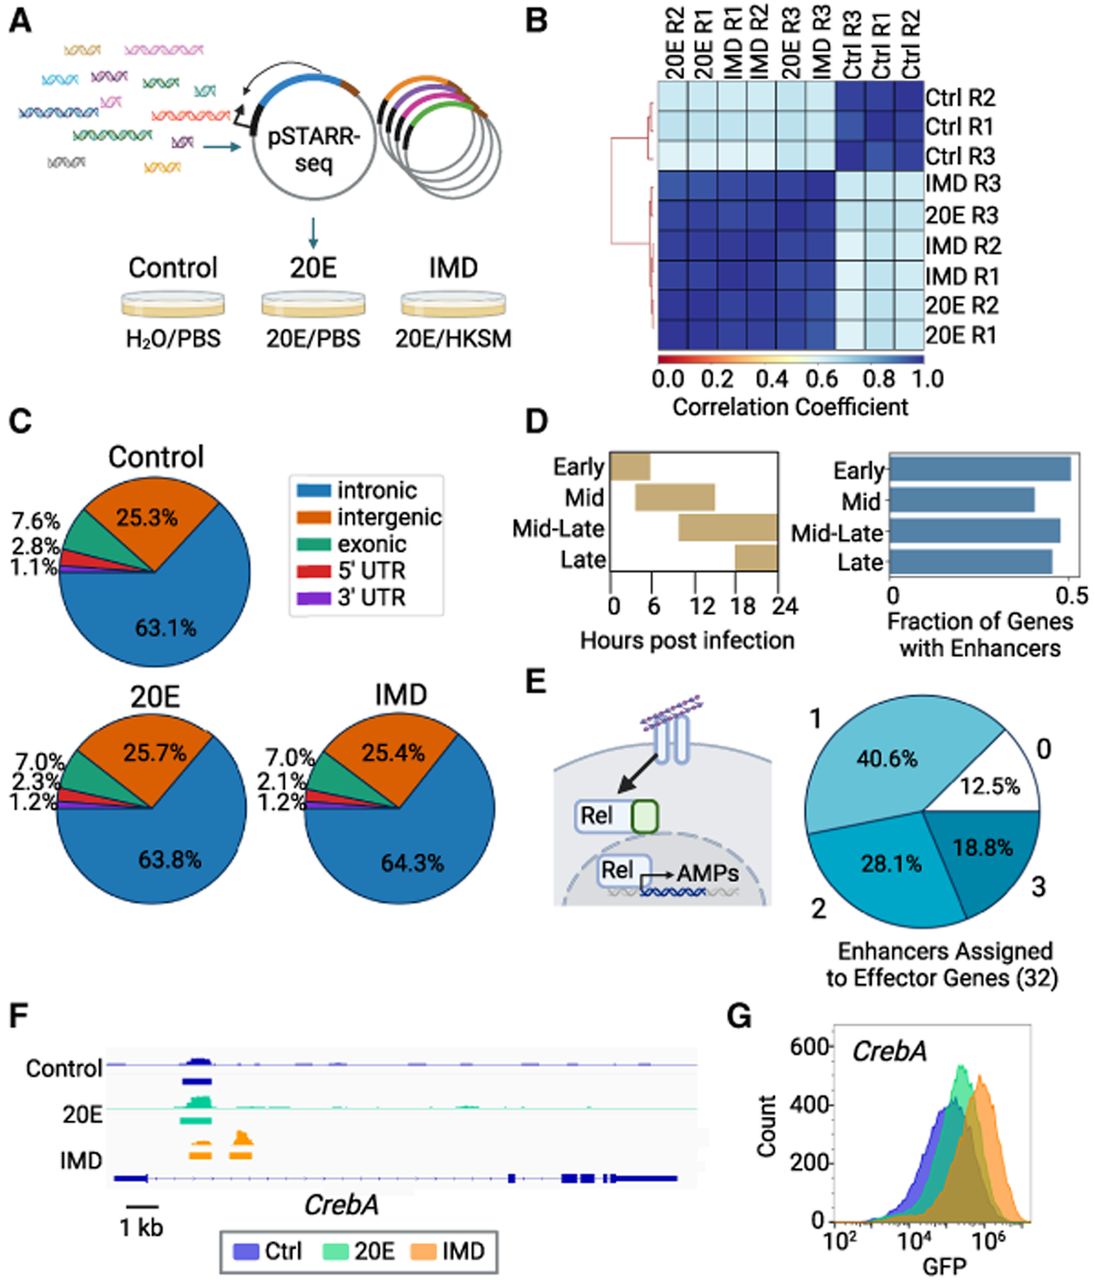
To identify the enhancers that regulate the Drosophila innate immune response, we performed a STARR-seq experiment in S2* cells (Samakovlis et al. 1992; Cherbas et al. 2011). Briefly, a genome-wide library of plasmids containing 500–750 bp fragments, under control of the Drosophila synthetic core promoter (DSCP), was introduced into cells. Cells were treated with the hormone 20-hydroxyecdysone (20E) and/or HKSM to create three treatment conditions, control (water and PBS), 20E (20E and PBS) and IMD (20E and HKSM) (Fig. 1A). Samples were processed following the STARR-seq protocol and peaks of enhancer activity were called with the STARRPeaker program (Lee et al. 2020). Peaks from different replicates of the same treatment show greater than 0.95 Pearson's correlation between them. Samples treated in the 20E and IMD treatment groups also show a high level of correlation, distinguishing them from control treated samples (Fig. 1B).
Immune enhancers identified by STARR-seq. (A) Schematic of STARR-seq experiment. Fragmented genomic DNA is cloned into the pSTARR-seq plasmid, creating a library of putative enhancer regions. This library is transfected into S2* cells, split into three different populations, and treated with either H2O/PBS, 20E/PBS, or 20E/heat-killed Serratia marcescens (HKSM). (B) Pearson's correlation of each individual replicate across three treatments. (C) Distribution of enhancers in genomic regions. (D) Schlamp et al. (2021) identified four time clusters of gene expression in the first 24 h following immune stimulation in adult flies; peak expression times for each time cluster are shown. Enhancers were assigned to these immune genes, and the fraction of immune genes identified by Schlamp et al. (2021) with an immune enhancer is plotted. (E) Schematic of Imd pathway activated by DAP-type peptidoglycan binding to peptidoglycan recognition proteins (PGRPs), leading to the cleavage of the NF-kB Relish, allowing its translocation into the nucleus, where it activates transcription of antimicrobial peptides (AMPs). Pie chart of the number of enhancers assigned to 32 Imd-associated AMPs and other effectors (Westlake et al. 2024). (F) Integrative Genomics Viewer (IGV) view of the CrebA gene locus, showing the STARR-seq output tracks and STARRPeaker called peaks for all treatment conditions. STARR-seq identified two enhancers in the CrebA intron, one shared across all conditions and one that is IMD specific (Robinson et al. 2011). (G) Overlay histogram of GFP levels of S2* cells transfected with a GFP reporter of the IMD-specific CrebA enhancer analyzed by flow cytometry.
To devise a set of enhancers that agreed across the replicates, we created the consensus enhancers, the union of enhancers that overlap in at least two of the three replicates (Supplemental Fig. S1A). The consensus enhancer set contains 2388 control enhancers, 3080 20E enhancers, and 2934 IMD enhancers. Enhancers have an average length of 725, 746, and 743 bp for the control, 20E, and IMD data sets, respectively, with the longest enhancers reaching >2000 bp in length (Supplemental Fig. S1B). The consensus enhancers were used for the remainder of the analysis.
We compared our consensus enhancers to previously described enhancers to validate the enhancers identified by this STARR-seq experiment. We first binned enhancers by their genomic region and found the majority (63.1%–64.3%) fall within intronic regions of the genome, with a smaller group (25.3%–25.7%) in intergenic regions. Similar genomic distributions of Drosophila enhancers were previously found using STARR-seq (Arnold et al. 2013) or enhancer chromatin marks H3K4me1 and H3K27ac (Fig. 1C; The modENCODE Consortium et al. 2010). Additionally, because S2* are derived from S2 cells, we compared the enhancers in the unperturbed sample (control) to enhancers identified in unperturbed S2 cells. Seventy-two percent (1727/2388) of control enhancers from the S2* cells have an overlap of at least 100 bp with STARR-seq enhancers found in S2 cells (Arnold et al. 2013). Overall, the consensus enhancers resemble previously identified Drosophila enhancers, in both sequence and genomic regions.
To determine if we identified enhancers that regulated immune genes, we assigned enhancers to genes. Because the vast majority of Drosophila enhancers are close to their target genes, for each gene we assigned enhancers that occurred in the sequence spanning from 15 kb upstream of to 5 kb downstream from the gene body, as in the work Arnold et al. (2013) and Kvon et al. (2014). Previous work has finely mapped the time course of transcriptional regulation of immune genes in the first 24 h of Imd stimulation in whole adult flies (Schlamp et al. 2021) and clustered the genes by their expression timing. We found IMD enhancers for just under half of these immune genes (252/551), fairly evenly distributed across the time clusters (Fig. 1D). When looking at a core list of Imd-associated effector peptides, including antimicrobial peptides, we found IMD enhancers near almost all of these genes (28/32) (Fig. 1E; Westlake et al. 2024). Our IMD enhancers overlap with Relish and other NF-kB sites that have been previously identified to regulate immune genes, including Mtk, PGRP-SD, CecC, AttC, AttD, and DptB (Uvell and Engström 2003; Senger et al. 2004; Busse et al. 2007). Therefore, we conclude that enhancers found in the IMD set likely control immune genes.
As an illustration of the data, we found two novel enhancers in the first intron of the TF CrebA: one shared across conditions and one that is IMD specific (Fig. 1F). CrebA is upregulated by both the Toll and Imd pathways and is crucial for survival after infection with a diverse set of bacteria because it prevents infection-associated ER stress (Troha et al. 2018). To confirm the IMD-specific enhancer's activity and response to immune stimulus, we expressed GFP under the control of this enhancer and a minimal promoter in S2* cells. We saw an increase in mean GFP expression by flow cytometry in IMD treated cells compared with 20E and control cells (Fig. 1G). The features of the enhancers identified by STARR-seq, including the close association of IMD enhancers with known immune genes and validation of an individual enhancer, suggest that our approach has identified a large set of bona fide enhancers.
Analysis of enhancers reveals a variety of TFs used to activate each category of enhancers
To find the TFs controlling immune enhancers, we searched for the motifs that are enriched in the IMD enhancer set compared to the genomic background using i-cisTarget (Imrichová et al. 2015). We first identified motifs enriched across the entire set of IMD enhancers, which yielded 473 significant motifs. Many of these motifs are similar, so we grouped them into families by sequence similarity using phylogenetic trees and selected the following TF families for further analysis (Supplemental Fig. S2A). First, we selected the TFs with well-established roles in Imd immunity, Relish and the heterodimer pair Kay/Jra (Tafesh-Edwards and Eleftherianos 2020), and ecdysone response, EcR/Usp and Eip74EF (Rus et al. 2013). Next, we identified enriched motifs for TFs that have roles in hemocyte differentiation: GATA factors, forkhead TFs, and Gcm. GATA motifs can be bound by several family members, so we examined RNA-seq data generated alongside the STARR-seq experiment. Srp and pnr were both highly expressed in S2* cells and hemocytes in line with their roles in hemocyte development (Supplemental Fig. S3A,B; Minakhina et al. 2011; Spahn et al. 2014). Likewise, among the forkhead TFs, jumu is the most highly expressed and is required for hemocyte differentiation and phagocytosis in larvae (Hao et al. 2018). Gcm is a zinc finger TF that is expressed in embryonic hemocytes and regulates their development (Bazzi et al. 2018).
To broaden our search for TFs, we used two approaches. First, we focused on motifs that were enriched in IMD enhancers i-cisTarget and whose associated TF is expressed in S2* cells (Supplemental Fig. S3A) but were without a reported immune role. These include Trl, the GAGA factor in Drosophila, as well as the bZIP TFs, Xbp1 and Xrp1. Second, we searched for motifs enriched in enhancers associated with genes in the four immune time clusters. We saw a number of basic helix–loop–helix (bHLH) motifs enriched in enhancers associated with the late time cluster (Supplemental Fig. S2B). We included SREBP, because it is activated by Gram-negative bacteria in the intestines and regulated by Imd in adipocytes, and Crp, because it was highly enriched via i-cisTarget. The motif for Hnf4, a zinc-finger nuclear hormone receptor expressed in fat bodies and in S2* cells, was also included (Barry and Thummel 2016). Although not comprehensive, with this set of 13 TF motifs, we found at least three binding sites of any TF motif in each of the IMD enhancers (Fig. 2A,C), indicating that this TF set has a role in the majority of the 2934 IMD enhancers.
Transcription factor (TF) binding content varies between immune enhancers. (A) Number of binding sites for each TF normalized by total length in base pairs of enhancers in each data set. Density is reported as the number of TFBS motifs per base pair. (B) Log of odds ratio of TFBSs in three comparisons. Enrichment is reported as the logarithm of the ratio of TFBS density in each of the two enhancer groups being compared. Positive enrichment values are in blue; negative enrichment values are in red. (*) P < 0.05, Fisher's exact test. (C) Activity score (log scale) from STARR-seq of IMD enhancers plotted by total binding sites. Individual enhancers are shown as dots, and medians and quartiles are displayed as box and whisker plots. The activity scores of enhancers in adjacent bins were compared by Mann–Whitney U test with Bonferroni correction. (*) P < 0.05. Nonsignificant comparisons are not shown. (D) Activity score (log scale) of IMD enhancers by number of Relish or Kay/Jra binding sites.
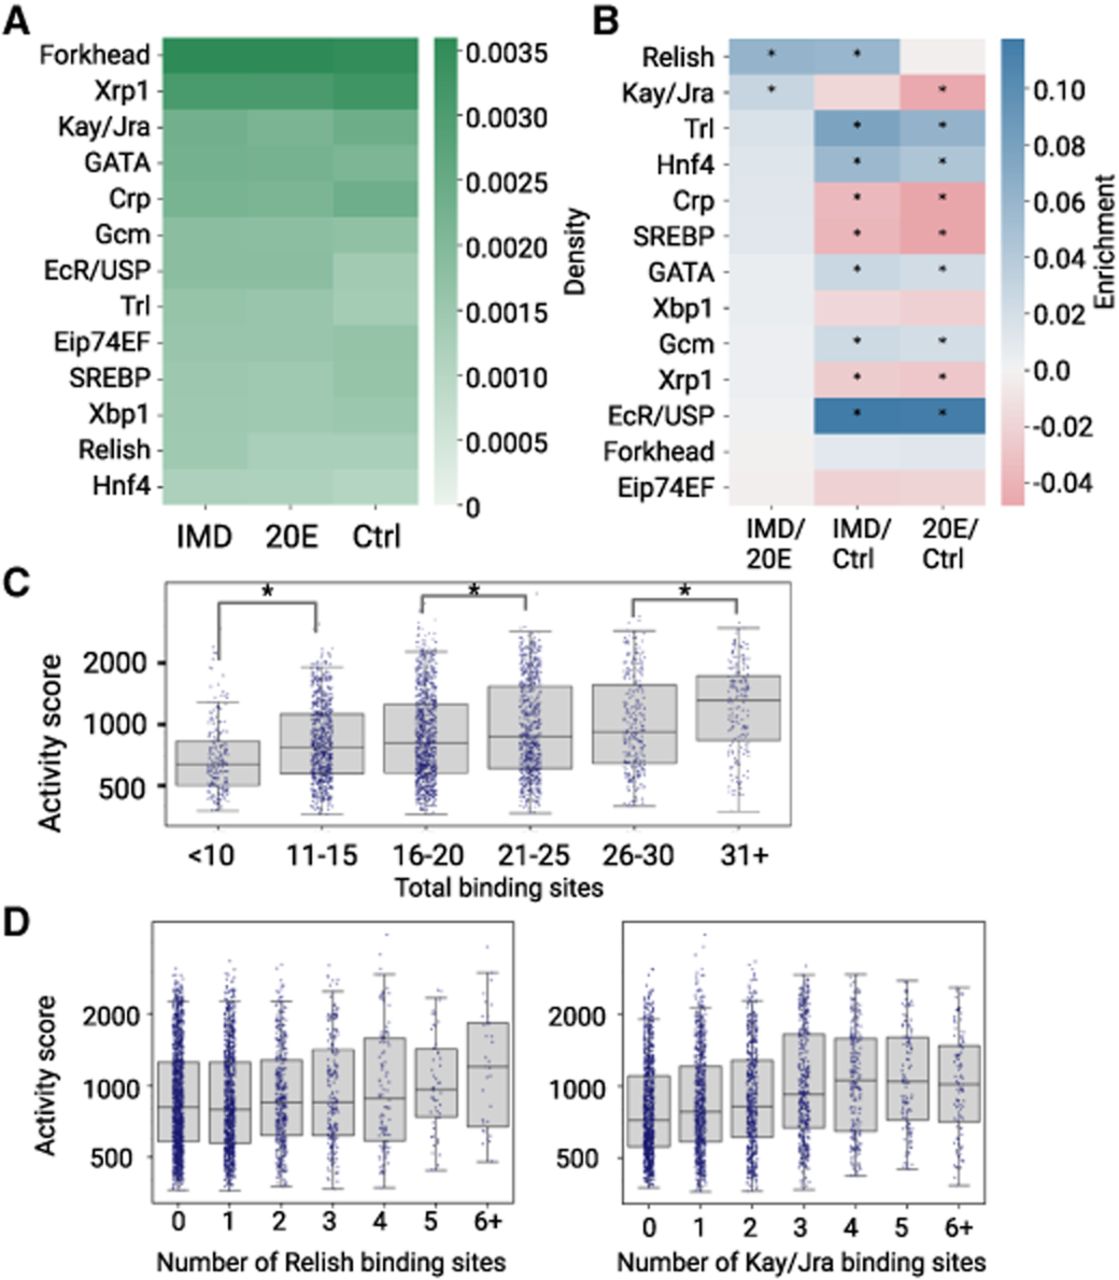
Because our set of IMD enhancers also includes those that are constitutively active or induced upon ecdysone addition, to identify TFs with specific immune roles, we compared the density of TFBSs between each treatment condition to calculate their enrichment (Fig. 2B). When comparing 20E to the control, we found the 20E enhancers are most significantly enriched for EcR/Usp sites (P < 0.05; Fisher's exact test) as expected, given the role of this complex in the ecdysone response. We also saw enrichment for Trl, Hnf4, GATA, and Gcm sites. In the IMD condition, we expected to find enhancers that are activated from both individual responses to 20E and bacteria, as well as synergistic interactions between the two stimuli. Accordingly, in the IMD versus control comparison, we found a significant enrichment in motifs for Relish, as well as the sites enriched in the 20E versus control comparison. To isolate the response solely to immunity, we compared IMD enhancers to 20E enhancers and found significant enrichments in motifs for Relish and Kay/Jra. In the comparisons to the control enhancers, motif depletion indicates that these sites are more common in enhancers active in the control condition. Below, we test the hypothesis that some of these TFs play a role in specific subsets of immune enhancers with distinct functions, rather than all IMD enhancers (Fig. 3).
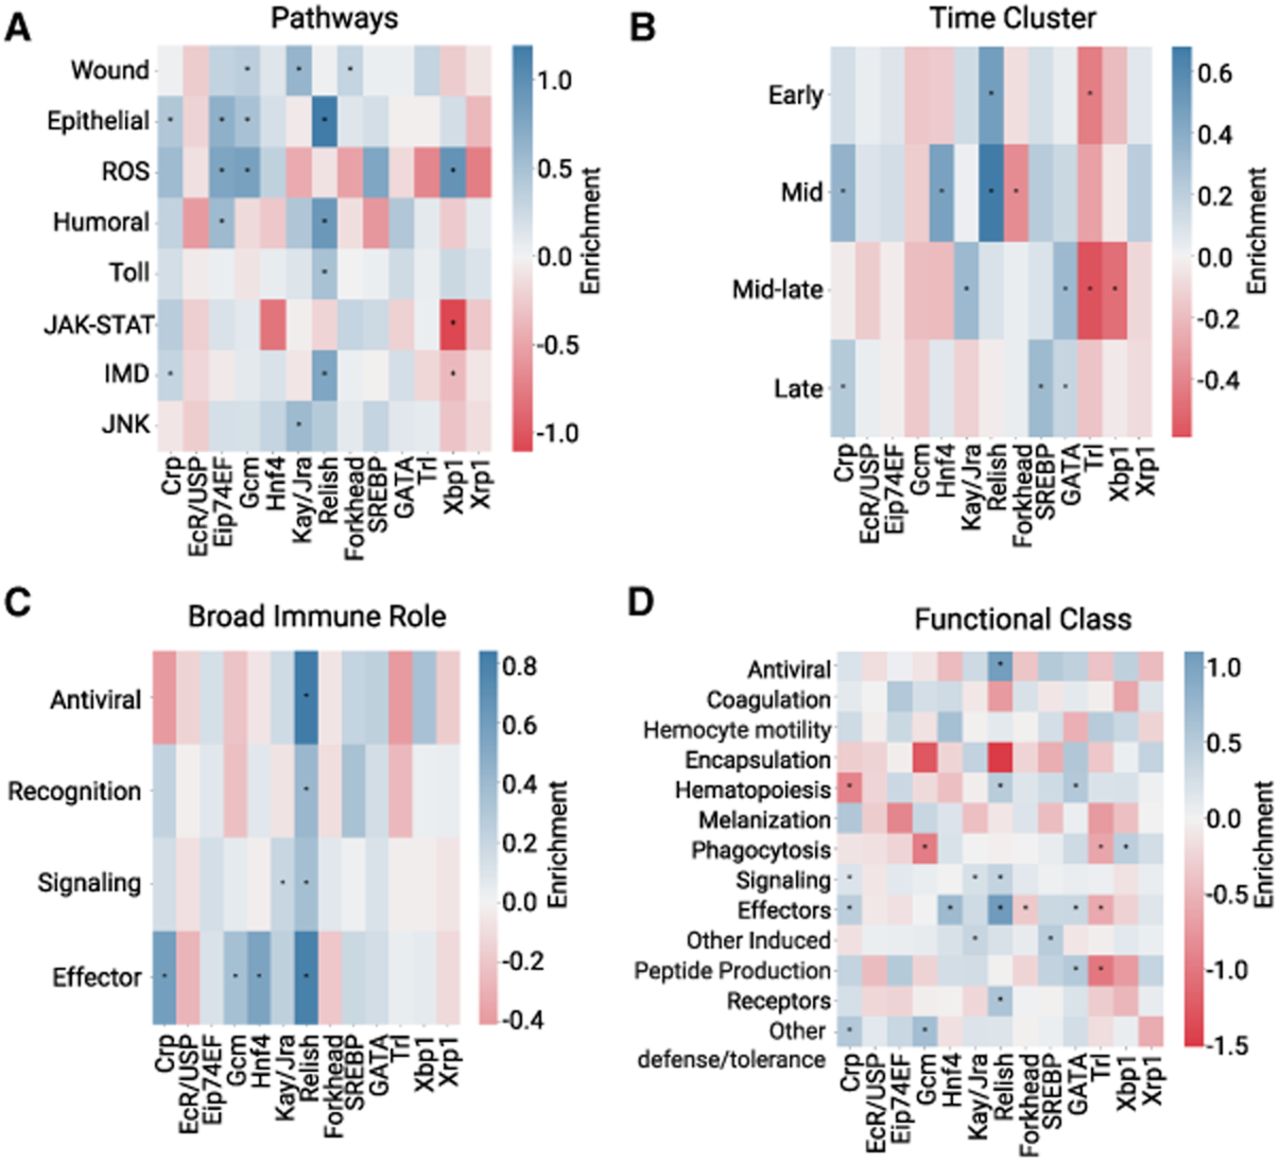
TFBS profiles of IMD enhancers vary according to pathways, timing, and function. Log odds ratio of TFBSs in IMD enhancers grouped by pathway and process (A) (Schlamp et al. 2021), time cluster (B) (Schlamp et al. 2021), broad immune role (C) (Schlamp et al. 2021), or functional group (D) (Westlake et al. 2024). Positive enrichment values are in blue, and negative enrichment values are in red. (*) P < 0.05, Fisher's exact test.
We hypothesized that if these 13 TFs are functionally regulating the IMD enhancers, we would observe a correlation between the number of TFBSs and the enhancer's activity. We observed that as the total number of TFBSs per enhancer increases, enhancer activity score generally increases, with statistically significant differences in activity scores for enhancers with less than 10 versus 11–15 TFBSs, 16–20 versus 21–25 TFBSs, and 26–30 versus 31+ TFBSs (P < 0.05, Mann–Whitney U test) (Fig. 2C; for 20E and control, see Supplemental Fig. S4A,B). The top two enriched motifs, Relish and Kay/Jra, show a general increase in activity score with more binding sites, although Kay/Jra plateaus around four TFBSs (Fig. 2D). For the other 11 TFs in IMD enhancers, the relationship between activity score and number of binding sites varies; some TFs show a positive relationship, whereas others have no correlation (Supplemental Fig. S4C). Overall, we found a modest correlation between the total number of binding sites and activity as shown in Figure 2C, suggesting a functional role for these TF motifs in enhancer activity.
Enhancer TF binding site content varies based on the function of the genes they regulate
We hypothesized that different sets of enhancers may be activated by distinct sets of TFs, depending on each set's function, pathway, or timing of expression. To allow for sufficient enhancer sample sizes for these gene subsets, we used all enhancers active in the IMD condition, including as enhancers that are also active in other conditions, and enhancer-centric gene assignments to link these enhancers to potential target genes (see Methods). We then used enrichment analysis to identify TFBSs that are more prevalent in enhancers associated with different gene sets.
First, we grouped enhancers by immune pathways based on their assigned genes (Schlamp et al. 2021). As expected, we saw Relish sites significantly enriched in Imd pathway–related enhancers, as well as significant Kay/Jra enrichment in enhancers associated with the JNK pathway and wound response. ROS-associated enhancers are enriched for Eip74EF, Gcm and Xbp1 motifs. Wound response enhancers are enriched for hemocyte-related TF binding sites: Gcm and Forkhead TFs. We also saw Relish enriched in Toll pathway–related enhancers, suggesting some interactions between the Toll and Imd pathways (Fig. 3A). The enrichment of TFBSs for Relish and Kay/Jra in their corresponding pathways demonstrates the utility of analyzing the IMD enhancer data set in smaller sets.
We next hypothesized that the enhancers that regulate genes induced at different times may rely on different TFBSs. Because transcripts produced from the STARR-seq plasmid are stabilized via a poly(A) tail, we collected transcripts from enhancers that were active at any point within the first 24 h of immune induction. Using the time course data from Schlamp et al. (2021), we labeled enhancers with different time clusters based on the expression of their assigned genes. We found that Relish sites are enriched in enhancers that regulate genes expressed at early to mid immune induction (0–16 h) (Fig. 3B). Late-expressing genes, 12–24 h, are enriched for bHLH sites, SREBP, and Crp, as well as GATA sites. SREBP is an activator of lipogenesis, typically triggered by low lipid levels, including during infection (Charroux and Royet 2022). Because Imd activation depletes lipid stores, its late activation may be in response to a metabolic shift. Therefore, this analysis reveals that there is distinct regulatory logic at different stages of the immune response, with early-acting enhancers regulated by the canonical Imd-responsive TF, Relish, and late-acting enhancers relying on bHLH activators, suggesting a mechanism for how genes are temporally regulated.
To determine if the role of a gene, regardless of pathway, affects how it is regulated, we investigated the composition of TFBSs using two sets of gene annotations. Using broad immune role annotations, for example, antiviral response (Dcr-2, AGO2), recognition (PGRP genes, GNBP genes), signaling (Relish, Dif, key), or effector (AMPs, Lysozyme genes, Bomanin genes) (Schlamp et al. 2021), we found effectors are controlled significantly by several TFs: Crp, Gcm, Hnf4, and Relish. The signaling and recognition stages of the immune response are also significantly controlled by Relish (Fig. 3C). We also used more detailed functional annotations from a comprehensive set of genes involved in the response to infection (Westlake et al. 2024). We saw several TFs enriched within functional groups. We found that Relish is the most highly enriched TF in enhancers assigned to effectors, followed by Hnf4 (Fig. 3D). Relish and GATA motifs are enriched among enhancers associated with hematopoiesis. Xbp1, a known component to the unfolded protein response (UPR) (Huang et al. 2017), is enriched in both reactive oxygen species (ROS) and phagocytosis-related enhancers. Overall, we find that our set of immune-induced enhancers encompasses many facets of the immune response, including timing, pathway, and gene function.
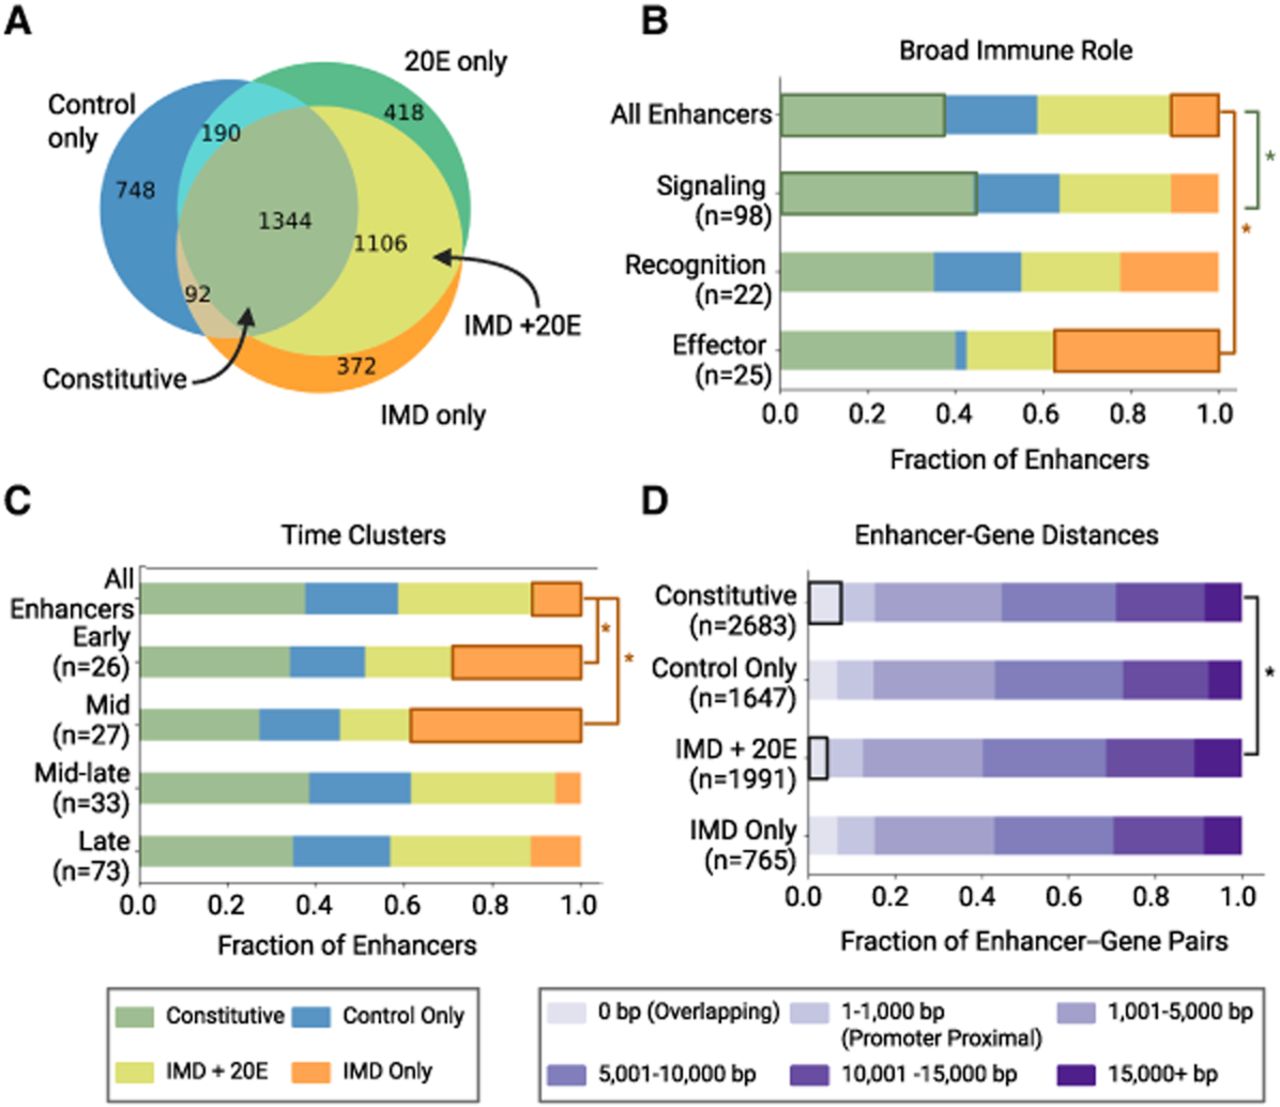
Enhancers can be further divided into activity classes
Up to this point, we have analyzed all the enhancers active in the IMD condition together, but some enhancers are active in the control and/or 20E conditions, whereas others are only active upon IMD stimulation. To discern between these types of enhancers, we defined seven activity classes: constitutive, control only, 20E only, IMD only, control + 20E, control + IMD, and IMD + 20E. We found that the constitutive enhancers comprised the largest activity class with 1344 enhancers; the second largest group was IMD + 20E enhancers with 1106 enhancers. Many enhancers are likely active in both the 20E and IMD conditions because both treatments include 20E, but we also found 372 enhancers that are active only in the IMD condition (Fig. 4A). We found relatively few enhancers active in the control + IMD and control + 20E groups, which is biologically sensible; because the 20E and IMD conditions share the 20E stimulus, we expect most enhancers active in the 20E condition to also be active in the IMD condition. To investigate the contributions of each TF in determining an enhancer's activity class, we trained two logistic regression models on either all or a subset of the enhancers and found a modest ability to discern between activity classes based on TF motif content (Supplemental Fig. S5). We saw Relish, Trl, and Kay/Jra binding sites contribute the most to IMD only enhancers, whereas EcR/Usp binding sites contribute most to enhancers active in both IMD and 20E conditions.
Activity classification of enhancers reveals specific properties of inducible and constitutive enhancers. (A) Venn diagram of enhancers showing activity in treatment conditions, defining activity classes. (B) Distribution of enhancer activity classes by broad immune role (Schlamp et al. 2021). There is a significantly higher fraction of IMD only enhancers in the effector group compared with all enhancers, whereas the signaling group has a higher fraction of constitutive enhancers compared with all enhancers. (*) P < 0.05, one-proportion z-tests. The number of genes in each immune role is listed in parentheses. (C) Distribution of enhancer activity classes by time cluster (Schlamp et al. 2021). The fraction of IMD only enhancers is significantly larger in the early and mid clusters compared with all enhancers. (*) P < 0.05, one-proportion z-tests. The number of genes in each time cluster is listed in parentheses. (D) Distributions of distances between enhancers and paired genes. Distance is measured from the closest edge of the enhancer to the transcriptional start site (TSS). For intronic enhancers, the distance will include the length of the introns and exons between the TSS and enhancer. The fraction of constitutive enhancers that overlap with their paired genes is significantly greater than the fraction of inducible IMD + 20E enhancers that overlap with genes. (*) P < 0.05, two-proportion z-test. The number of enhancer–gene pairs is listed in parentheses for each activity class.
Using these activity class assignments, we tested a proposed grammar between Relish and Serpent (GATA) sites in immune-responsive enhancers (Supplemental Fig. S5E). Previous work found that Relish and Serpent sites are often within 50 bp of each other and positioned in the same relative orientation in the promoter proximal regions of about 50 immune genes (Senger et al. 2004). We found that Relish and GATA sites are closer to each other in IMD only and IMD + 20E enhancers than in constitutive enhancers (P < 0.001, two-sided Mann–Whitney U test), and the density of Relish–GATA pairs is higher in IMD only enhancers compared with constitutive enhancers (Supplemental Fig. S5F,G). However, there was not a significantly higher proportion of Relish–GATA pairs in the same orientation in IMD only and IMD + 20E enhancers compared with constitutive enhancers (P = 0.156, two proportion z-test). Therefore, our data support the idea that closely spaced Relish–GATA pairs are associated with immune-responsiveness, but there was less support for the importance of the relative orientation of these sites.
Enhancers’ activity classes are associated with their target genes’ immune role
The assignment of enhancers to activity classes allowed us to make more refined gene–enhancer assignments based on RNA-seq data taken alongside the STARR-seq data. We matched enhancers in each activity class to genes by first identifying genes expressed in the conditions corresponding to the activity class. For example, for the constitutive class, we considered genes expressed in the control, 20E, and IMD conditions, whereas for the IMD only class, we considered genes expressed in the IMD condition, regardless of their expression in other conditions (see Methods) (Supplemental Fig. S6A). We did not restrict, for example, IMD only enhancers to genes only expressed in the IMD condition because it is possible that the gene is controlled by multiple enhancers with different activity (e.g., one IMD-inducible enhancer and a second constitutive enhancer) (Fig. 1F). We also do not restrict IMD only enhancers to genes differentially expressed in the IMD condition because it is possible that a gene is controlled by an IMD-inducible enhancer and another enhancer active only in the control condition. Using these expressed genes, we then made gene–enhancer assignments using the same 15 kb upstream/5 kb downstream windows as before. This approach filtered out 6832 gene–enhancer pairs with discordant expression-activity patterns and retained 8518 gene–enhancer assignments (Supplemental Fig. S6B,C). In addition to multiple enhancers assigned to a gene, we also found multiple genes assigned to a single enhancer (Supplemental Fig. S6D). There is an increasing number of examples in fly and mammalian genomes in which a single enhancer can control multiple genes, making these assignments reasonable (Mohrs et al. 2001; Levo et al. 2022). As an orthogonal check, we found genes differentially expressed between the conditions were assigned to enhancers in the appropriate activity class (Supplemental Fig. S6E). Therefore, we have confidence that filtering for genes based on expression yields a high-quality set of gene–enhancer assignments.
We hypothesized that genes with different roles in the immune system might be controlled by enhancers with different activity classes. We compared the enhancers controlling immune recognition, signaling, and effector genes (Fig. 4B) and found that effector genes had the largest proportion (38%) of IMD only enhancers, significantly more than the proportion of IMD only enhancers among all enhancers (P < 0.05, one proportion z-test). Signaling genes had the largest proportion of constitutive enhancers (44%), slightly larger than all enhancers, (P < 0.05, one proportion two-sample z-test), likely because these components have more consistent expression across conditions. We also compared the enhancer activity classes for genes sorted by their time of induction and found that genes induced in the early and mid time clusters have significantly more IMD only enhancers than genes induced later in the infection (Fig. 4C). Although the later time clusters include genes that are immune induced, they may be controlled by a larger proportion of constitutive enhancers for several reasons. For example, some genes may be activated by secondary signals (e.g., changes in metabolism) that have roles in other pathways. Other genes may be expressed in tissues not well modeled by the hemocyte-like S2* cells. This analysis indicates that, depending on their immune role or expression timing, specific gene groups are associated with different enhancer activity classes.
This analysis also allows us to investigate the distribution of enhancer–gene distances. We hypothesized that constitutive enhancers were more likely to overlap with the transcription start site (TSS) of their target genes, because distal enhancers are often found to be condition or tissue specific (Zabidi et al. 2015). Consistent with our hypothesis, constitutive enhancers overlapped with the TSS of their target genes (the 0 bp bin) somewhat more often than the inducible IMD + 20E enhancers (P < 0.05, two-sided z-test) (Fig. 4D). But overall, we saw little difference in the full distribution of gene–enhancer distances based on activity class, with >60% of enhancers within 10,000 bp of the TSS of their target gene and 90% of enhancers within 15,000 bp.
Individual enhancer reporters validate activity classes
To further validate the STARR-seq measurements, we tested the activity of 11 enhancer reporters (Fig. 5A). Enhancers are named for the gene with the closest TSS that is expressed in the same conditions as the enhancer (with the exception of Dso enhancer) (see Supplemental Fig. S7A). We chose nine immune-responsive enhancers from two groups: enhancers that aligned with previously identified immune enhancers and novel enhancers that were in the IMD only or IMD + 20E enhancer classes. We included one enhancer (CG9837) in the constitutive class. We introduced the reporters into S2* cells individually and measured each reporter's activity control, 20E, and IMD conditions using flow cytometry (Fig. 5B). As expected, the reporters for the PGRP-SD and Mtk enhancers, which closely match previously identified enhancers from Busse et al. (2007) and Senger et al. (2004), respectively, significantly upregulate GFP upon IMD stimulation compared with the control condition. Among the remaining seven reporters in the IMD only or IMD + 20E classes, six enhancers upregulate transcription upon IMD stimulation (CrebA, lectin-26Cb, RpS26, Lmpt, CG5758, Cog8), and one enhancer does not (Dso). The CG9837 enhancer reporter drives high activity in both the control and IMD conditions (Fig. 5D), validating that it is a strong constitutive enhancer, and the negative control (DSCP) drove low expression in both conditions, indicating that it is a minimal, weak promoter.
STARR-seq enhancer reporters demonstrate immune-specific expression. (A) Schematic of enhancer reporter plasmids, with GFP under control of STARR-seq enhancers and minimal promoter, DSCP. (B) Log2 (fold change) of GFP expression measured by flow cytometry normalized to control treatment of enhancer reporters and promoter-only (DSCP) negative control. Bars represent the mean, and dots show three biological replicates. Error bars represent SEM. Gray dashed line marks the expression level of DSCP control upon IMD stimulation. Significant gene induction is labeled with an asterisk, P < 0.05 (one-sided Mann–Whitney U test). (C) Log2 (fold change) of GFP expression normalized to control treatment of daisho enhancer reporter. Significant gene induction is labeled with an asterisk, P < 0.05 (one-sided Mann–Whitney U test). (D) Log2 of GFP expression levels for reporters comparing IMD treatment to control treatment. Both treatment conditions are normalized to untransfected S2* Torso-pelle cells. Dashed line is y = x, denoting an equal response to IMD and control treatment.
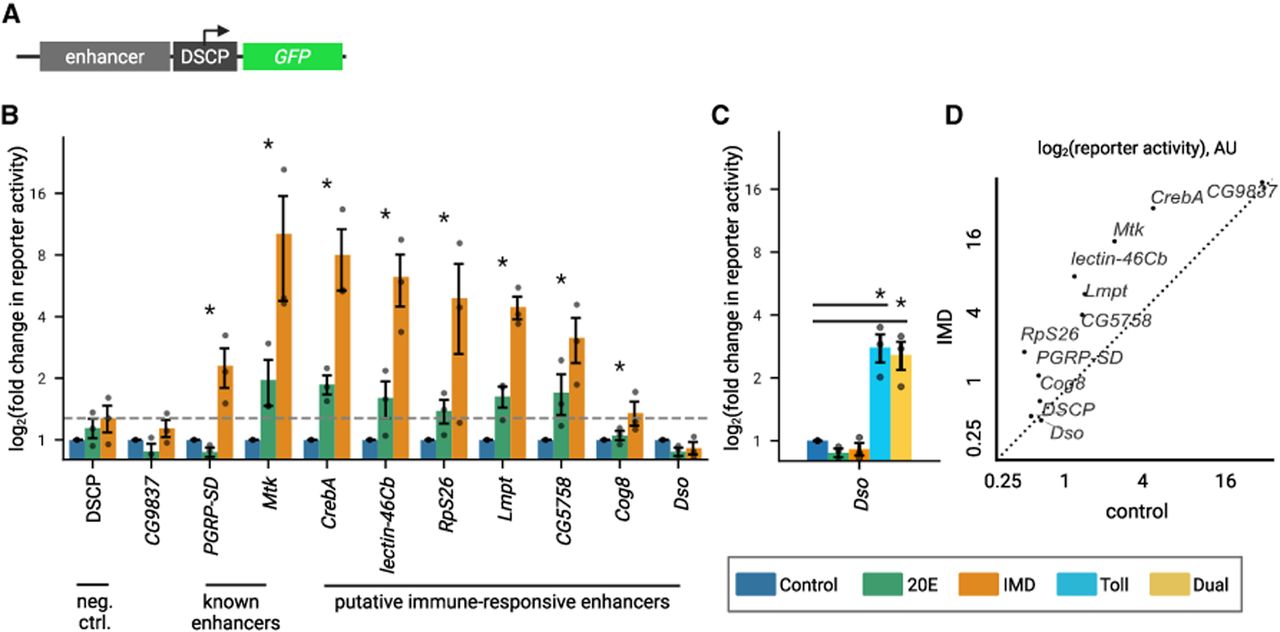
We were surprised to find an IMD-induced enhancer between Dso1 and Dso2 genes, because these genes are induced by the Toll pathway (Supplemental Fig. S7A; Levy et al. 2004; Cohen et al. 2020). The Dso enhancer activates expression in response to Toll stimulus, either on its own or when both the IMD and Toll pathways are induced in the dual condition (Fig. 5C), indicating this is a Toll-responsive enhancer. Five of the eight IMD-responsive enhancers, Mtk, CrebA, CG5758, lectin-46Cb, and RpS26, also respond to Toll and dual induction beyond the negative control (Supplemental Fig. S7B,C), indicating that some enhancers can respond to both the IMD and Toll pathways. Synthesizing the data across these experiments, we see several groups of enhancers—those that are only IMD-responsive (PGRP-SD, Lmpt, Cog8), those that are only Toll-responsive (Dso), those that are Toll- and IMD-responsive (Mtk, CrebA, CG5758, lectin-46Cb and RpS26), and those that are constitutive (CG9837)—and find that STARR-seq-identified enhancers generally recapitulate their activity in individual enhancer-reporter constructs.
Chromatin accessibility at most enhancers does not change upon immune stimulation
The STARR-seq assay identifies sequences that can drive expression in the cell type and conditions tested, independent of chromatin context. In a whole organism, both sequence information and chromatin structure determine an enhancer's ability to regulate gene expression. To compare STARR-seq enhancers to the chromatin state in the animal itself, we conducted ATAC-seq in hemocytes isolated from adult flies in either control or immune-stimulated conditions. To mimic the cell culture induction and avoid contaminating bacterial DNA in the ATAC-seq library, we performed the immune induction using HKSM and measured chromatin accessibility 24 h after treatment (Fig. 6A).
ATAC-seq reveals immune-inducible enhancers are made accessible by EcR/Usp, Hnf4, Trl, and Kay/Jra. (A) Diagram of ATAC-seq on immune-stimulated hemocytes. Flies are injected with HKSM and, along with age-matched controls, are incubated for 24 h at 25°C. Then flies are anesthetized; hemocytes are extracted via centrifugation before lysis and transposition. Tn5 was used to insert adaptors into accessible chromatin. These fragments are then isolated and sequenced to identify accessible peaks. (B) Venn diagram of accessibility groups of enhancers. Always-closed enhancers are in blue and are inaccessible in both the control and HKSM samples. The left circle is enhancers open in the control sample (Always-open and HKSM-closed), and the right circle is enhancers open in the HKSM sample (Always-open and HKSM-opened). The intersection has enhancers open in both. The number of enhancers in each group is listed in parentheses. (C) Fraction of enhancers in each accessibility group by activity class. Constitutively active enhancers are more likely to be always open than immune-responsive enhancers. (***) P < 0.005, z-test, Bonferroni multiple test correction. Inset of the same data for HKSM-opened enhancers, plotted separately for clarity. A greater proportion of IMD + 20E enhancers are HKSM-opened than are constitutive enhancers. (*) P < 0.1, two sample z-test. (D) Fraction of enhancers in accessibility groups grouped by broad immune roles (left) and time clusters (right). (**) P < 0.05, z-test, Bonferroni multiple test correction; (***) P < 0.005, z-test, Bonferroni multiple test correction. (E) Log odds ratio of TFBSs in enhancers by accessibility compared with all enhancers, for previously identified motifs. Positive enrichment values are in blue, and negative enrichment values are in red. (*) P < 0.05, Fisher's exact test.
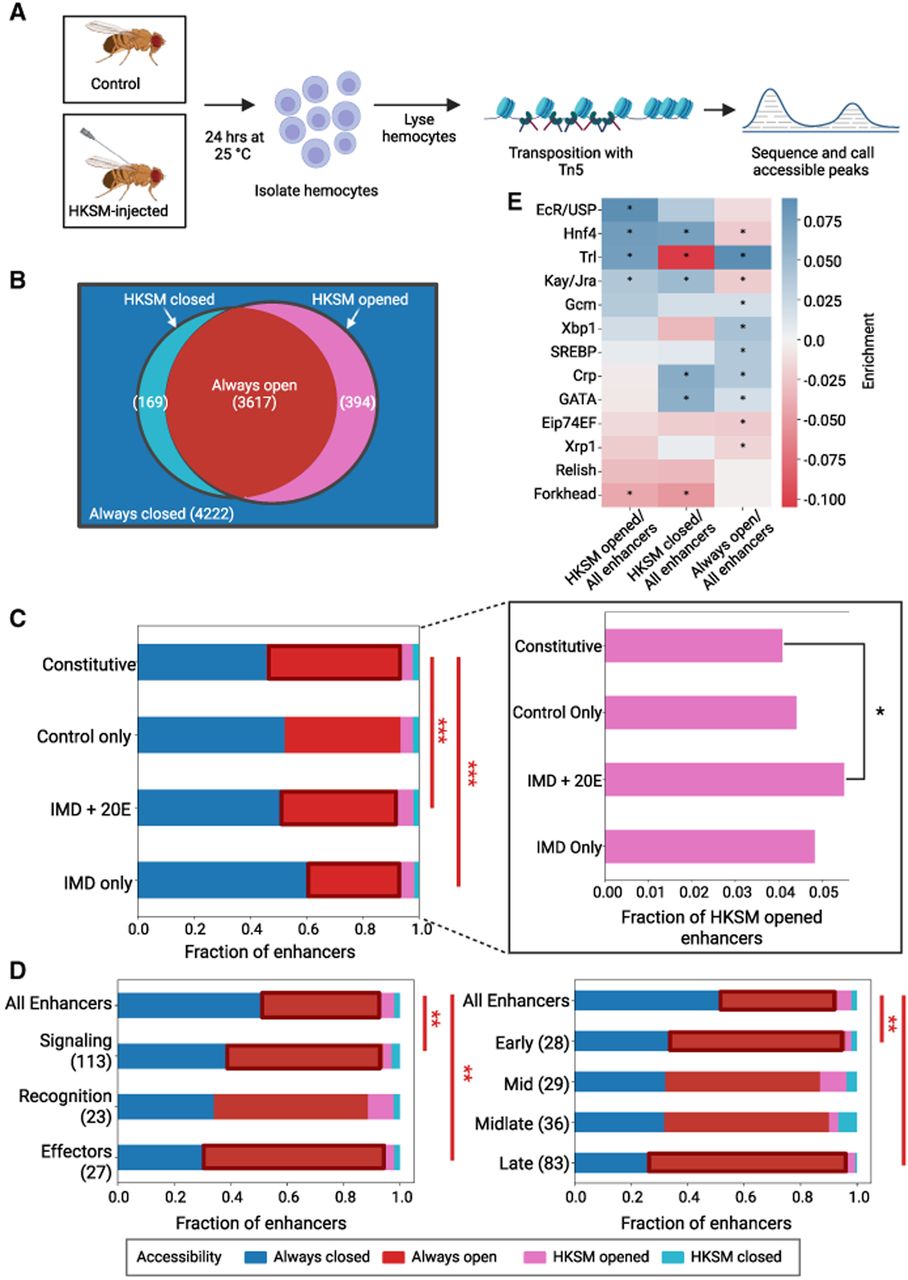
In the original STARR-seq paper, roughly half of the enhancers were found to be accessible in the genome of the same S2 cell line used for the assay (Arnold et al. 2013). Here, we compared STARR-seq enhancers to the equivalent cell type in intact animals and therefore expected that the overlap between enhancers and open chromatin might be slightly lower. However, we found that half (49.8%) of all STARR-seq-identified enhancers are in regions that are accessible in either or both conditions in hemocytes (Supplemental Fig. S8A). We then divided enhancers into accessibility groups: those that are open in both control and stimulated conditions (always-open), those closed in both conditions (always-closed), those opened by HKSM stimulus, or those closed by HKSM stimulus. More than >90% of enhancers maintain their chromatin structure for the duration of the experiment, either remaining open or closed (Fig. 6B). In enhancers grouped by activity class, we found that constitutive enhancers are more likely to be always open than in IMD only and IMD + 20E enhancers P < 0.002, z-test, Bonferroni multiple test correction) (Fig. 6C). The fraction of enhancers opened by HKSM is marginally higher in the IMD + 20E enhancers than in constitutive enhancers (P = 0.099, z-test). Similarly, when enhancers are grouped by treatment, there is a slight increase in HKSM-opened enhancers in 20E enhancers versus control (P = 0.055, z-test) (Supplemental Fig. S8A). We next asked whether the chromatin state of enhancers differed by the immune role of the associate target genes. Enhancers assigned to effectors or signaling components have a larger proportion of enhancers that are always in open chromatin compared to all enhancers (P < 0.01, z-test, Bonferroni multiple test correction) (Fig. 6D). Enhancers assigned to early- and late-expressing immune genes also have a higher likelihood of always lying in open chromatin (P < 0.05, P < 0.001, z-test, Bonferroni multiple test correction). In general, we find that, regardless of activity class, enhancers assigned to immune genes tend to be in open chromatin regions more than all enhancers. Overall, the chromatin state of most enhancers identified via STARR-seq is unchanged in the 24 h after treatment with HKSM.
To understand what determines the accessibility of different groups of enhancers, we measured the density of the 13 TF motifs previously selected (Fig. 2) in each accessibility group. We found that compared with all enhancers, enhancers that are opened upon HKSM treatment are enriched for EcR/Usp, Hnf4, Trl, and Kay/Jra TFBSs (Fig. 6E). Trl, a pioneer TF known to open closed chromatin (Chetverina et al. 2021), is strongly enriched in HKSM-opened and always-open enhancers and strongly depleted in HKSM-closed enhancers. EcR/Usp was found to be significantly enriched in the HKSM-opened enhancers, but not in any other accessibility group. Previous work has identified Hnf4 as a key regulator of metabolism and lipid storage in development (Barry and Thummel 2016; Storelli et al. 2019). Here we saw its binding sites enriched in enhancers that either opened or closed upon immune stimulation, possibly indicating that Hnf4 is performing its metabolic switch role in reaction to infection. Relish is not enriched in any accessibility group, indicating that its role is primarily activating transcription without influencing chromatin state. We looked for additional motifs enriched in the accessibility groups through i-cisTarget and found motifs for CrebA, an immune TF (Troha et al. 2018), and a putative zinc finger TF differentially enriched between the accessibility groups (Supplemental Fig. S8B). In sum, we see that TFBS content is correlated with accessibility of enhancers and that Trl and EcR/Usp may play a role in opening chromatin for enhancers in response to immune stimulation.
Discussion
In this study, we have identified immune responsive enhancers across the entire Drosophila genome. Immune enhancers are enriched in motifs for Relish and Kay/Jra, the terminal TFs of the Imd and JNK pathways, respectively. We also find that distinct classes of immune enhancers differ by their TFBS composition and activity class. Although most enhancers’ accessibility does not change upon infection in hemocytes, enhancers that are opened upon immune stimulation may be controlled by ecdysone signaling with an enrichment of EcR/Usp binding sites.
As was expected, Relish is the most enriched TF in immune-responsive enhancers, because the Imd pathway culminates in its activation. Here, we determine that Relish is a general activator of all Imd enhancers but is preferentially found in the immune-specific enhancers of early-response genes and effectors. The Imd pathway activates the JNK pathway, and concordantly, we find Kay/Jra binding sites enriched in immune enhancers and particularly in late-acting enhancers (Tafesh-Edwards and Eleftherianos 2020).
The major pathways controlling the humoral immune response, Toll and Imd, are each activated by different microbes, but there has been evidence of interactions between the pathways. For example, wounding and damage associated signals activate both immune pathways (Troha et al. 2018; Schlamp et al. 2021). Heterodimers between Relish and Dif, an NF-kB protein downstream from Toll, can form and activate transcription (Tanji et al. 2007, 2010; Morris et al. 2016). Also, certain genes like Mtk, Drs, and CrebA can be activated by both Toll and Imd (De Gregorio et al. 2002; Busse et al. 2007; Valanne et al. 2010; Troha et al. 2018). Consistent with this observation, we see that both Imd and Toll activate the enhancers for Mtk and CrebA, but there is no evidence of synergistic enhancer activity when both stimuli are present (Supplemental Fig. S7B). Regulation by both pathways could be encoded in enhancers in multiple ways. The enhancers could contain distinct binding sites for Relish and Dif, common sites that can be bound by Relish or Dif, or sites that can be bound by Relish–Dif heterodimers. A previously studied Mtk enhancer has Relish-specific sites and a common site that binds both Dif and Relish (Busse et al. 2007). We also identified one Dif-specific site in our expanded Mtk STARR-seq enhancer. In addition to three Relish-specific sites, the CrebA enhancer contains a “GGGAATTCT” site, which closely resembles a common NF-kB site, and a “GGGAACCACT” site, a 1 bp mismatch with the Relish–Dif heterodimer site (Tanji et al. 2007, 2010). Relish's enrichment among the enhancers of Toll pathway components (Fig. 3A) suggests that other immune enhancers integrate signals from multiple pathways. Overall, we find additional evidence that some immune enhancers can be activated by both Toll and Imd pathways via distinct Relish and Dif sites, common binding sites, and heterodimer sites.
Beyond the roles for Relish and Kay/Jra, we find the patterns of motif enrichment for Xbp1, Trl, Crp, SREBP, and Hnf4. Xbp1 is enriched in enhancers associated with ROS and phagocytosis. Upon infection, a biphasic ROS response stimulates hemocytes to differentiate (Myers et al 2018). Perhaps, an increase in secreted peptides during an immune response activates the UPR and Xbp1 could in turn regulate the ROS and phagocytic pathways. Trl motifs were not enriched in enhancers associated with any gene classes based on immune function or immune expression timing (Fig. 3) but were enriched in both always-open and HKSM-opened enhancers in hemocytes (Fig. 6E). This suggests that Trl's role in the immune response is remodeling the chromatin landscape, consistent with its role in development (Gaskill et al. 2021). Crp, a known antiapoptosis factor (Sopko et al. 2015; Atkins et al. 2016), could function to maintain the hemocyte population upon infection, with motifs enriched in mid- and late-expressed immune genes and among enhancers associated with effector and signaling genes. Both Hnf4 and SREBP have roles in regulating lipid biosynthesis and metabolism, and SREBP is downregulated in Hnf4 mutants, suggesting a link between these genes (Vonolfen et al. 2024). There is evidence that these TFs are differentially regulated during infection or inflammation from studies that focus on different cell types (Charroux and Royet 2022). Given the large metabolic impact of the immune response (Bland 2023), further studies into the activity of these TFs in different tissues and stages of infection may reveal how expression is regulated after the immediate response driven by canonical immune-responsive TFs.
Our data emphasize the significant role of the hormone ecdysone in modulating the transcriptional immune response. Ecdysone is the master regulator of Drosophila developmental transitions, but it is also required for the Imd response in both cells and whole animals (Meister and Richards 1996; Rus et al. 2013). Ecdysone induces the expression of the peptidoglycan receptor PGRP-LC, increasing the responsiveness of cells to Gram-negative bacteria. We find that just under half (45.3%) of IMD + 20E enhancers contain both EcR/Usp and Relish motifs. The co-occurrence of Relish and EcR/Usp sites suggests that ecdysone also has a role in activating Relish-dependent immune enhancers. Additionally, chromatin accessibility changes in hemocytes from adult flies upon immune stimulus reveal that EcR/Usp is highly enriched in enhancers opened by HKSM. EcR/Usp recruits TRR and the MLR COMPASS complex, which monomethylates H3K4, priming enhancers for an immune response (Zraly et al. 2020). Therefore, we find that ecdysone and EcR/Usp are crucial regulators of transcriptional immune response, likely by increasing both enhancer activation and chromatin accessibility.
Our in vivo ATAC-seq experiments in hemocytes revealed that ∼90% of enhancers do not qualitatively change their accessibility status during the course of the experiment, whereas the remaining ∼10% change. Although there may be quantitative changes in accessibility, these changes do not necessarily correlate with expression (Merrill et al. 2022). This relatively stable chromatin profile is in line with the model that the majority of enhancers available to a cell type acquire their enhancer histone marks (e.g., H3K4me1) and accessibility during lineage specification, whereas a subset, the so-called “latent enhancers,” acquire these marks and accessibility after a stimulus. In human macrophages, ∼15% of enhancers are latent and only gain enhancer histone marks upon stimulus (Ostuni et al. 2013). We suggest our HKSM-opened enhancers are also latent enhancers (Fig. 6B).
Although we identified hundreds of immune-responsive enhancers and distinct patterns of TF motif enrichment within them, there are some limitations to this study. Although powerful, STARR-seq may yield both false positives (e.g., because there is a the lack of chromatin context for the reporter plasmids and because electroporation may trigger cellular responses) and false negatives (e.g., owing to limited reporter size or promoter choice). In our study, nine of 10 individual enhancers reporter measurements aligned with their high-throughput STARR-seq results. We found one false positive: The Dso enhancer appeared as a IMD + 20E enhancer in the STARR-seq data, but the individual reporter was not responsive to Toll but not IMD induction. We also find evidence of false negatives: Previously described IMD-responsive enhancers upstream of Dpt, CecA, PGRP-SB1, and AttA are not part of the STARR-seq data (Uvell and Engström 2003; Senger et al. 2004; Busse et al. 2007). The lack of signal in these regions could be owing to differences in induction protocols or STARR-seq limitations. Lastly, TFBS analysis was based on 13 selected motifs. The accuracy of TF assignments depends on the quality of the motif, and we sometimes cannot distinguish between the binding of closely related TF paralogs. Furthermore, enhancers are likely regulated by other TFs, including those with poor or missing motifs.
The diverse array of enhancers characterized in this study reflects the demands of an innate immune system. In animals without an adaptive immune system, the innate transcriptional response must encompass everything needed to defend against invading pathogens, while balancing a limited metabolic budget and maintaining housekeeping functions. Identification of immune enhancers across both the expanse of the genome and the functional roles of the immune system adds to our understanding of how the immune response is controlled and the multiple types of enhancers involved.
Methods
Genome-wide reporter library construction
To generate a genome-wide reporter library, genomic DNA was isolated from both male and female iso-1 flies, fragmented via sonication, and size-selected (500–750 bp). To prepare and clone these fragments into the pSTARR-seq fly plasmid (AddGene 71499), we used the protocol outlined by Neumayr et al. (2019) (Supplemental Methods).
STARR-seq in S2* cells
To test the genomic library's enhancer activity, we performed STARR-seq in S2* cells. S2* cells were a gift from Steven Wasserman and grown according to standard methods in complete Schneider's media at 28°C. For a three-condition experiment, 2.8 × 10⁹ S2* cells were electroporated with the STARR-seq library (see Supplemental Methods). Cells were split into three treatment groups, control, 20E and IMD, and treated with either water (control) or a final concentration of 40 nM 20E (Sigma-Aldrich; 20E and IMD) for 24 h and then PBS (control and 20E) or HKSM at a final concentration of 0.4 OD (IMD) for 24 h. RNA extraction and library preparation were completed as in the work of Neumayr et al. (2019). Paired-end Illumina sequencing was performed for three biological replicates and input library.
Alongside the STARR-seq replicates, RNA-seq samples were created in triplicate. Untransfected S2* cells were treated identically to STARR-seq samples. Total RNA was sent to Genewiz for poly(A) mRNA selection and library preparation.
Computational analysis
Identifying STARR-seq peaks
STARR-seq reads were aligned to the dm6 genome using Bowtie 2 and SAMtools (Langmead and Salzberg 2012; Danecek et al. 2021). deepTools was used to convert alignment files to bigWig coverage tracks (Ramírez et al. 2016). STARRPeaker was used to call peaks (P-value threshold < 0.05) (Lee et al. 2020). Each peak's activity score is [100 × (output/normalized-input)], in which output is the number of reads in the peak, and normalized-input is the coverage of the peak in the input library. Enhancers can be larger than the maximum library fragment size (750 bp) because STARRpeaker identifies peaks that may come from multiple overlapping fragments. We built consensus peaks of the replicates in each treatment group. If a peak was in at least two of three replicates (with at least 1 bp overlap), the consensus enhancer was defined as the union of the peaks that occurs at that location and assigned the average activity score from the peaks that contribute to them.
Because many enhancers appear across multiple treatment conditions, we defined seven activity classes: constitutive (control, 20E, IMD), control only, 20E only, IMD only, IMD and 20E, 20E and control, and IMD and control. Enhancers were merged via a union operation across conditions if they overlapped by at least 60%.
RNA-seq analysis
RNA-seq reads were aligned with Bowtie 2, and counts were generated with Subread's featureCounts (Langmead and Salzberg 2012; Liao et al. 2014). To identify any outliers, principal component analysis (PCA) was completed. Sample 1, a control sample, was determined to be an outlier and removed, leaving two control samples, three 20E samples, and three IMD samples.
TF assignments
To identify TFBSs within all the IMD enhancers and within time-specific sets of IMD enhancers, we used i-cisTarget (version 6.0) to find motifs with a normalized enrichment score above 3.0 (Imrichová et al. 2015). Motifs were grouped into motif trees using the R Bioconductor package universalmotif (Tremblay 2024). TFBSs were identified on both DNA strands with the FIMO tool of the MEME suite using P-value < 10−3 (Grant et al. 2011).
Gene assignments
Gene centric enhancer assignments (used in Fig. 1) were made by scanning 15 kb upstream of and 5 kb downstream from a gene and assigning any enhancer in this window to the gene, as in the method of Arnold et al. (2013). Because enhancers function independent of orientation, enhancer-centric assignments (Fig. 3) were made by scanning 15 kb upstream of to 15 kb downstream from an enhancer and assigning any genes in this window to the enhancer. More restrictive enhancer–gene assignments were made by sorting genes into activity classes based on expression in the RNA-seq data (expression threshold: TPM > 1). For each activity class, genes were matched to the allowed set of enhancers by scanning 15 kb upstream of and 5 kb downstream from the gene (Supplemental Methods).
Construction and flow cytometry of enhancer reporters
Enhancers were amplified from iso-1 flies and cloned upstream of the DSCP (Pfeiffer et al. 2008; Arnold et al. 2013) driving EGFP with the origin of replication and AmpR gene from pAc5.1/V5-His-A (Invitrogen). For regions cloned, see Supplemental Table 1, and for additional details, see Supplemental Methods.
To allow for Toll stimulation, plasmids were electroporated into S2* cells stably transfected with pMT-Torso-pelle, which contains Pelle, a Toll pathway component fused to the transmembrane domain of Torso and under control of the CuSO4-activated metallothionein promoter (Galindo et al. 1995; Silverman et al. 2000). Cells were split in five treatment conditions: control, 20E, IMD-induced, Toll-induced, or Toll- and IMD-induced (dual) (Supplemental Methods).
ATAC-seq with adult fly hemocytes
We injected 60–70 2–7 day old male OregonR flies with ∼50 nL of HKSM at OD = 0.5 in PBS and incubated them for 24 h at 25°C, alongside uninjected age-matched controls. To quickly extract hemocytes to ensure ATAC-seq data quality, centrifugation was used (Cabrera et al. 2023; Jones and Eleftherianos 2023). Hemolymph including hemocytes was collected by placing 20–25 anesthetized flies in 0.5 mL tubes with three 20 gauge needle holes at the bottom and then covered with glass beads. Flies were spun at 6000g for 1 min at 4°C into ATAC-seq lysis buffer (Grandi et al. 2022). Tagmentation and library prep protocols were adapted from the work of Grandi et al. (2022; see Supplemental Methods). Paired-end Illumina sequencing was completed on three biological replicates per condition.
ATAC-seq data analysis
ATAC-seq reads were trimmed using cutadapt (Martin 2011), aligned with Bowtie 2 (Langmead and Salzberg 2012). Peaks were called using MACS2 (Zhang et al. 2008), using narrow peak calling and a P-value of 0.01. Consensus ATAC-seq peaks were built from the widest margins of peaks present in at least two replicates. STARR-seq enhancers were labeled open if >50 bp of enhancer was in consensus ATAC-seq peaks.
Data access
All raw and processed sequencing data generated in this study have been submitted to the NCBI Gene Expression Omnibus (GEO; https://www.ncbi.nlm.nih.gov/geo/) under accession number GSE308695. A database of the enhancers identified in this study can be accessed at the Drosophila Immune Enhancer Atlas (http://fly-immune-enhancers.wunderlichlab.org/).
Competing interest statement
The authors declare no competing interests.
Acknowledgments
We thank Benedetta D'Elia for help in developing the ATAC-seq protocol and Ila Rosen for help in preliminary plasmid construction. We thank Alexander Stark, Cosmas Arnold, Bernardo de Almeida, and Rui Catarino for helpful advice on the STARR-seq protocol. We thank Steven Wasserman for the S2* cells. This work was funded by National Science Foundation (Directorate for Biological Sciences) awards 2223888 and 1953324 (to Z.W.). T.H. was supported by National Institutes of Health (National Institute of General Medical Sciences) award T32GM150533, and C.S. was supported by Boston University's Undergraduate Research Opportunities Program and the Boston University STEM Pathways Program (Department of Defense DoD STEM FY20 award HQ00342110008). The content is solely the responsibility of the authors and does not necessarily represent the official views of any of the funders. Figures created with BioRender (https://www.biorender.com/).
Author contributions: L.B.C. and Z.W. conceived the project and wrote the paper. L.B.C. performed the experiments and analyzed the data except for the following: T.H. developed activity classes and the expression filtered gene assignment; C.S. created and tested the enhancer reporters; and J.R.G. analyzed ATAC-seq data. L.B.C. and Z.W. supervised all experiments and analysis. Z.W. obtained funding for the project. All authors have read, edited, and approved the final manuscript.
Notes
[1] Supplementary material [Supplemental material is available for this article.]
[2] Article published online before print. Article, supplemental material, and publication date are at https://www.genome.org/cgi/doi/10.1101/gr.281432.125.
[3] Freely available online through the Genome Research Open Access option.
References
- ↵Arnold CD, Gerlach D, Stelzer C, Boryń ŁM, Rath M, Stark A. 2013. Genome-wide quantitative enhancer activity maps identified by STARR-seq. Science 339: 1074–1077. 10.1126/science.1232542
- ↵Atkins M, Potier D, Romanelli L, Jacobs J, Mach J, Hamaratoglu F, Aerts S, Halder G. 2016. An ectopic network of transcription factors regulated by hippo signaling drives growth and invasion of a malignant tumor model. Curr Biol 26: 2101–2113. 10.1016/j.cub.2016.06.035
- ↵Barry WE, Thummel CS. 2016. The Drosophila HNF4 nuclear receptor promotes glucose-stimulated insulin secretion and mitochondrial function in adults. eLife 5: e11183. 10.7554/eLife.11183
- ↵Bazzi W, Cattenoz PB, Delaporte C, Dasari V, Sakr R, Yuasa Y, Giangrande A. 2018. Embryonic hematopoiesis modulates the inflammatory response and larval Hematopoiesis in Drosophila. eLife 7: e34890. 10.7554/eLife.34890
- ↵Bland ML. 2023. Regulating metabolism to shape immune function: lessons from Drosophila. Semin Cell Dev Biol 138: 128–141. 10.1016/j.semcdb.2022.04.002
- ↵Bond D, Foley E. 2009. A quantitative RNAi screen for JNK modifiers identifies Pvr as a novel regulator of Drosophila immune signaling. PLoS Pathog 5: e1000655. 10.1371/journal.ppat.1000655
- ↵Brun S, Vidal S, Spellman P, Takahashi K, Tricoire H, Lemaitre B. 2006. The MAPKKK Mekk1 regulates the expression of Turandot stress genes in response to septic injury in Drosophila. Genes Cells 11: 397–407. 10.1111/j.1365-2443.2006.00953.x
- ↵Buchon N, Silverman N, Cherry S. 2014. Immunity in Drosophila melanogaster—from microbial recognition to whole-organism physiology. Nat Rev Immunol 14: 796–810. 10.1038/nri3763
- ↵Busse MS, Arnold CP, Towb P, Katrivesis J, Wasserman SA. 2007. A κB sequence code for pathway-specific innate immune responses. EMBO J 26: 3826–3835. 10.1038/sj.emboj.7601798
- ↵Cabrera K, Hoard DS, Gibson O, Martinez DI, Wunderlich Z. 2023. Drosophila immune priming to Enterococcus faecalis relies on immune tolerance rather than resistance. PLoS Pathog 19: e1011567. 10.1371/journal.ppat.1011567
- ↵Charroux B, Royet J. 2022. Gut-derived peptidoglycan remotely inhibits bacteria dependent activation of SREBP by Drosophila adipocytes. PLoS Genet 18: e1010098. 10.1371/journal.pgen.1010098
- ↵Cherbas L, Willingham A, Zhang D, Yang L, Zou Y, Eads BD, Carlson JW, Landolin JM, Kapranov P, Dumais J, 2011. The transcriptional diversity of 25 Drosophila cell lines. Genome Res 21: 301–314. 10.1101/gr.112961.110
- ↵Chetverina D, Erokhin M, Schedl P. 2021. GAGA factor: a multifunctional pioneering chromatin protein. Cell Mol Life Sci 78: 4125–4141. 10.1007/s00018-021-03776-z
- ↵Cohen LB, Lindsay SA, Xu Y, Lin SJH, Wasserman SA. 2020. The Daisho peptides mediate Drosophila defense against a subset of filamentous fungi. Front Immunol 11: 9. 10.3389/fimmu.2020.00009
- ↵Danecek P, Bonfield JK, Liddle J, Marshall J, Ohan V, Pollard MO, Whitwham A, Keane T, McCarthy SA, Davies RM, 2021. Twelve years of SAMtools and BCFtools. GigaScience 10: giab008. 10.1093/gigascience/giab008
- ↵De Gregorio E, Spellman PT, Rubin GM, Lemaitre B. 2001. Genome-wide analysis of the Drosophila immune response by using oligonucleotide microarrays. Proc Natl Acad Sci 98: 12590–12595. 10.1073/pnas.221458698
- ↵De Gregorio E, Spellman PT, Tzou P, Rubin GM, Lemaitre B. 2002. The Toll and Imd pathways are the major regulators of the immune response in Drosophila. EMBO J 21: 2568–2579. 10.1093/emboj/21.11.2568
- ↵Dushay MS, Eldon ED. 1998. Drosophila immune responses as models for human immunity. Am J Hum Genet 62: 10–14. 10.1086/301694
- ↵Galindo RL, Edwards DN, Gillespie SKH, Wasserman SA. 1995. Interaction of the pelle kinase with the membrane-associated protein tube is required for transduction of the dorsoventral signal in Drosophila embryos. Development 121: 2209–2218. 10.1242/dev.121.7.2209
- ↵Gaskill MM, Gibson TJ, Larson ED, Harrison MM. 2021. GAF is essential for zygotic genome activation and chromatin accessibility in the early Drosophila embryo. eLife 10: e66668. 10.7554/eLife.66668
- ↵Grandi FC, Modi H, Kampman L, Corces MR. 2022. Chromatin accessibility profiling by ATAC-seq. Nat Protoc 17: 1518–1552. 10.1038/s41596-022-00692-9
- ↵Grant CE, Bailey TL, Noble WS. 2011. FIMO: scanning for occurrences of a given motif. Bioinformatics 27: 1017–1018. 10.1093/bioinformatics/btr064
- ↵Hao Y, Yu S, Luo F, Jin LH. 2018. Jumu is required for circulating hemocyte differentiation and phagocytosis in Drosophila. Cell Commun Signal 16: 95. 10.1186/s12964-018-0305-3
- ↵Huang HW, Zeng X, Rhim T, Ron D, Ryoo HD. 2017. The requirement of IRE1 and XBP1 in resolving physiological stress during Drosophila development. J Cell Sci 130: 3040–3049. 10.1242/jcs.203612
- ↵Imrichová H, Hulselmans G, Atak ZK, Potier D, Aerts S. 2015. i-cisTarget 2015 update: generalized cis-regulatory enrichment analysis in human, mouse and fly. Nucleic Acids Res 43: W57–W64. 10.1093/nar/gkv395
- ↵Jones K, Eleftherianos I. 2023. A simple protocol for isolating hemolymph from single Drosophila melanogaster adult flies. Methods Protoc 6: 100. 10.3390/mps6050100
- ↵Kvon EZ, Kazmar T, Stampfel G, Yáñez-Cuna JO, Pagani M, Schernhuber K, Dickson BJ, Stark A. 2014. Genome-scale functional characterization of Drosophila developmental enhancers in vivo. Nature 512: 91–95. 10.1038/nature13395
- ↵Langmead B, Salzberg S. 2012. Fast gapped-read alignment with Bowtie 2. Nat Methods 9: 357–359. 10.1038/nmeth.1923
- ↵Lee D, Shi M, Moran J, Wall M, Zhang J, Liu J, Fitzgerald D, Kyono Y, Ma L, White KP, 2020. STARRPeaker: uniform processing and accurate identification of STARR-seq active regions. Genome Biol 21: 298. 10.1186/s13059-020-02194-x
- ↵Lemaitre B, Hoffmann J. 2007. The host defense of Drosophila melanogaster. Annu Rev Immunol 25: 697–743. 10.1146/annurev.immunol.25.022106.141615
- ↵Levo M, Raimundo J, Bing XY, Sisco Z, Batut PJ, Ryabichko S, Gregor T, Levine MS. 2022. Transcriptional coupling of distant regulatory genes in living embryos. Nature 605: 754–760. 10.1038/s41586-022-04680-7
- ↵Levy F, Rabel D, Charlet M, Bulet P, Hoffmann JA, Ehret-Sabatier L. 2004. Peptidomic and proteomic analyses of the systemic immune response of Drosophila. Biochimie 86: 607–616. 10.1016/j.biochi.2004.07.007
- ↵Liao Y, Smyth GK, Shi W. 2014. featureCounts: an efficient general purpose program for assigning sequence reads to genomic features. Bioinformatics 30: 923–930. 10.1093/bioinformatics/btt656
- ↵Martin M. 2011. Cutadapt removes adapter sequences from high-throughput sequencing reads. EMBnet.j 17: 10–12. 10.14806/ej.17.1.200
- ↵Meister M, Richards G. 1996. Ecdysone and insect immunity: the maturation of the inducibility of the diptericin gene in Drosophila larvae. Insect Biochem Mol Biol 26: 155–160. 10.1016/0965-1748(95)00076-3
- ↵Merrill CB, Montgomery AB, Pabon MA, Shabalin AA, Rodan AR, Rothenfluh A. 2022. Harnessing changes in open chromatin determined by ATAC-seq to generate insulin-responsive reporter constructs. BMC Genomics 23: 399. 10.1186/s12864-022-08637-y
- ↵Minakhina S, Tan W, Steward R. 2011. JAK/STAT and the GATA factor pannier control hemocyte maturation and differentiation in Drosophila. Dev Biol 352: 308–316. 10.1016/j.ydbio.2011.01.035
- ↵The modENCODE Consortium, Roy S, Ernst J, Kharchenko PV, Kheradpour P, Negre N, Eaton ML, Landolin JM, Bristow CA, Ma L, 2010. Identification of functional elements and regulatory circuits by Drosophila modENCODE. Science 330: 1787–1797. 10.1126/science.1198374
- ↵Mohrs M, Blankespoor C, Wang ZE, Loots G, Afzal V, Hadeiba H, Shinkai K, Rubin E, Locksley RM. 2001. Deletion of a coordinate regulator of type 2 cytokine expression in mice. Nat Immunol 2: 842–847. 10.1038/ni0901-842
- ↵Morris O, Liu X, Domingues C, Runchel C, Chai A, Basith S, Tenev T, Chen H, Choi S, Pennetta G, 2016. Signal integration by the IκB protein pickle shapes Drosophila innate host defense. Cell Host Microbe 20: 283–295. 10.1016/j.chom.2016.08.003
- ↵Muerdter F, Boryń ŁM, Arnold CD. 2015. STARR-seq—principles and applications. Genomics 106: 145–150. 10.1016/j.ygeno.2015.06.001
- ↵Myers AL, Harris CM, Choe KM, Brennan CA. 2018. Inflammatory production of reactive oxygen species by Drosophila hemocytes activates cellular immune defenses. Biochem Biophys Res Commun 505: 726–732. 10.1016/j.bbrc.2018.09.126
- ↵Neumayr C, Pagani M, Stark A, Arnold CD. 2019. STARR-seq and UMI-STARR-seq: assessing enhancer activities for genome-wide-, high-, and low-complexity candidate libraries. Curr Protoc Mol Biol 128: e105. 10.1002/cpmb.105
- ↵Ostuni R, Piccolo V, Barozzi I, Polletti S, Termanini A, Bonifacio S, Curina A, Prosperini E, Ghisletti S, Natoli G. 2013. Latent enhancers activated by stimulation in differentiated cells. Cell 152: 157–171. 10.1016/j.cell.2012.12.018
- ↵Pfeiffer BD, Jenett A, Hammonds AS, Ngo TTB, Misra S, Murphy C, Scully A, Carlson JW, Wan KH, Laverty TR, 2008. Tools for neuroanatomy and neurogenetics in Drosophila. Proc Natl Acad Sci 105: 9715–9720. 10.1073/pnas.0803697105
- ↵Ramírez F, Ryan DP, Grüning B, Bhardwaj V, Kilpert F, Richter AS, Heyne S, Dündar F, Manke T. 2016. deepTools2: a next generation web server for deep-sequencing data analysis. Nucleic Acids Res 44: W160–W165. 10.1093/nar/gkw257
- ↵Ramirez-Corona BA, Fruth S, Ofoegbu O, Wunderlich Z. 2021. The mode of expression divergence in Drosophila fat body is infection-specific. Genome Res 31: 1024–1034. 10.1101/gr.269597.120
- ↵Robinson JT, Thorvaldsdóttir H, Winckler W, Guttman M, Lander ES, Getz G, Mesirov JP. 2011. Integrative genomics viewer. Nat Biotechnol 29: 24–26. 10.1038/nbt.1754
- ↵Rus F, Flatt T, Tong M, Aggarwal K, Okuda K, Kleino A, Yates E, Tatar M, Silverman N. 2013. Ecdysone triggered PGRP-LC expression controls Drosophila innate immunity. EMBO J 32: 1626–1638. 10.1038/emboj.2013.100
- ↵Samakovlis C, Asling B, Boman HG, Gateff E, Hultmark D. 1992. In vitro induction of cecropin genes—an immune response in a Drosophila blood cell line. Biochem Biophys Res Commun 188: 1169–1175. 10.1016/0006-291X(92)91354-S
- ↵Schlamp F, Delbare SYN, Early AM, Wells MT, Basu S, Clark AG. 2021. Dense time-course gene expression profiling of the Drosophila melanogaster innate immune response. BMC Genomics 22: 304. 10.1186/s12864-021-07593-3
- ↵Senger K, Armstrong GW, Rowell WJ, Kwan JM, Markstein M, Levine M. 2004. Immunity regulatory DNAs share common organizational features in Drosophila. Mol Cell 13: 19–32. 10.1016/S1097-2765(03)00500-8
- ↵Silverman N, Zhou R, Stöven S, Pandey N, Hultmark D, Maniatis T. 2000. A Drosophila IκB kinase complex required for Relish cleavage and antibacterial immunity. Genes Dev 14: 2461–2471. 10.1101/gad.817800
- ↵Sopko R, Lin YB, Makhijani K, Alexander B, Perrimon N, Brückner K. 2015. A systems-level interrogation identifies regulators of Drosophila blood cell number and survival. PLoS Genet 11: e1005056. 10.1371/journal.pgen.1005056
- ↵Spahn P, Huelsmann S, Rehorn KP, Mischke S, Mayer M, Casali A, Reuter R. 2014. Multiple regulatory safeguards confine the expression of the GATA factor serpent to the hemocyte primordium within the Drosophila mesoderm. Dev Biol 386: 272–279. 10.1016/j.ydbio.2013.12.012
- ↵Storelli G, Nam HJ, Simcox J, Villanueva CJ, Thummel CS. 2019. Drosophila HNF4 directs a switch in lipid metabolism that supports the transition to adulthood. Dev Cell 48: 200–214.e6. 10.1016/j.devcel.2018.11.030
- ↵Tafesh-Edwards G, Eleftherianos I. 2020. JNK signaling in Drosophila immunity and homeostasis. Immunol Lett 226: 7–11. 10.1016/j.imlet.2020.06.017
- ↵Tanji T, Hu X, Weber ANR, Ip YT. 2007. Toll and IMD pathways synergistically activate an innate immune response in Drosophila melanogaster. Mol Cell Biol 27: 4578–4588. 10.1128/mcb.01814-06
- ↵Tanji T, Yun EY, Ip YT. 2010. Heterodimers of NF-κB transcription factors DIF and Relish regulate antimicrobial peptide genes in Drosophila. Proc Natl Acad Sci 107: 14715–14720. 10.1073/pnas.1009473107
- ↵Tremblay BJ. 2024. universalmotif: an R package for biological motif analysis. J Open Source Software 9: 7012. 10.21105/joss.07012
- ↵Troha K, Im JH, Revah J, Lazzaro BP, Buchon N. 2018. Comparative transcriptomics reveals CrebA as a novel regulator of infection tolerance in D. melanogaster. PLoS Pathog 14: e1006847. 10.1371/journal.ppat.1006847
- ↵Uvell H, Engström Y. 2003. Functional characterization of a novel promoter element required for an innate immune response in Drosophila. Mol Cell Biol 23: 8272–8281. 10.1128/MCB.23.22.8272-8281.2003
- ↵Valanne S, Myllymäki H, Kallio J, Schmid MR, Kleino A, Murumägi A, Airaksinen L, Kotipelto T, Kaustio M, Ulvila J, 2010. Genome-wide RNA interference in Drosophila cells identifies G protein-coupled receptor kinase 2 as a conserved regulator of NF-κB signaling. J Immunol 184: 6188–6198. 10.4049/jimmunol.1000261
- ↵Valanne S, Wang J-H, Rämet M. 2011. The Drosophila toll signaling pathway. J Immunol 186: 649–656. 10.4049/jimmunol.1002302
- ↵Vonolfen MC, Meyer Zu Altenschildesche FL, Nam H-J, Brodesser S, Gyenis A, Buellesbach J, Lam G, Thummel CS, Storelli G. 2024. Drosophila HNF4 acts in distinct tissues to direct a switch between lipid storage and export in the gut. Cell Rep 43: 114693. 10.1016/j.celrep.2024.114693
- ↵Westlake H, Hanson M, Lemaitre B. 2024. The Drosophila immunity handbook. EPFL Press, Lausanne, Switzerland.
- ↵Yu S, Luo F, Xu Y, Zhang Y, Jin LH. 2022. Drosophila innate immunity involves multiple signaling pathways and coordinated communication between different tissues. Front Immunol 13: 905370. 10.3389/fimmu.2022.905370
- ↵Zabidi MA, Arnold CD, Schernhuber K, Pagani M, Rath M, Frank O, Stark A. 2015. Enhancer-core-promoter specificity separates developmental and housekeeping gene regulation. Nature 518: 556–559. 10.1038/nature13994
- ↵Zhang Y, Liu T, Meyer CA, Eeckhoute J, Johnson DS, Bernstein BE, Nusbaum C, Myers RM, Brown M, Li W, 2008. Model-based Analysis of ChIP-Seq (MACS). Genome Biol 9: R137. 10.1186/gb-2008-9-9-r137
- ↵Zraly CB, Zakkar A, Perez JH, Ng J, White KP, Slattery M, Dingwall AK. 2020. The Drosophila MLR COMPASS complex is essential for programming cis-regulatory information and maintaining epigenetic memory during development. Nucleic Acids Res 48: 3476–3495. 10.1093/NAR/GKAA082