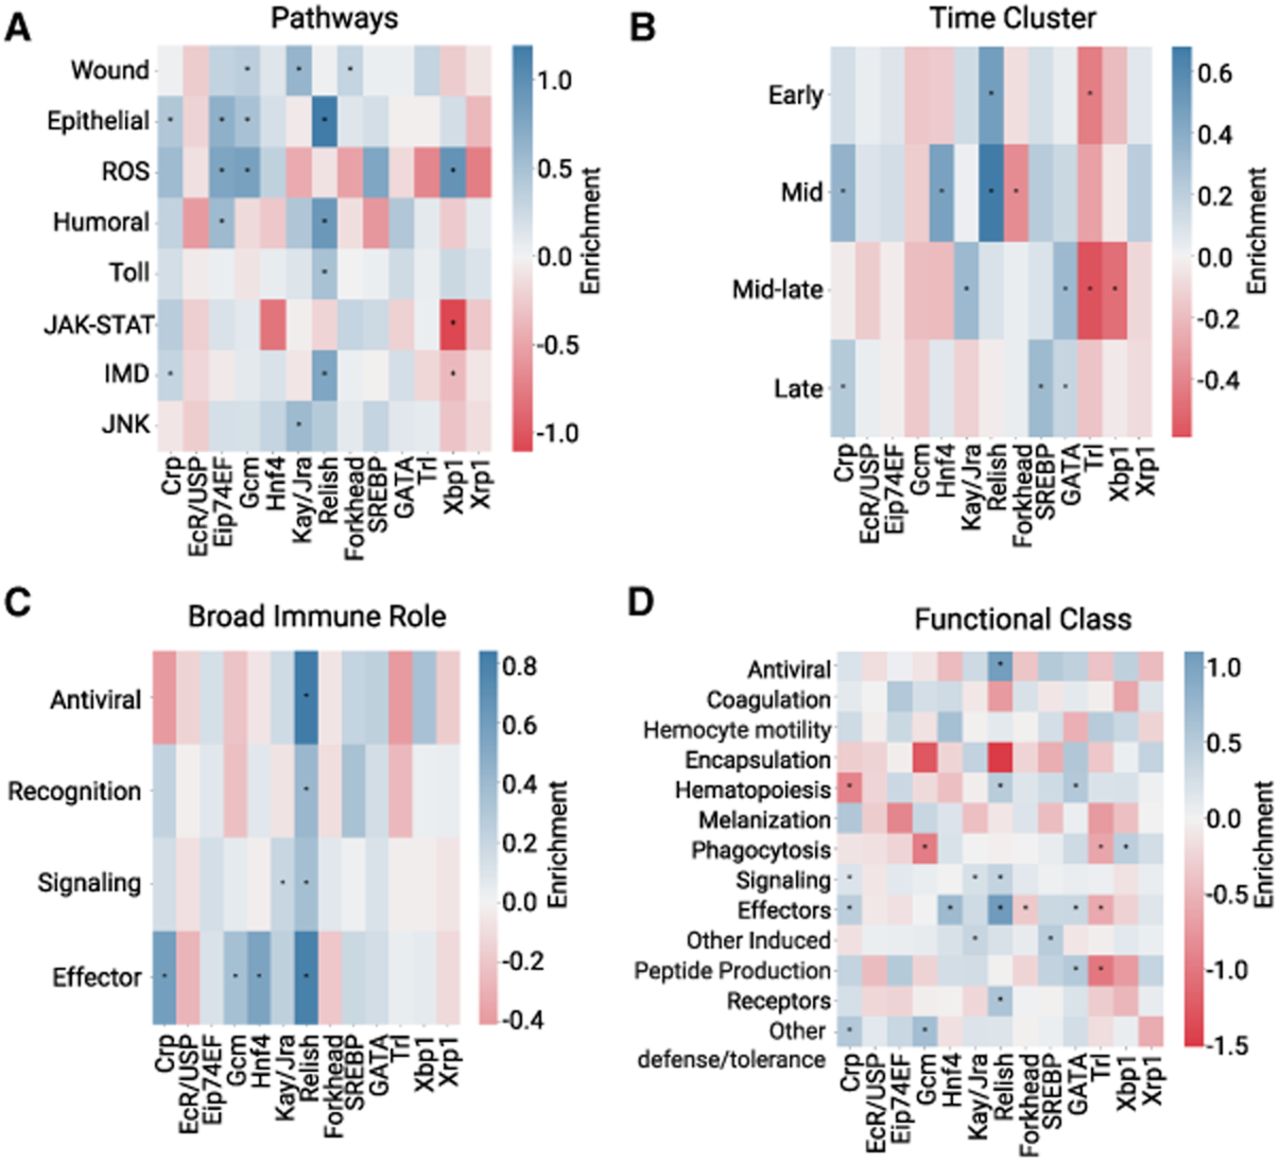
Figure 3.
TFBS profiles of IMD enhancers vary according to pathways, timing, and function. Log odds ratio of TFBSs in IMD enhancers grouped by pathway and process (A) (Schlamp et al. 2021), time cluster (B) (Schlamp et al. 2021), broad immune role (C) (Schlamp et al. 2021), or functional group (D) (Westlake et al. 2024). Positive enrichment values are in blue, and negative enrichment values are in red. (*) P < 0.05, Fisher's exact test.