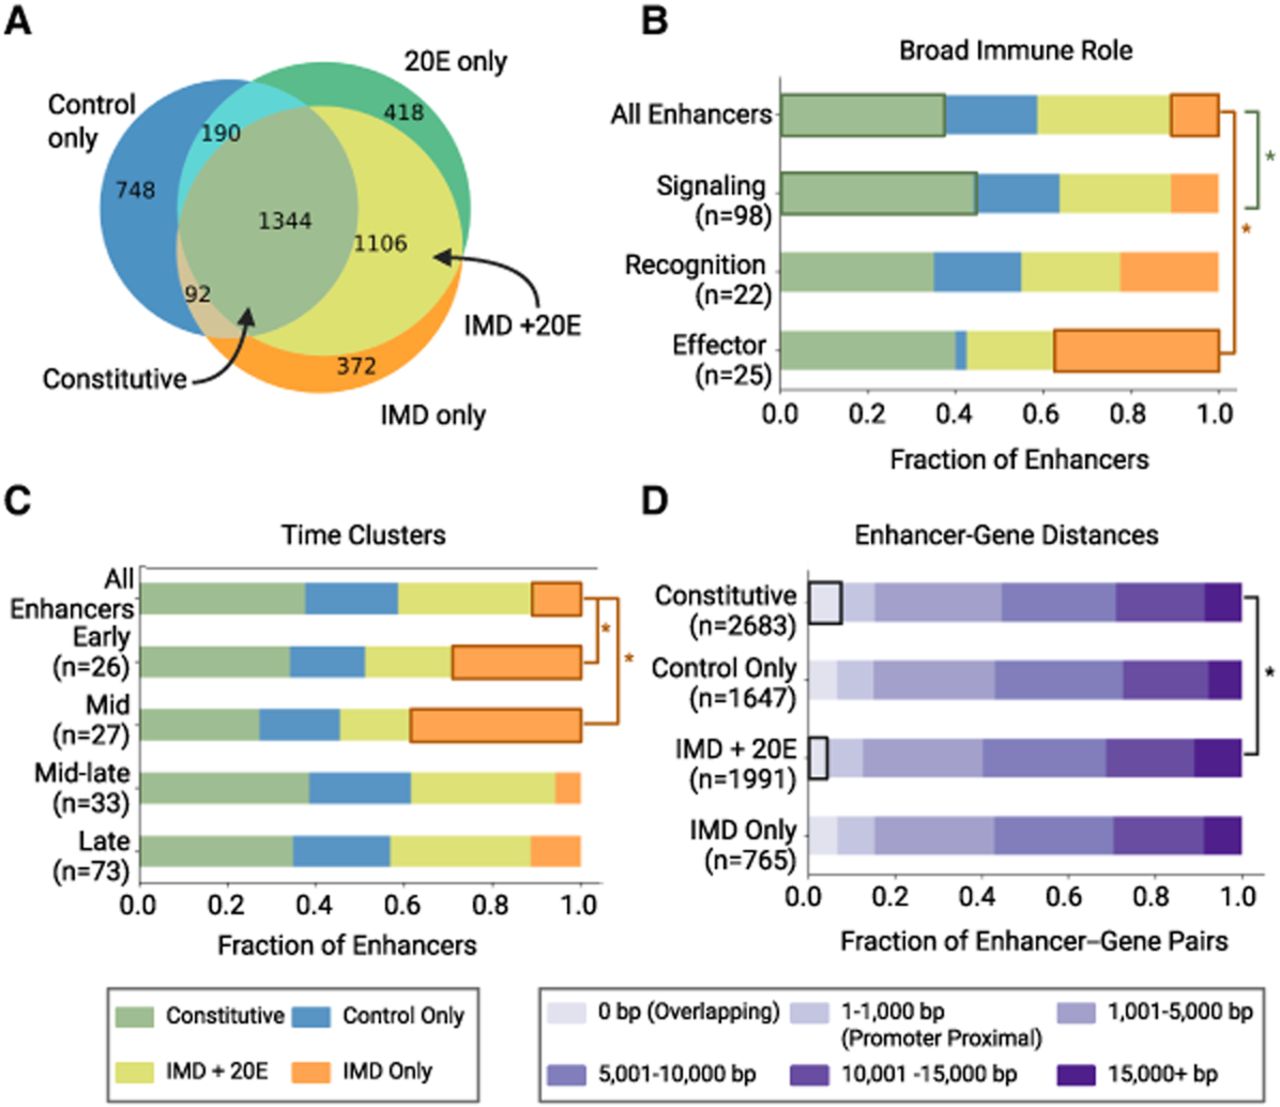
Activity classification of enhancers reveals specific properties of inducible and constitutive enhancers. (A) Venn diagram of enhancers showing activity in treatment conditions, defining activity classes. (B) Distribution of enhancer activity classes by broad immune role (Schlamp et al. 2021). There is a significantly higher fraction of IMD only enhancers in the effector group compared with all enhancers, whereas the signaling group has a higher fraction of constitutive enhancers compared with all enhancers. (*) P < 0.05, one-proportion z-tests. The number of genes in each immune role is listed in parentheses. (C) Distribution of enhancer activity classes by time cluster (Schlamp et al. 2021). The fraction of IMD only enhancers is significantly larger in the early and mid clusters compared with all enhancers. (*) P < 0.05, one-proportion z-tests. The number of genes in each time cluster is listed in parentheses. (D) Distributions of distances between enhancers and paired genes. Distance is measured from the closest edge of the enhancer to the transcriptional start site (TSS). For intronic enhancers, the distance will include the length of the introns and exons between the TSS and enhancer. The fraction of constitutive enhancers that overlap with their paired genes is significantly greater than the fraction of inducible IMD + 20E enhancers that overlap with genes. (*) P < 0.05, two-proportion z-test. The number of enhancer–gene pairs is listed in parentheses for each activity class.