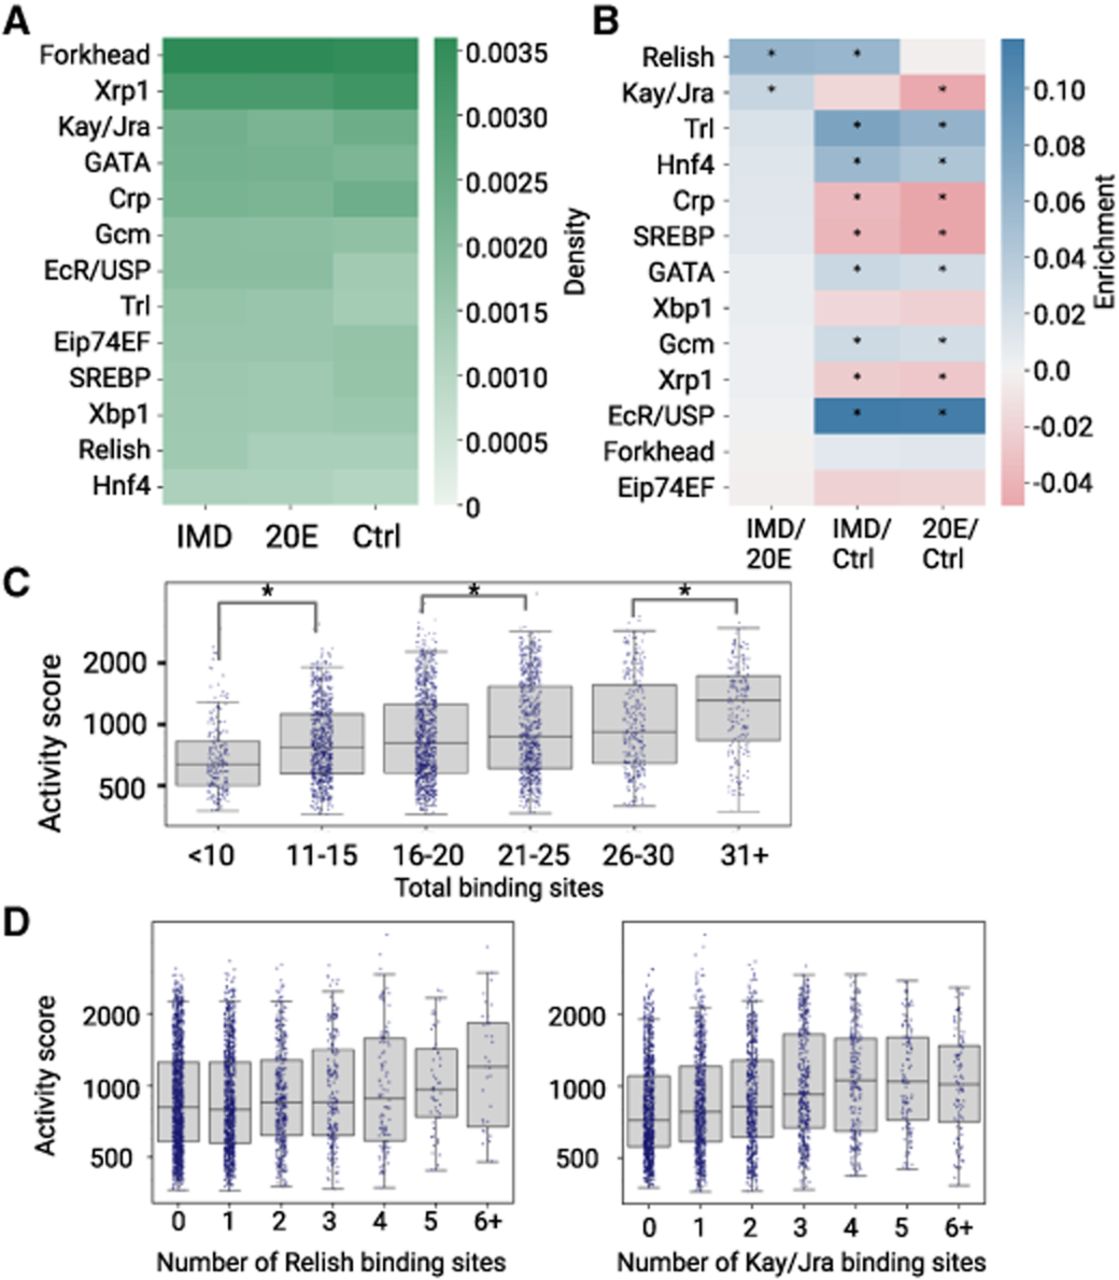
Transcription factor (TF) binding content varies between immune enhancers. (A) Number of binding sites for each TF normalized by total length in base pairs of enhancers in each data set. Density is reported as the number of TFBS motifs per base pair. (B) Log of odds ratio of TFBSs in three comparisons. Enrichment is reported as the logarithm of the ratio of TFBS density in each of the two enhancer groups being compared. Positive enrichment values are in blue; negative enrichment values are in red. (*) P < 0.05, Fisher's exact test. (C) Activity score (log scale) from STARR-seq of IMD enhancers plotted by total binding sites. Individual enhancers are shown as dots, and medians and quartiles are displayed as box and whisker plots. The activity scores of enhancers in adjacent bins were compared by Mann–Whitney U test with Bonferroni correction. (*) P < 0.05. Nonsignificant comparisons are not shown. (D) Activity score (log scale) of IMD enhancers by number of Relish or Kay/Jra binding sites.