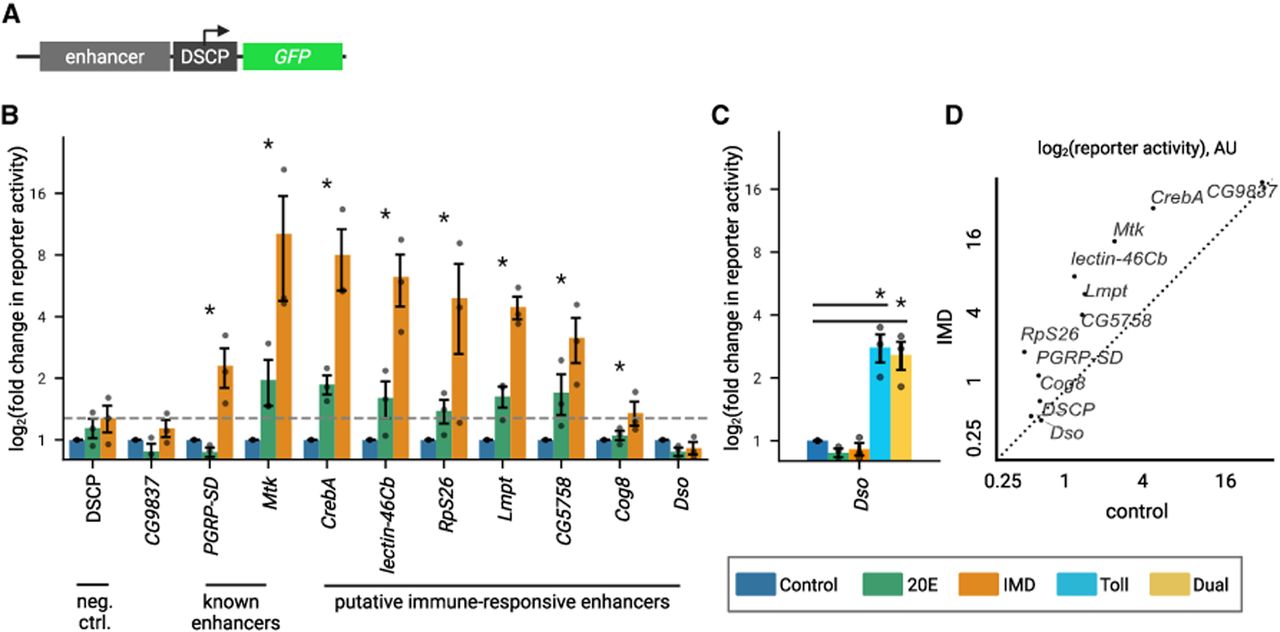
STARR-seq enhancer reporters demonstrate immune-specific expression. (A) Schematic of enhancer reporter plasmids, with GFP under control of STARR-seq enhancers and minimal promoter, DSCP. (B) Log2 (fold change) of GFP expression measured by flow cytometry normalized to control treatment of enhancer reporters and promoter-only (DSCP) negative control. Bars represent the mean, and dots show three biological replicates. Error bars represent SEM. Gray dashed line marks the expression level of DSCP control upon IMD stimulation. Significant gene induction is labeled with an asterisk, P < 0.05 (one-sided Mann–Whitney U test). (C) Log2 (fold change) of GFP expression normalized to control treatment of daisho enhancer reporter. Significant gene induction is labeled with an asterisk, P < 0.05 (one-sided Mann–Whitney U test). (D) Log2 of GFP expression levels for reporters comparing IMD treatment to control treatment. Both treatment conditions are normalized to untransfected S2* Torso-pelle cells. Dashed line is y = x, denoting an equal response to IMD and control treatment.