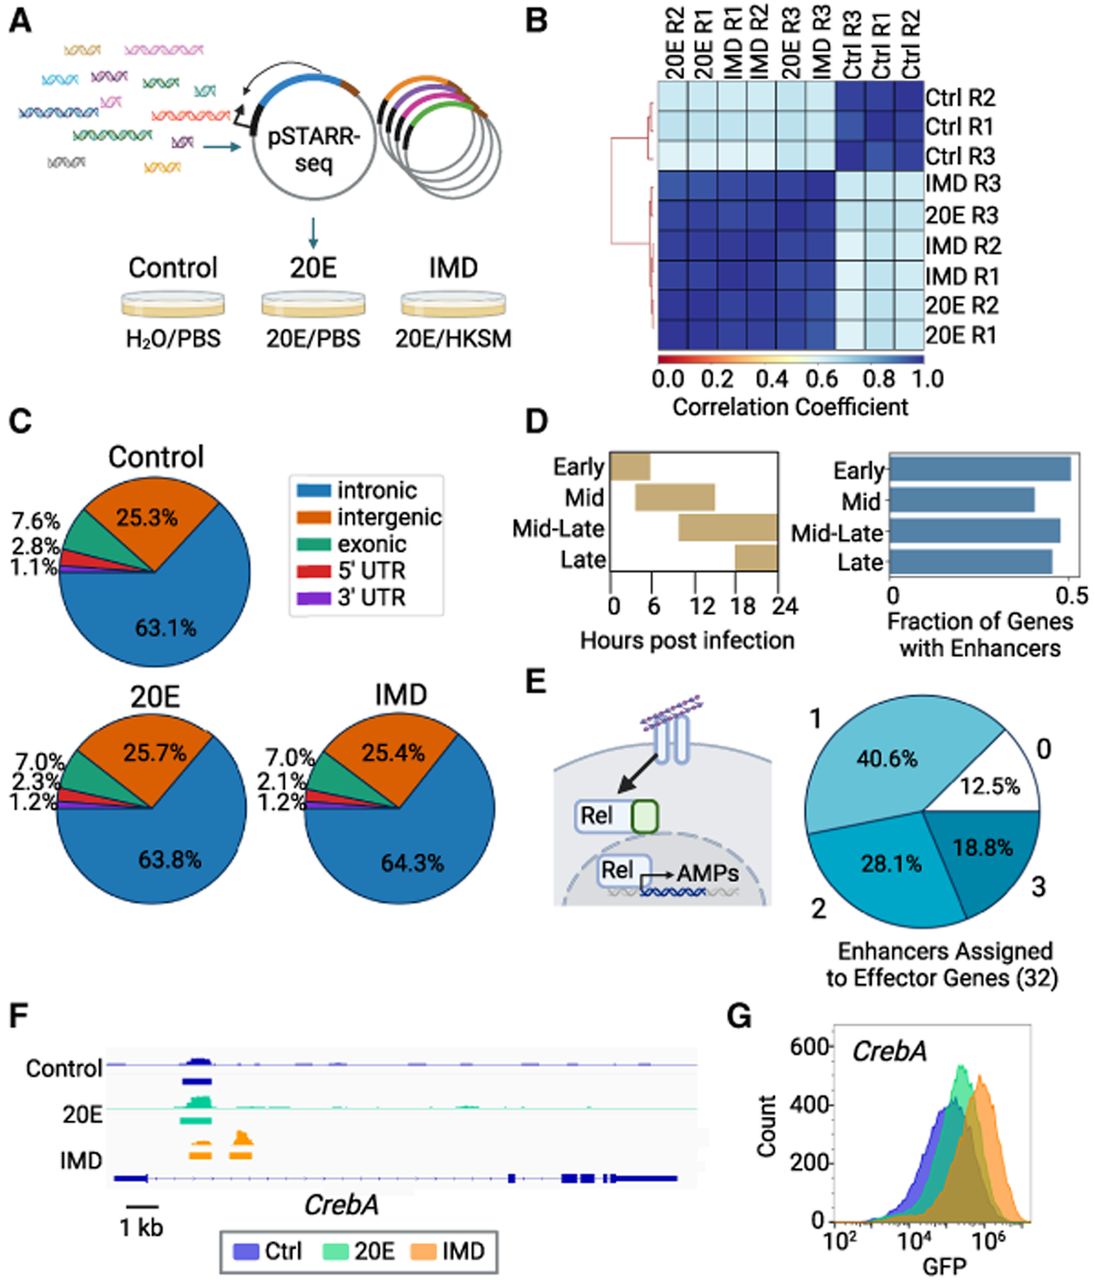
Immune enhancers identified by STARR-seq. (A) Schematic of STARR-seq experiment. Fragmented genomic DNA is cloned into the pSTARR-seq plasmid, creating a library of putative enhancer regions. This library is transfected into S2* cells, split into three different populations, and treated with either H2O/PBS, 20E/PBS, or 20E/heat-killed Serratia marcescens (HKSM). (B) Pearson's correlation of each individual replicate across three treatments. (C) Distribution of enhancers in genomic regions. (D) Schlamp et al. (2021) identified four time clusters of gene expression in the first 24 h following immune stimulation in adult flies; peak expression times for each time cluster are shown. Enhancers were assigned to these immune genes, and the fraction of immune genes identified by Schlamp et al. (2021) with an immune enhancer is plotted. (E) Schematic of Imd pathway activated by DAP-type peptidoglycan binding to peptidoglycan recognition proteins (PGRPs), leading to the cleavage of the NF-kB Relish, allowing its translocation into the nucleus, where it activates transcription of antimicrobial peptides (AMPs). Pie chart of the number of enhancers assigned to 32 Imd-associated AMPs and other effectors (Westlake et al. 2024). (F) Integrative Genomics Viewer (IGV) view of the CrebA gene locus, showing the STARR-seq output tracks and STARRPeaker called peaks for all treatment conditions. STARR-seq identified two enhancers in the CrebA intron, one shared across all conditions and one that is IMD specific (Robinson et al. 2011). (G) Overlay histogram of GFP levels of S2* cells transfected with a GFP reporter of the IMD-specific CrebA enhancer analyzed by flow cytometry.