
Abstract
Transposable elements (TEs), which constitute approximately one-third of ruminant genomes, significantly influence genome evolution. However, the substantial sequence diversity across ruminant species complicates cross-species TE comparison and analysis of their interactions with Krüppel-associated box zinc finger proteins (KZFPs). Through a comprehensive analysis of 32 ruminant genomes, we identify taxon-specific expansions of KZFPs (approximately 271 per genome), which reflect established phylogenies. Among TEs, LINE/RTE-BovB dominates genomic content (55.7%), whereas LTR/ERVK subfamilies show significant taxon-specific variation. Our k-mer-based clustering approach effectively reconstructs ruminant phylogeny and reveals temporal patterns of TE expansion. Importantly, we uncover robust coevolutionary signatures between 90 KZFPs and specific TE k-mer clusters, notably involving 32 KZFPs that target Bovidae-specific LTR/ERVK clusters. Furthermore, Bovinae-specific TEs impact gene structure by exonizing 14 genes and generating tissue-enriched cis-regulatory elements (CREs), including 1645 promoter- and enhancer-associated elements. This study establishes a robust computational framework for cross-species TE analysis and provides key insights into the coevolution of KZFPs and TEs, advancing our understanding of TE genomics and function in ruminants.
Transposable elements (TEs) are dynamic genomic sequences that jump within genomes, comprising 7%–40% of genetic material in domestic animals (Zhao et al. 2023b). Although the majority of TE insertions are either neutral or potentially harmful to host organisms, they have, nonetheless, been instrumental in shaping host genome evolution through their distinctive movement patterns (Arkhipova 2018; Platt et al. 2018; Fueyo et al. 2022). These TEs demonstrate remarkable versatility in their ability to create new transcripts or genes through exonization, while also modulating gene expression through strategic placement of enhancers or promoters near genes (Bourque et al. 2018; Lanciano and Cristofari 2020). Current studies reveal important functional aspects of active TEs, as evidenced by Alu elements that insert themselves into introns of the human TBXT gene and encode in opposing genomic orientations to nearby ancestral Alu elements, enabling ape-specific alternative splicing that influences tail development (Xia et al. 2024). Studies indicate that the insertion of endogenous retroviruses (ERVs) in the APOB gene causes cholesterol deficiency in Holstein-Friesian cattle (Tang et al. 2024). Furthermore, SINEs represent an important component of presence-absence variation in the pig genome, providing insights into population dynamics (Zhao et al. 2023a). Notably, during speciation and subspecies formation, TEs continuously evolve, leading to distinct functional characteristics among TE subfamilies through acquiring or losing specific transcription factor binding sites (Senft and Macfarlan 2021). Consequently, understanding TE patterns is essential for comprehending the mechanisms of host genome evolution.
Krüppel-associated box zinc finger proteins (KZFPs, KRAB-ZFPs) function as essential transcriptional repressors that regulate TE transcriptional activity at the epigenetic level (Imbeault et al. 2017). The human genome encompasses approximately 400 genes that encode KZFPs. From a structural perspective, KZFPs are composed of a KRAB domain and multiple ZNF zinc finger domains (de Tribolet-Hardy et al. 2023). Previous research has demonstrated that KZFPs have a remarkable ability to bind to TEs, exhibiting a continuous coevolutionary pattern (Ecco et al. 2016). Through their intricate interactions, KZFPs and TEs establish sophisticated epigenetic regulatory networks in humans (Imbeault et al. 2017). Additionally, zinc finger proteins enhance cellular defense mechanisms against external retroviruses (including HIV-1) that contain PBS-Lys elements by effectively inhibiting their transcription and integration (Yang et al. 2022). The expression levels of cancer-associated KZFPs demonstrate significant correlations with patient survival outcomes, tumor histological characteristics, and molecular classifications (Machnik et al. 2019). Furthermore, studies have revealed that, in mouse models, deletion of KZFPs gene clusters results in modest activation of ERV transposition activity (Ecco et al. 2016). This evidence substantiates the essential regulatory function of KZFPs in TE regulation (Helleboid et al. 2019). These discoveries emphasize the critical nature of understanding KZFP-TE interactions across species.
Ruminants are widely distributed herbivorous mammals with unique morphological and ecological characteristics (particularly head organs and multichambered stomachs). They also include several economically important livestock species, such as cattle, buffalo, sheep, and goats (Chen et al. 2019). Coupled with the genome evolution of ruminants, TEs formed distinct TE subfamilies, making ruminants ideal models for studying the dynamic evolutionary relationship between TEs and the KZFP family (Farré et al. 2019). Furthermore, studying dynamic evolution of ruminant TEs can help us reveal unique phenotypic traits in ruminant species (Chen et al. 2022). Yet, the characterization of KZFPs and TEs as well as their coevolution patterns is limited in ruminants, because the conventional approachs based on conserved TE sequences, such as Repbase (Bao et al. 2015) and Dfam (Storer et al. 2021), failed in handling TEs of such high sequence diversity (Chen et al. 2019). Notably, k-mer-based methods offer a powerful, alignment-free alternative to reference-dependent techniques for TE phylogenetics. For instance, Hill et al. (2025) classified “Starship” elements using k-mer-based clustering, which grouped TEs by host taxonomy without requiring conserved sequence databases (Hill et al. 2025). This highlights the potential of such approaches for revealing TE expansions in understudied lineages like ruminants.
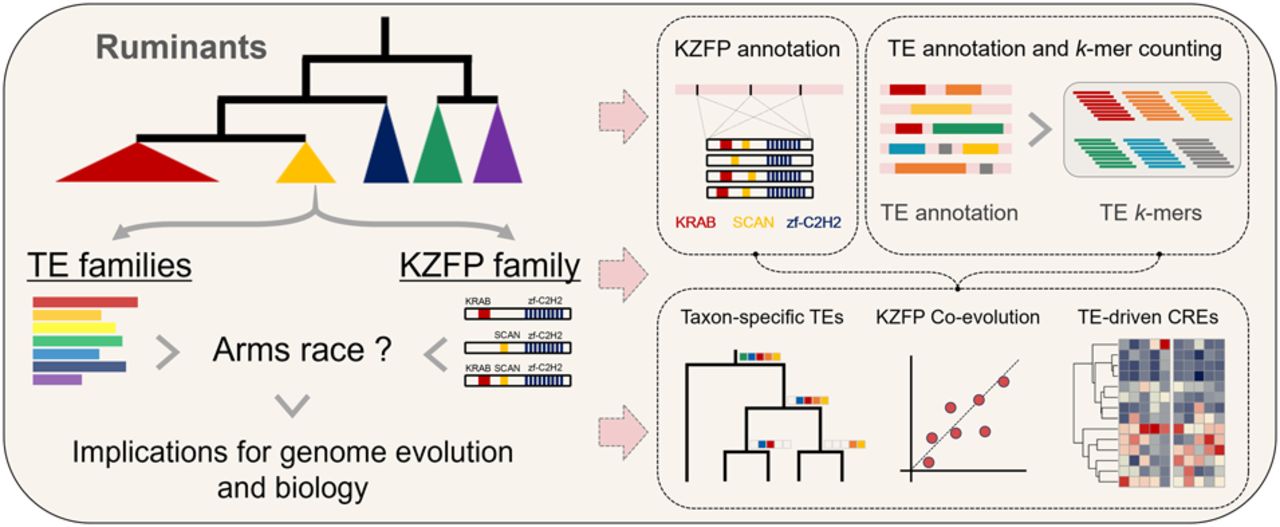
In this study, we aimed to comprehensively characterize the coevolutionary dynamics of KZFPs and TEs across 32 ruminant genomes. We sought to use a k-mer-based approach to overcome limitations of conserved sequence methods and identify taxon-specific expansions of both elements. Our goals were to elucidate their coevolutionary signatures and assess the impact of TEs on gene regulation and structural variation, thereby advancing our understanding of genomic evolution in ruminants (Fig. 1).
Ruminant KZFP-TE regulatory dynamics. The top,left panel illustrates the study's focus on diverse ruminant species with complex phylogenetic relationships. The bottom, left panel highlights the central scientific question regarding the potential arms race between TE and KZFP families and its implications for genome evolution and biology. The right panel outlines our integrated analysis pipeline: top, KZFP annotation based on domain structures (KRAB, SCAN, and zf-C2H2) and TE annotation utilizing a novel k-mer-based strategy; bottom, the key analytical outcomes, including taxon-specific TE expansion, KZFP coevolutionary patterns, and the preferential enrichment of TEs in cis-regulatory elements (CREs).
Results
The KZFP catalog and TE composition in ruminants
From the Ruminant Genome Database (RGD) (Fu et al. 2022), we obtained 32 ruminant species with high-quality genomes (Chen et al. 2019). These comprised one species from Antilocapridae, two from Giraffidae, five from Cervidae, one from Moschidae, and 23 from Bovidae (Supplemental Table S1). The evolutionary relationships among these species had been thoroughly established in previous research, accurately showing the evolutionary radiation of each ruminant species (Chen et al. 2019; Fig. 2A). We developed an atlas of KZFPs by searching these 32 ruminant genomes for sequences encoding KRAB domains adjacent to zinc-finger (ZNF) arrays (Supplemental Tables S2, S3). More specifically, we identified an average of 271 KZFPs (ranging from 127 to 376) through in silico scanning of the KZFP family in ruminant genomes using C2H2 zinc-finger, KRAB, SCAN, and DUF3669 domains (Fig. 2B). The number of KZFPs was similar across the ruminant family, but it was influenced by genome quality (R² to N50 value of 0.51) (Supplemental Fig. S1). Our analysis also revealed that ruminant KZFPs were multiexonic and typically contained a KRAB domain, with an average of 12.52 zf-C2H2 domains (Supplemental Fig. S2). Notably, 101 of these proteins have developed SCAN accessory domains, but none possessed a DUF3669 domain (Fig. 2C). We constructed hierarchical clustering by leveraging the shared pattern of KZFPs among ruminants. This clustering showed a similar pattern to the established ruminant phylogeny (Fig. 2D), suggesting taxon-specific expansion of some KZFPs during ruminant evolution with differential KZFP ratios between different taxa (Fig. 2E). For example, eight KZFPs were found exclusively in Bovinae genomes but not in other ruminant genomes (Fig. 2F).
Annotation of KZFPs and TE Families. (A) The phylogenetic tree illustrates the evolutionary diversification across 32 ruminant species, showing speciation events and divergence timescales. (B) The bar plot displays the number of annotated KZFPs for each ruminant species. (C) The multisegmented pie chart shows the proportional distribution of KZFP domain architectures, categorizing structural configurations for KRAB, SCAN, and zf-C2H2. (D) The hierarchical clustering based on KZFP distribution patterns demonstrates evolutionary relationships among ruminant species. (E) The scatterplot characterizes rank-ordered family-differential KZFP proportions, visualizing taxon-specific expansions or contractions of particular KZFP families. The x-axis represents the rank distribution ordered from highest to lowest differential KZFP ratio. The y-axis represents the differential KZFP ratio between the specific taxon and other ruminants. (F) The heat map tracks the presence/absence status of eight KZFPs across all 32 species. (G) The box plot shows genomic landscape occupation by TE families, revealing substantial variation in TE content proportions. (H) The box plot illustrates the variation coefficient (CV) in TE subfamily frequency across the analyzed ruminant species.
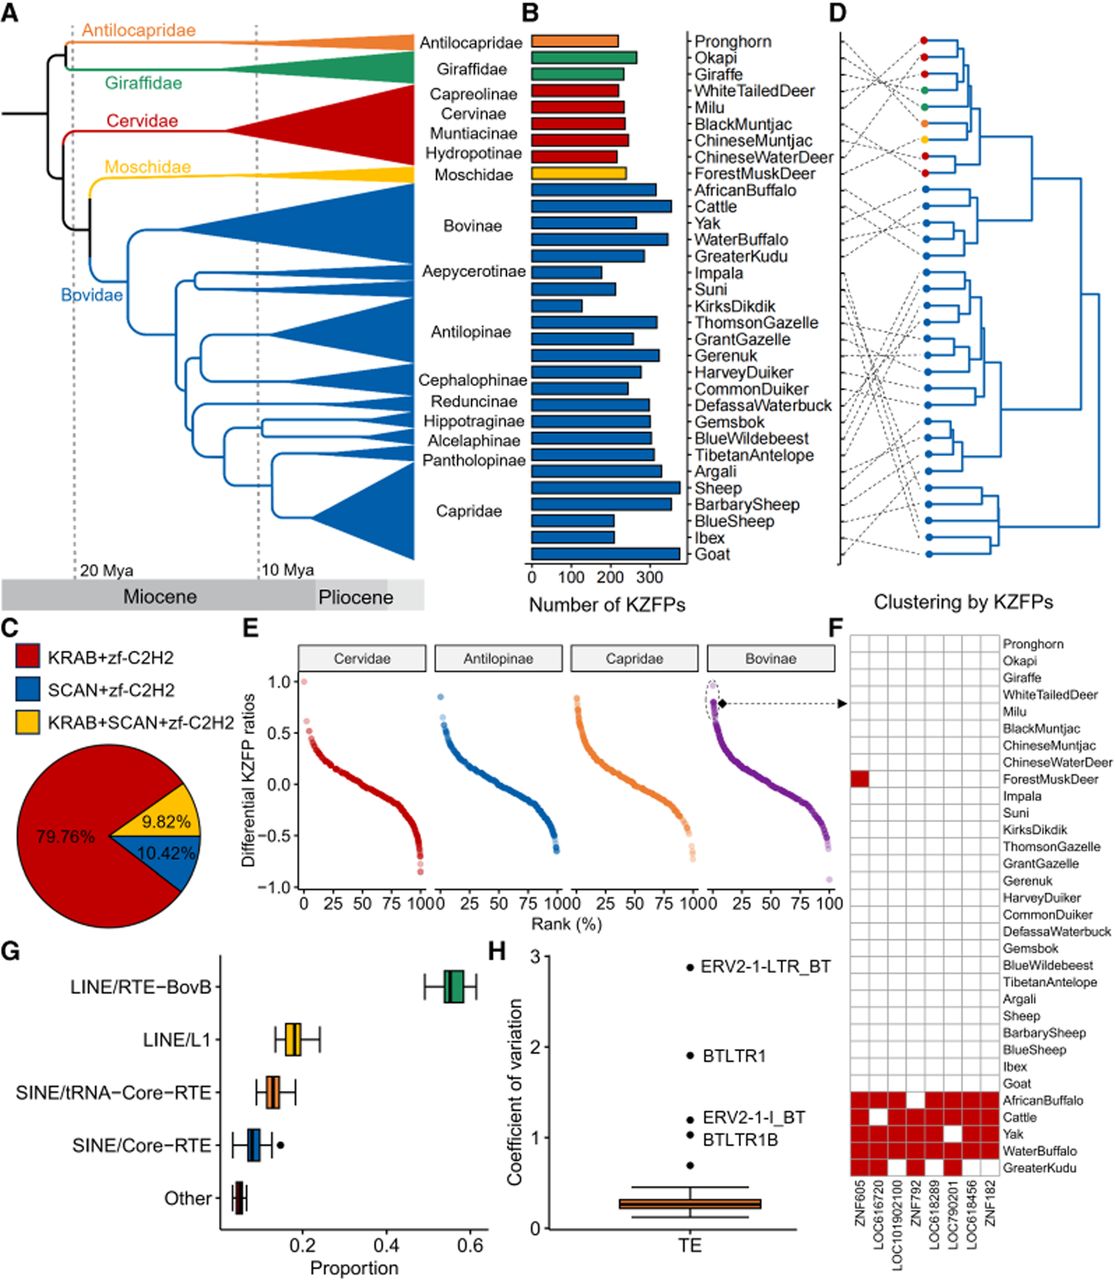
We conducted a de novo TE annotation on ruminant genomes using LongRepMarker (Liao et al. 2021) and RepeatMasker (Tarailo-Graovac and Chen 2009). LongRepMarker produced an average of 40-Mb consensus sequences per genome, with ∼68.39% matching known TE families. Using these consensus sequences as a library in RepeatMasker, we found that an average of 20.94% of ruminant genomes consisted of high-precision TE sequences. The main TE families, by genomic size, included LINE/RTE-BovB (averaging 55.7% of total TE content), followed by LINE/L1 (18.13%), SINE/tRNA-Core-RTE (13.07%), and SINE/Core-RTE (8.16%) (Fig. 2G). When analyzing TE subfamily composition across ruminant genomes, we found that most subfamilies showed consistent proportions. However, some TE subfamilies varied significantly among different ruminants, particularly in the endogenous retroviruses LTR/ERVK family, such as ERV2-1-LTR_BT, BTLTR1, and ERV2-1-I_BT subfamilies (Fig. 2H). These subfamilies may have undergone unbalanced expansion across ruminants.
k-mer-based evolution analysis of TE families in ruminants
We performed a dynamic evolutionary analysis to examine how different TE families expanded unevenly in ruminants. Due to the challenges of comparing TE sequences directly across species, we used a reference-free k-mer clustering algorithm. This approach reduced sequence divergence bias among ruminant genomes while enabling comprehensive analysis of TE family distributions across ruminant species (Fig. 3A). Initially, we aggregated 218 Mb of TE consensus sequences from all ruminant species and generated k-mer spectra with k values ranging from five to 50 (Supplemental Fig. S3). We identified the optimal k length of 42 based on the major peak in the spectrum. Using this optimal k value, we established the k-mer set for TE sequences. We then selected high-abundance k-mers that ranked in the top 1000 and were detected in at least one species to represent the k-mer sets for each TE subfamily. In total, we retained 67,293 TE k-mers across 14 TE families, covering 205 subfamilies (Supplemental Table S4). Finally, we performed k-mer counting for this set on each ruminant genome to generate a TE k-mer count matrix across 32 ruminants.
Evolutionary dynamics of TE families across ruminants based on k-mer-based analyses. (A) Reference-free TE subfamily clustering pipeline. Schematic workflow for identification and comparison of TE subfamilies using k-mer frequency spectra. This approach enables cross-species comparison of TE landscapes without genome assembly, highlighting shared and taxon-specific TE distributions. (B) Hierarchical clustering of ruminant species based on TE-derived k-mers. Unrooted tree illustrating phylogenetic relationships inferred from genome-wide TE k-mer similarity. (C) Correlation between TE subfamily expansion and evolutionary age. Dot plot depicting the proportional abundance of TE subfamilies (y-axis) relative to their estimated evolutionary ages (x-axis, inferred from Kimura divergence). Dots are binned by divergence intervals, revealing episodic bursts of TE activity. (D) Pairwise k-mer distance comparison of Pronghorn (Antilocapridae) TEs. Dot plot showing genetic distances (y-axis) between Pronghorn and other ruminant families based on TE k-mer profiles. (E) Phylogenetic trees of 32 ruminant species reconstructed from TE k-mers at varying divergence thresholds. Phylogenetic topologies generated using TE k-mers filtered at divergence levels of 1%, 5%, 15%, 20%, and 25%. For each phylogenetic tree, different colors distinguish major taxonomic groups at various divergence levels.
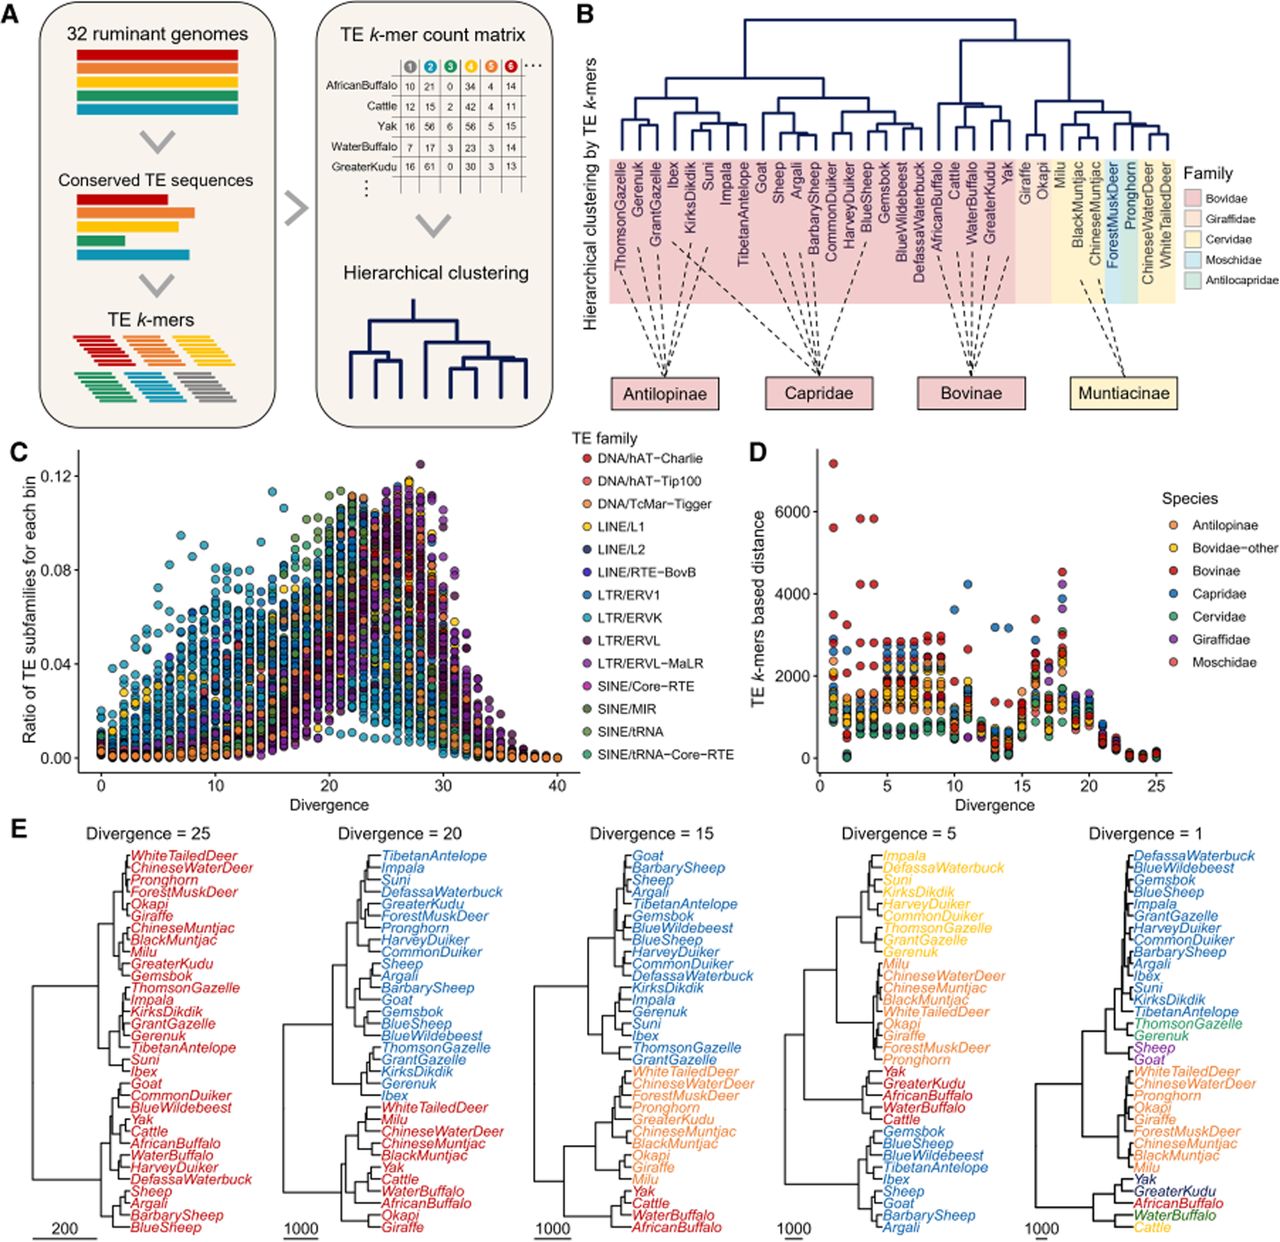
We implemented hierarchical clustering analysis using the Manhattan distance matrix calculated from the ruminant TE k-mer count matrix. As expected, the hierarchical relationships between these clusters corresponded with established ruminant species phylogeny (Fig. 3B). The analysis showed that ruminant species initially divided into two main clusters, aligning with the early Miocene period (∼23–16 million years ago) (Chen et al. 2019). The first cluster contained most Bovidae, comprising a diverse group primarily from the Antilopinae and Capridae families. These taxonomic groups separated during the middle Miocene period, about 15–13 million years ago (Chen et al. 2019). The second cluster included Bovinae (a subdivision of Bovidae), Moschidae, Cervidae, Giraffidae, and Antilocapridae. The clustering method also effectively distinguished closely related ruminant species, such as black muntjac and Chinese muntjac within Muntiacinae. These findings showed that the k-mer-based clustering algorithm using TE successfully revealed evolutionary relationships among ruminant species.
To analyze the dynamic expansion of ruminant TEs, we performed hierarchical clustering using temporally specific TE families. These families were characterized by their divergence, which effectively differentiated the evolutionary ages of various TE families (Fig. 3C; Supplemental Fig. S4). For example, MLT1F from LTR/ERVL-MaLR demonstrated predominant activity in earlier evolutionary periods, whereas ERV2-1-I_BT from LTR/ERVK exhibited more contemporary activity signatures (Supplemental Fig. S5). Subsequently, we identified TE k-mer sets for each divergence bin to examine the temporal evolution of TE k-mer-based species divergence in ruminants. These sets were selected from the three most significant TE subfamilies (those with elevated ratios) within each divergence bin, representing the active TE k-mers during those respective temporal intervals. This facilitated the calculation of TE k-mer-based distances between each species and Pronghorn (a representative of the ancient ruminant lineage) (Fig. 3D). Our findings indicated that other ruminant species demonstrated reduced distance to Pronghorn when analyzing older TE subfamilies (divergence exceeding 20) and exhibited no substantial dispersal patterns among themselves. However, with decreasing TE family age, the TE k-mer-based distance measurements increased, and the ordering became increasingly differentiated, with species from identical subfamilies exhibiting comparable divergence patterns. Notably, the genetic distance between Bovinae and Capridae had expanded considerably in recent evolutionary history, potentially related to the expansion of specific TE subfamilies.
We constructed dynamic trees utilizing TE k-mer sets for each divergence bin to illustrate taxon-specific expansion (Fig. 3E). Our analysis demonstrated that TE subfamilies from different active periods made distinct contributions to the evolutionary trajectories of various ruminants. At divergence 25—representing earlier evolutionary periods—the distance between these ruminants was minimal, with no distinct group clustering evident. As divergence decreased from 20 to 5, however, the distance progressively increased, with specific clustering patterns becoming apparent. The classification at divergence 5 aligned with the established evolutionary radiation of ruminant species, suggesting that TE differentiation during this period exhibited pronounced taxon-specificity. Notably, at divergence 1, we identified substantial differentiation in contemporary domesticated livestock compared to divergence 5, particularly regarding the increased genetic distance between species within the Bovinae family. These findings indicated a progressive expansion of TEs throughout ruminant genome evolution, pointing to a potential coevolutionary relationship between TEs and their host genomes.
Clustering of TE k-mers and their coevolution with the KZFP family
The interaction between TE-KZFP serves as a key regulatory mechanism for modulating TE activity in human genomes (Wu et al. 2025). To examine this interaction in ruminant species, we performed a comprehensive coevolution analysis of TE subfamilies and KZFPs. Initially, we applied k-means clustering to 38,451 k-mers based on their distribution across ruminant species to categorize k-mers with similar patterns. Our analysis identified 45 distinct TE k-mer clusters, with cluster sizes varying from 62 to 13,407 members (Supplemental Table S5). These TE k-mer clusters displayed distinctive distribution patterns across ruminants (Fig. 4A). The distribution included 17 pan-conserved clusters present in >90% of species, 14 Bovidae-shared clusters, seven Bovidae-shared clusters (excluding Bovinae), and seven subfamily-specific clusters (Supplemental Table S5). The largest cluster C1 (13,407 k-mers) demonstrated presence across all species examined. As Bovidae-specific clusters, the second and third largest—C2 (2462 k-mers) and C3 (2400 k-mers)—illustrated the evolutionary divergence between the Bovinae and other (non-Bovinae) subfamilies within Bovidae (Fig. 4B).
Coevolution analysis between the KZFP and TE families. (A) TE k-mer cluster enrichment across ruminant genomes. Heat map displaying the distribution and enrichment patterns of TE k-mer clusters in 32 ruminant genomes. Rows represent specific TE k-mer clusters, columns denote individual genomes. Color intensity indicates the ratio of specific k-mer clustering present in each species. (B) Compositional dynamics of major TE k-mer clusters. Dot plot illustrating the proportional representation of four conserved TE k-mer clusters (C1/C2/C3/C5) across ruminant genomes. (C,D) TE k-mer cluster enrichment in family and subfamily. Heat map correlating eight major TE families and 28 LTR/ERVK subfamilies with k-mer clusters. Color intensity reflects enrichment levels of family or subfamily within each cluster. (E) KZFP-TE coevolution and sequence divergence. Left: Correlation heat map between KZFPs and TE k-mer clusters. Rows: KZFP genes; columns: TE clusters (C2/C3/C5). Red indicates a positive correlation, suggesting KZFP putative binding preferences for specific TE k-mer clusters. Right: Heat map showing pairwise distance matrix of KZFP protein sequences.
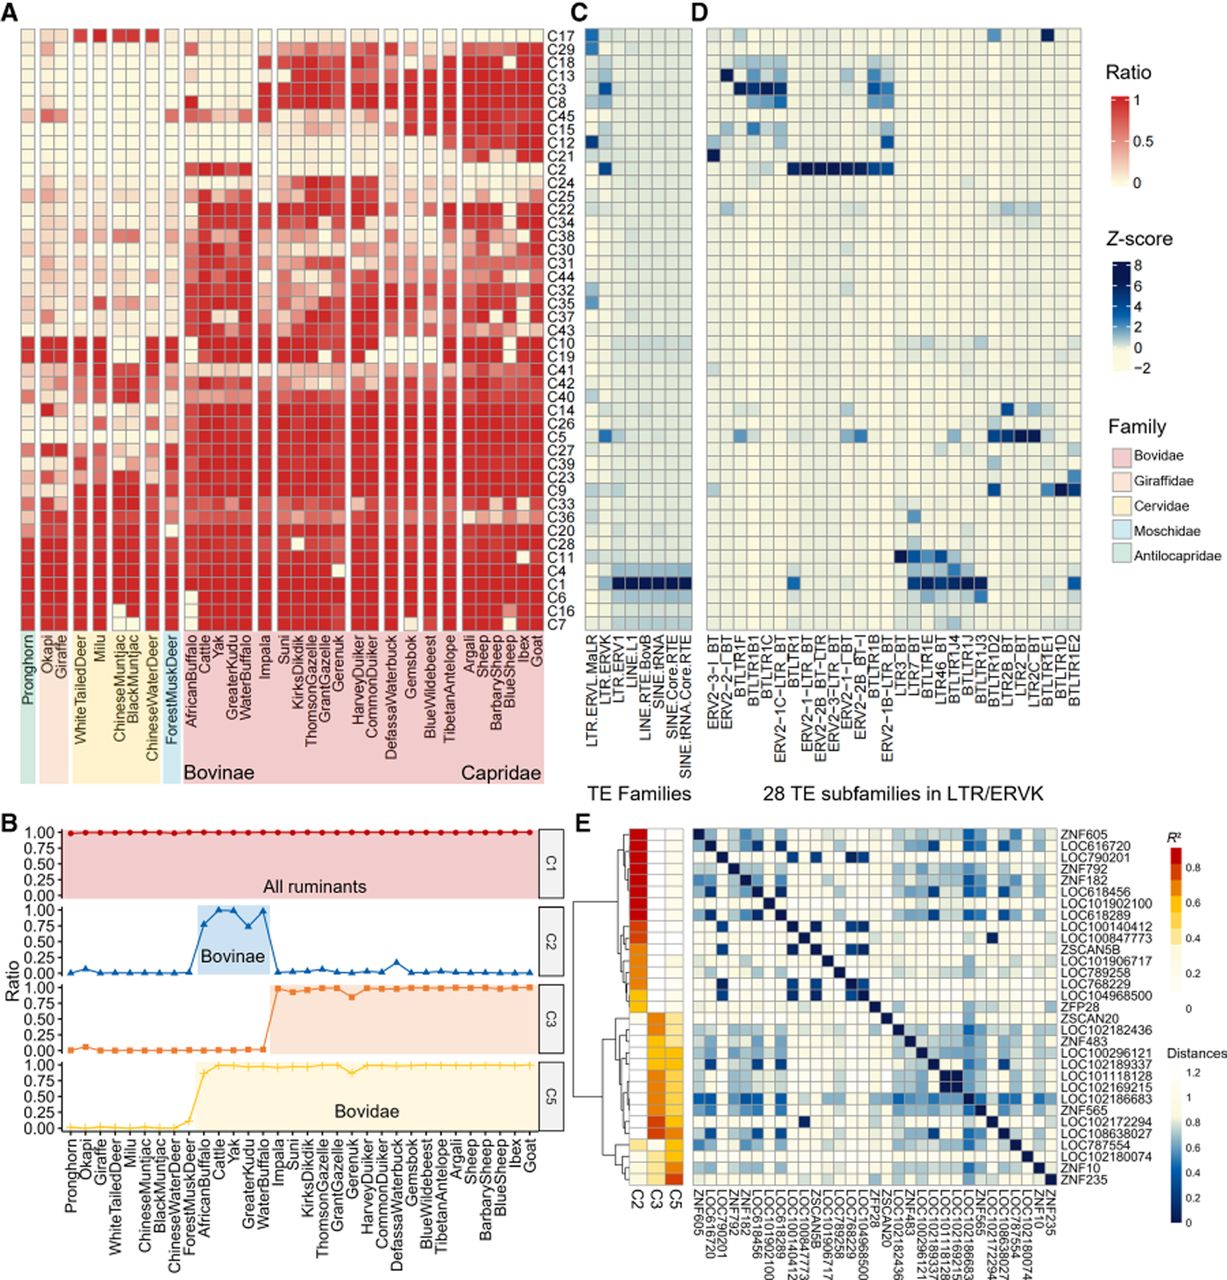
Our analysis mapping k-mer clusters to TE families identified significant enrichment of most TE families within the pan-conserved clusters (C1 cluster). LTR/ERVK and LTR/ERVL-MaLR, however, demonstrated distinct proliferation patterns with notable family/subfamily specificity (Fig. 4C). Of particular interest, LTR/ERVK subfamilies made substantial contributions to TE expansion within the Bovidae lineage (Fig. 4D), exhibiting three distinct patterns: (i) Bovinae-specific C2 clusters demonstrated predominant association with eight ERVK subfamilies; (ii) Bovidae-wide C3 clusters presented expansion bias in four ERVK subfamilies with reduced representation in Bovinae; and (iii) pan-Bovidae C5 clusters exhibited significant enrichment in four evolutionarily conserved ERVK subfamilies. These taxon-specific TE proliferation patterns indicated that k-mer clusters effectively represented the TE subfamilies that underwent specific expansion in ruminants.
To evaluate the coevolutionary relationship between KZFPs and TE families, we conducted a correlation analysis based on their distribution patterns across ruminants. Our analysis revealed that 90 KZFPs demonstrated a significant correlation (R² > 0.6, P-value < 0.01) with ruminant TE k-mer clusters (Supplemental Fig. S6). Although TE k-mer clusters were targeted by multiple KZFPs, many KZFPs exhibited binding preferences for specific TE subfamilies. Notably, we identified three Bovidae-specific TE k-mer clusters, predominantly from the LTR/ERVK family, that were targeted by 32 KZFPs (Fig. 4E). These genes were primarily classified as LOC label genes (65.63%), exhibiting characteristic KZFP structure but lacking definitive annotations. Analysis of pairwise distance based on sequence indicated potential high orthology for these genes with taxon-specific TE k-mer clusters (Fig. 4E).
Exploration of TE-KZFP interactions
The distribution of KZFP-binding sites within human TEs suggests a significant prevalence of specific binding sites within these TE sequences (Pontis et al. 2022). In the absence of ChIP-seq data for KZFPs in ruminants, we identified their DNA-binding sites through the analysis of potential DNA binding motifs in k-mer clusters. For comprehensive motif identification, we obtained potential DNA binding motifs from both JASPAR and predicted models (Fig. 5A). Specifically, we employed 25 unvalidated TFBS of KZFP from JASPAR 2024 (Castro-Mondragon et al. 2022) and generated 75 DNA binding motifs of KZFPs by analyzing their tandem zinc finger domain sequences with the B1H-RC model (Najafabadi et al. 2015). Our analysis of 184 TE k-mer cluster-KZFP pairs (with R² > 0.6) demonstrated that 53.3% were identified (P-value of < 0.001), including 15 JASPAR-related and 53 model-predicted KZFP binding motifs (Fig. 5B; Supplemental Table S6). Within these pairs, numerous high-confidence KZFP binding sites exhibited robust correlations with species-specific clusters (Fig. 5C). The data revealed distinct evolutionary patterns: a ZNF789 isoform in C1 clusters (R² = 0.67) was present across ruminants; a ZNF10 isoform in C5 clusters (R² = 0.70) was exclusive to the Bovidae family; a ZNF565 isoform in C3 clusters (R² = 0.69) was found in the Bovidae family excluding the Bovinae subfamily; a ZNF182 isoform in C2 clusters (R² = 0.91) was characteristic of the Bovinae subfamily; and a ZNF484 isoform in C17 clusters (R² = 0.99) was consistently observed throughout Cervidae.
Analysis and verification of ruminant TE-KZFP interactions. (A) Schematic of TE-KZFP interaction and binding site identification. KZFP-binding sites were identified by integrating de novo motifs from JASPAR database and B1H-RC model predictions. (B) Proportion of TE-derived k-mers containing KZFP-binding motifs. Pie chart show the proportion of KZFP-binding motifs among all motif-containing k-mers derived from TEs. (C) Position weight matrices of coevolved KZFP motifs. Sequence logos and position weight matrices (PWMs) representing DNA-binding motifs of KZFPs showing coevolutionary with TE k-mer clusters. Motifs are stratified by TE family specificity, with matrix height reflecting nucleotide conservation at each position. (D) ERVK family phylogeny and TE k-mer cluster enrichment. Left: Maximum-likelihood phylogenetic tree of ERVK subfamilies, reconstructed from consensus TE sequences. Right: Heat map showing enrichment scores of TE k-mer clusters across ERVK subfamilies. Color intensity denotes enrichment levels of ERVK family within each cluster. (E) Correlation between KZFP motif reliability and coevolution with TE k-mers. Scatterplot evaluating the relationship between KZFP motif prediction confidence and coevolutionary patterns with TE k-mer clusters. x-axis: Difference in correlation R² between C2 and C3 clusters. y-axis: Negative log-transformed ratio of motif detection P-values (C2/C3).
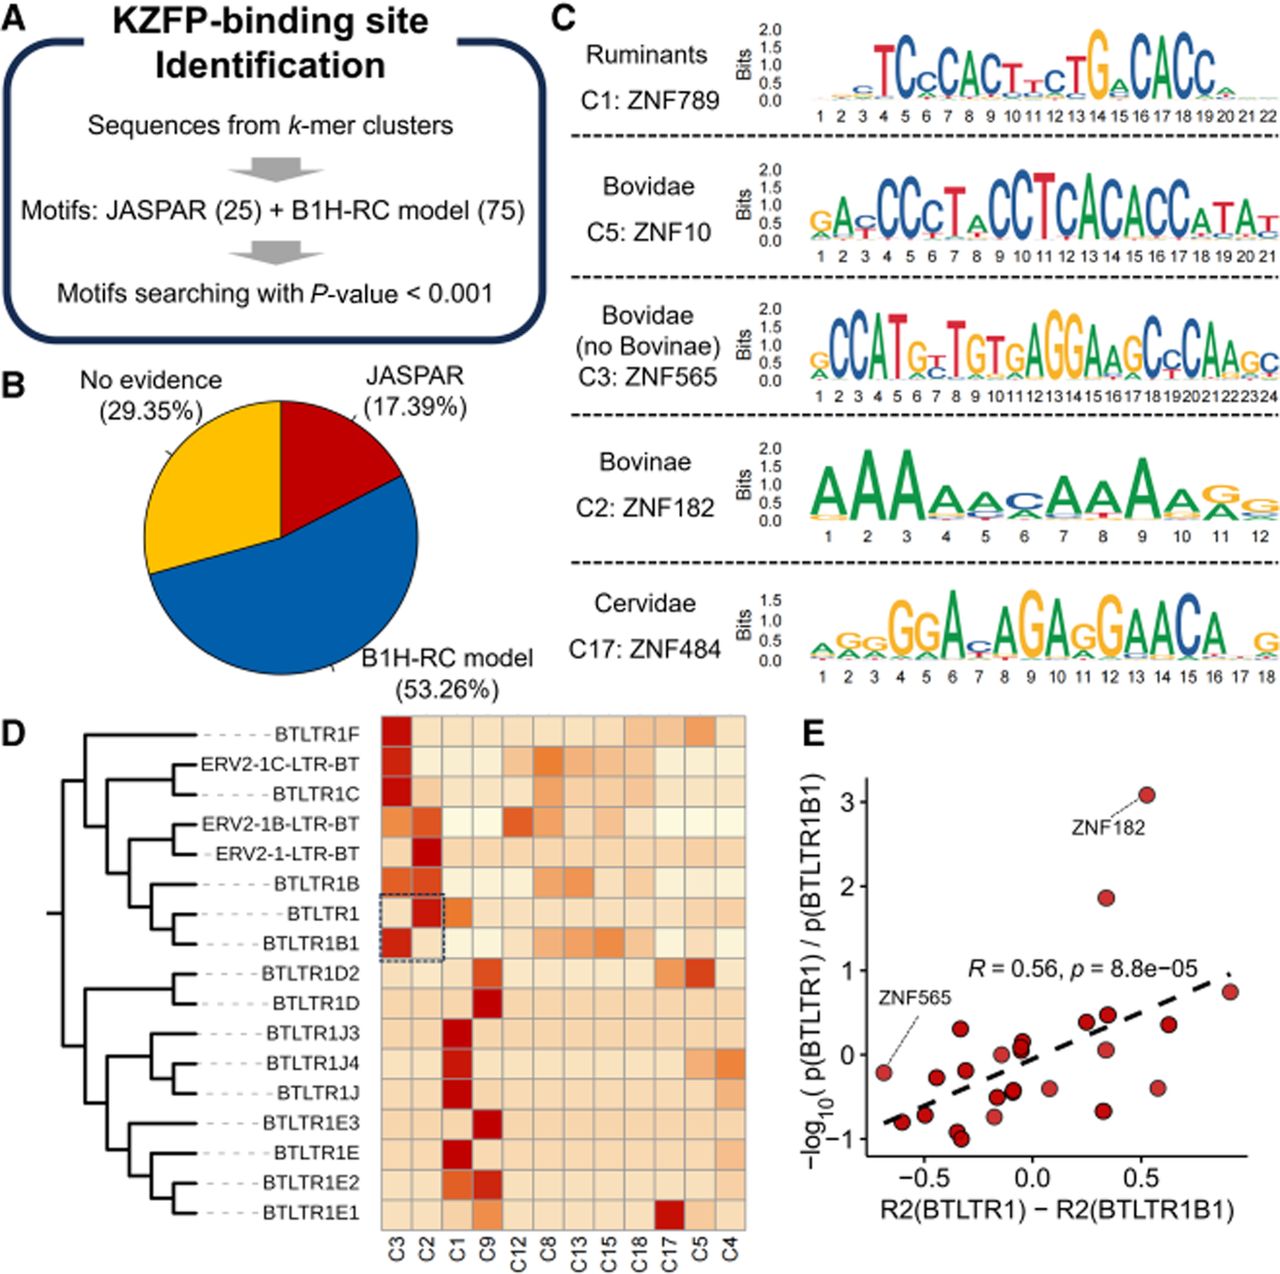
To investigate TE-KZFP interaction specificity, we examined the relationships between TE subfamilies and KZFPs through TE k-mer cluster analysis. Our results identified a notable divergence pattern within the ERVK family: despite high sequence similarity between certain ERVK subfamilies, they appeared in different TE k-mer clusters, indicating distinct KZFP interactions. Specifically, BTLTR1/BTLTRB1, which shared 88.06% sequence identity, separated into distinct k-mer clusters (C2 and C3, respectively) with different coevolutionary partners—ZNF182 isoform (R² = 0.91) for BTLTR1 and ZNF565 isoform (R² = 0.91) for BTLTRB1 (Fig. 5D). Further analysis of BTLTR1 and BTLTRB1's binding preferences demonstrated a significant correlation between KZFP-binding motif reliability (P-value) and coevolutionary patterns (R²), substantiating these predicted interactions (Fig. 5E). These findings indicated that sequence variations in key KZFP-binding regions facilitated evolutionary specialization in KZFP-TE partnerships, even between closely related TE subfamilies.
To validate these computational predictions, we compared our predicted TE-KZFP interactions with experimentally validated interactions in humans reported by Imbeault et al. (2017). Despite substantial differences in TE sequences between humans and ruminants, we identified 12 known interactions supported by experimental evidence in humans. This successfully recapitulated 23.1% and 8.7% of predicted interactions for JASPAR and Predict KZFPs, respectively (Supplemental Table S7).
Functional effects of taxon-specific TEs on ruminant genomes
In our investigation of TE influence on functional evolution in ruminants, we conducted an analysis of sequence variations within protein-coding regions. For this analysis, we selected five well-annotated ruminant species that represent critical stages in Bovidae divergence: members of the Bovinae subfamily (Water Buffalo and Cattle), members of the Caprinae subfamily (Sheep and Goat), and Chinese Muntjac serving as an outgroup. Based on k-mer-based evolutionary analysis demonstrating that LTR/ERVK constituted the primary TE family exhibiting unbalanced expansion in Bovidae (Fig. 4D), we performed a comparative assessment of LTR/ERVK subfamily composition across these genomes. Our findings revealed that LTR/ERVK genome content was significantly elevated in Bovidae compared to Chinese Muntjac (Fig. 6A). Furthermore, distinct LTR/ERVK subfamilies demonstrated variable expansion patterns across taxonomic classifications (Fig. 6B). For example, BTLTR1B exhibited substantial expansion within Bovidae, whereas BTLTR1C demonstrated increased presence in the Caprinae subfamily relative to other species.
Impact of taxon-specific TE genes on ruminant genomes. (A) Bar plots quantify the total genomic content of the ERVK family across five ruminant species. (B) A dot-based heat map visualizes the abundance of individual ERVK subfamilies (rows) in each ruminant genome (columns). Dot size and red color intensity scale with genomic occupancy. This reveals subfamily-specific proliferation bursts, with larger/darker dots indicating subfamilies that underwent significant expansion in particular species. (C) Phylogenetic distribution of taxon-specific TE. A maximum-likelihood tree depicts evolutionary relationships among the five ruminant species. Concentric arcs around the tree illustrate the distribution of genes disrupted by family-specific and subfamily-specific TEs. (D) Exonization events driven by taxon-specific TEs. A table catalogs 14 genes exhibiting TE-induced exonization. (E) Bovidae-specific exonization in ACAD8. (F) Bovinae-specific exonization in IL18R1. (G) Caprinae-specific exonization in IFI44.
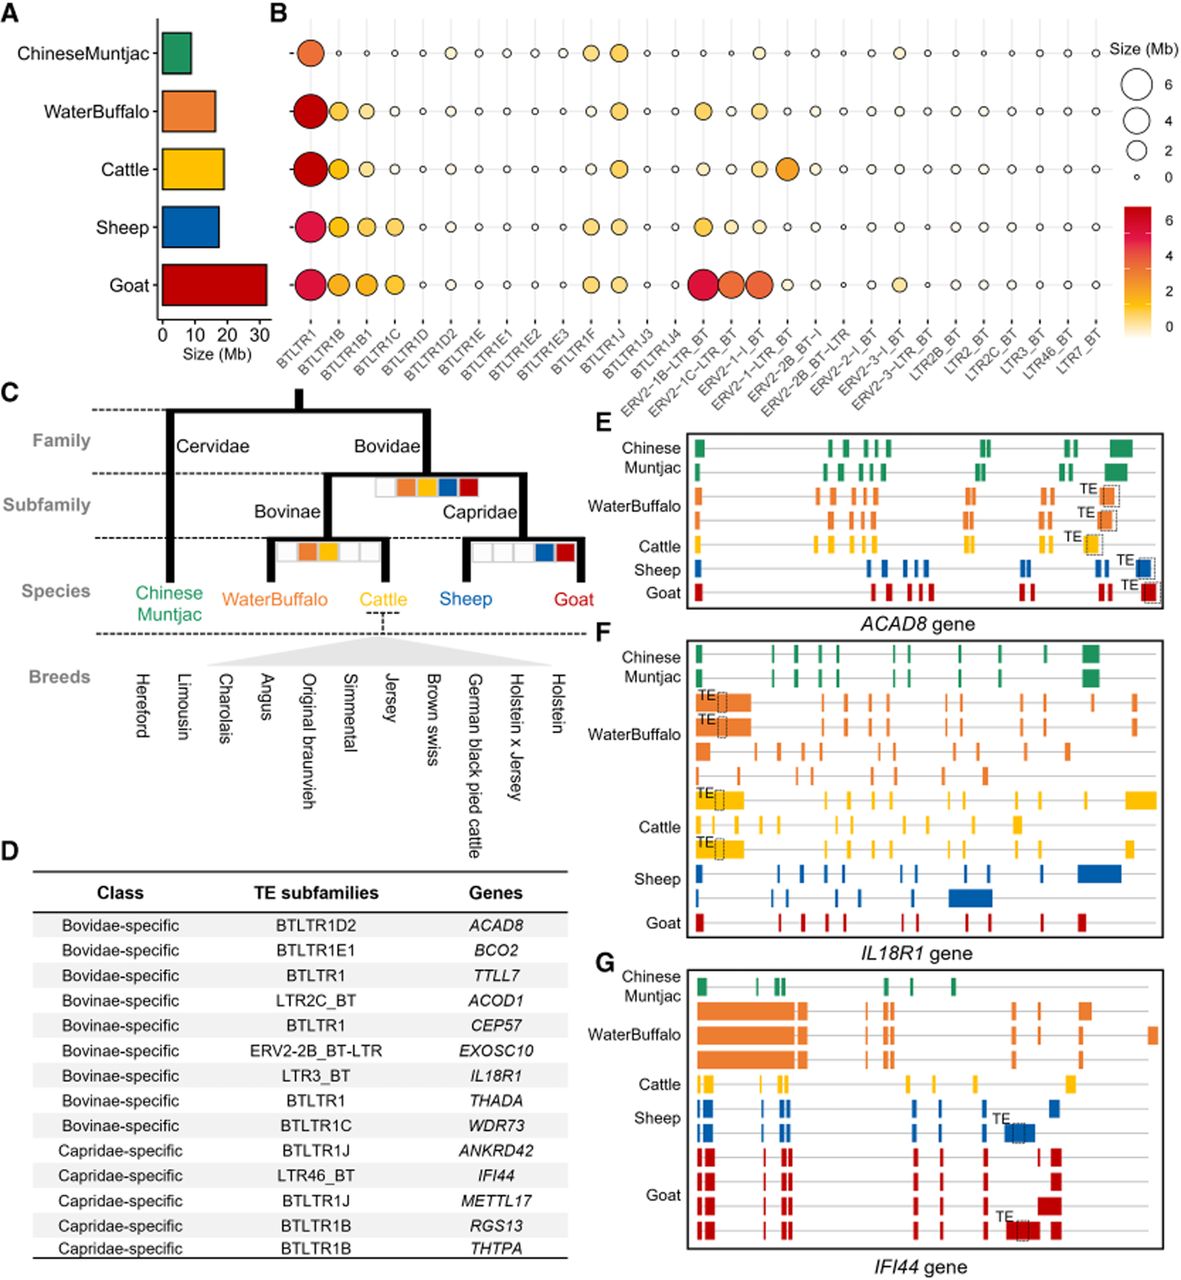
The evolutionary relationships among these species enabled us to classify the taxon-specific TE subfamilies into three distinct categories: Bovidae-specific, Bovinae-specific, and Caprinae-specific (Fig. 6C). Subsequently, we conducted gene annotation of these categorized TE subfamilies to examine TE-driven functional effects throughout various Bovidae evolutionary stages. Our analysis identified 14 genes exhibiting exonization in their coding regions due to these taxon-specific TEs, comprising three Bovidae-specific, six Bovinae-specific, and five Caprinae-specific instances (Fig. 6D; Supplemental Table S8). The taxon-specific TE influenced on these genes predominantly manifested in the first-second exon (28.57%) and the last exon (71.43%). It was worth noting that when identical genes across different species were affected by taxon-specific TEs, the altered exon length and TE subfamily type remained consistent, suggesting that these TEs expanded prior to species differentiation and exerted uniform effects on these genes (Fig. 6D). For instance, regarding Bovidae-specific TEs affecting the ACAD8 gene (Fig. 6E), BTLTR1D2 influenced the last exon, yielding a shorter exon compared to Chinese Muntjac, potentially resulting from TE insertion inducing premature termination. This gene functioned as a mitochondrial enzyme in the catabolism of the branched-chain amino acid valine and correlated with daily gain and beef tenderness in cattle (Li et al. 2007). Additionally, for Bovinae-specific TEs affecting the IL18R1 gene (Fig. 6F), a significant immune regulation gene (Rex et al. 2020), our observations revealed TE insertions in the first exon, with affected transcripts displaying markedly different lengths. Furthermore, Caprinae-specific TEs affecting the IFI44 gene exhibited distinct exonization characteristics compared to other transcripts (Fig. 6G). Research indicates that IFI44 influences the growth and development of Leiqiong cattle (Kong et al. 2020). Significantly, increased IFI44 expression triggered an interferon response, consequently leading to the suppression of MSTN gene expression (Kong et al. 2020).
To explore the potential ongoing activity of taxon-specific TE in species, particularly as it related to environmental adaptation or domestication processes, we implemented a TE polymorphism analysis using cattle as our model system. Our investigation assessed the impact of eight Bovinae-specific TE subfamilies corresponding to C2 k-mer clusters on the cattle genome at the breed level (Fig. 6C). Analysis of 2262 samples across 11 cattle breeds revealed 37,611 structural variants (PanCattle SV project, https://doi.org/10.6084/m9.figshare.28021577), with 59.34% attributable to TEs and 951 SVs specifically associated with Bovinae-specific TE subfamilies (Supplemental Table S9). The data indicated that these SVs predominantly occur at high frequency throughout cattle populations (Supplemental Fig. S7), while demonstrating minimal effects on exonic regions. TE-related SVs affected 204 genes within their gene bodies, with enrichment primarily observed in KEGG pathways related to neurodevelopment, including long-term depression and neurodegeneration (Supplemental Fig. S8). Significantly, TE activity affected the exons of four specific genes: LOC112446473, LOC112442367, LOC100848463, and LOC104975936. Each of these affected genes exhibited first-exon alterations and were associated with endogenous retrovirus group K member Gag polyprotein-like proteins.
Regulatory roles of taxon-specific TEs in ruminants
To assess the regulatory influence of taxon-specific TEs in ruminants, we examined potential TE-derived cis-regulatory elements (CREs). Given its comprehensive epigenetic annotations across 16 tissues (Liu et al. 2022), the cattle genome was selected as the optimal representative model for ruminants. We performed an analysis of TE catalog enrichment from various age groups within different regulatory regions (Fig. 7A). Our findings indicated that the majority of TEs had lower levels of these epigenetic marks compared to other genomic regions. Whereas this lower signal in younger TEs may be partially attributed to reduced sequence mappability within these highly repetitive regions, older TEs demonstrated a higher likelihood of enrichment relative to their younger counterparts. This pattern indicated that recently evolved TEs tend to minimize their genomic impact on the host, which corresponds with our previous research findings in porcine studies (Zhao et al. 2023a).
Epigenetic regulation of recent TEs in ruminants. (A) Distribution of TE enrichment across epigenetic markers. Box plot illustrates systematic enrichment patterns of eight TE families relative to five functionally distinct epigenetic markers (ATAC, H3K27ac, H3K4me1, H3K4me3, and H3K27me3). Peaks signify genomic regions where TEs colocalize with active/repressive marks, suggesting TE roles in regulatory elements. Significance levels: (*) P-value < 0.05, (**) P-value < 0.01, (***) P-value < 0.001. (B) Contribution of TE-derived CREs by functional class. Bar plot quantifies the percentage of TE-derived CREs within distinct functional annotations (y-axis: e.g., enhancers, promoters, insulators, and repressed regions). The x-axis spans 0%–100%, revealing TEs’ preferential contribution to specific regulatory classes. (C) Tissue specificity of TE-derived versus all CREs. Grouped bar plot compares the distribution of all CREs (red fill) and TE-derived CREs (blue fill) across tissues. (D) Tissue-gene association of TE-derived CREs. Heat map shows rows: genes with TE-derived CREs; columns: tissues. Red = CRE presence; white = CRE absence. (E) ERVK-derived TFBSs. Left: Bar plot showing TFBS counts (y-axis) for key transcription factors within ERVK-derived CREs. Right: Proportional bar plot depicting the genomic context of ERVK TFBSs.
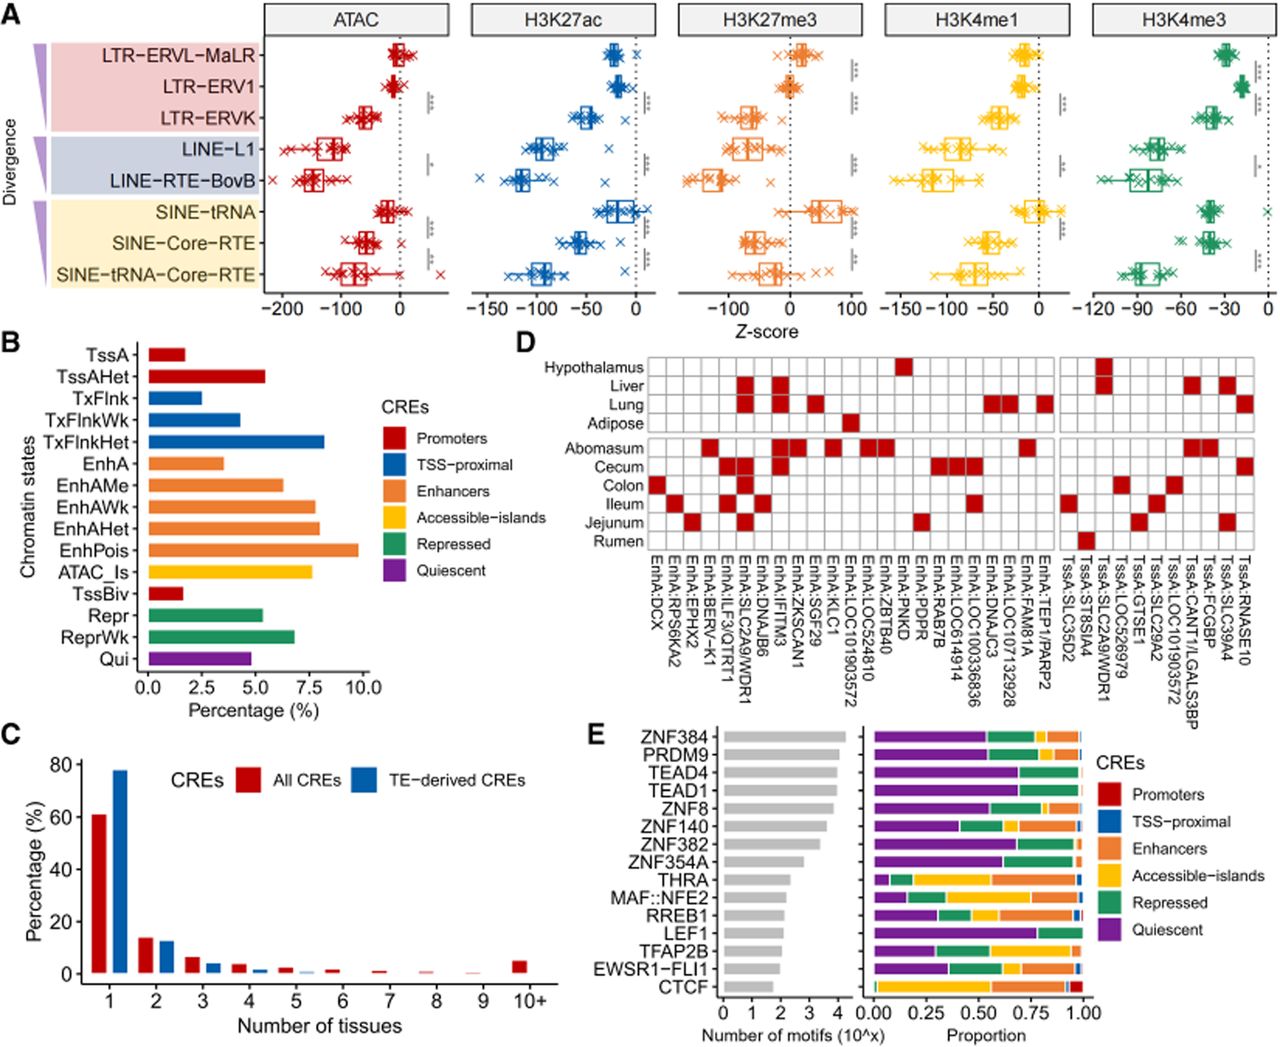
We characterized TE-derived CREs as sequences where a minimum of 50% originated from a singular annotated TE. This methodology revealed that TEs constitute ∼6.39% (469,286/7,340,427) of all cattle CREs. Analysis by annotation type demonstrates that TE contribution varied significantly, ranging from 2.49% in H3K4me3 to 8.11% in ATAC. Regarding epigenetic states, TEs comprise 7.04% of promoters and enhancers, with comparatively lower percentages—1.77% and 3.57%—associated with active transcription start sites (TssAs) and active enhancers (EnhAs), respectively (Fig. 7B). TE-derived CREs exhibited greater tissue specificity compared to all cattle CREs, with 91.04% manifesting in fewer than three tissues, whereas only 1.59% were identified across more than five tissues (Fig. 7C). This finding aligned with previous reports indicating that TEs contribute to tissue-specific regulatory elements in humans (Ali and Liang 2024). Despite the general depletion of TEs in CREs—particularly the Bovinae-specific subfamily within the LTR/ERVK family, which accounted for only 1.42% of TE-derived CREs—our investigation identified 1645 Bovinae-specific TE-derived CREs associated with promoter and enhancer regions, including 11 at TssAs and 23 at EnhAs (Fig. 7D). Significantly, the predominant portion of these TE-derived TssAs and EnhAs (79.41%) were associated with digestive tissues, primarily in the abomasum and cecum (Supplemental Table S10).
We conducted motif scanning for CREs derived from TEs to examine how TE-embedded sequences function as TFBSs. The analysis identified 105 TE-derived TFBSs (Q-value < 0.01) associated with 109 subfamilies across eight TE families. Consistent with TE enrichment patterns in epigenetic marks, TE-derived TFBSs demonstrated higher prevalence in older TE families compared to younger ones (Supplemental Fig. S9). The proportion of TEs contributing to TFBSs varied substantially, ranging from 6.67% in LTR-ERVK to 51.43% in LINE-L1. These TE-sequence TFBSs were predominantly located in quiescent and repressed regions, exhibited limited association with promoters, and primarily displayed repressive functional states (Fig. 7E). Notably, certain TFBSs including THRA and NFE2 showed greater association with accessible islands and enhancers.
Discussion
This study presents the first comprehensive annotation of the KZFP family in ruminant TEs, identifying an average of 271 KZFP isoforms characterized by their zinc finger, KRAB, and SCAN domains. To validate the annotation pipeline, we applied it to KZFPs in the human genome, successfully annotating 298 of 350 previously documented human KZFPs (85.14%), thereby confirming the reliability of our approach for ruminant species (Supplemental Table S11). Notably, our annotation framework distinguishes between KZFP proteins and their specific isoforms, revealing that apparent lineage-specific losses, such as for ZNF182, often represent the expansion of particular isoforms in certain clades rather than broad gene loss events. The distribution patterns of the KZFP family across ruminant genomes align well with established evolutionary relationships. We observe that the taxon-specific expansion of KZFPs not only validates our annotation methodology but also facilitates the examination of KZFP-TE coevolutionary processes. To gain deeper insights into ruminant TE relationships, we employed global de novo assembly utilizing LongRepMarker for TE consensus sequence detection, as opposed to utilizing conventional conserved TE sequences from standard databases (specifically Repbase and Dfam). This methodological approach yields more precise species-specific TE sequences. Through our comparative examination of TE family distributions across ruminant genomes, we have determined that, whereas predominant TE families maintain relatively stable levels across species, specific minor families—notably ERVK subfamilies—exhibit marked interspecies variability. The resulting 21% genome coverage, lower than the ∼50% typically reported in RepBase-based studies, reflects our more stringent filtering for well-annotated TE consensus sequences (>100 bp) to ensure k-mer analysis precision.
When comparing TE expansion patterns among ruminant species, a major challenge arose: the heterogeneity in TE family expansions across species, combined with sequence variation within TE subfamilies, hindered direct comparative analysis. To address this, we developed and applied an improved k-mer-based approach that effectively segments TE sequences, distinguishing conserved from species‐specific TEs. Using this k-mer strategy, we conducted quantitative analyses of evolutionary relationships across multiple ruminant genomes. The results confirmed the method's effectiveness in species differentiation, corroborating established evolutionary relationships and enabling accurate classification at both family and species levels based on TE k-mer sequences.
To address the potential ambiguity between lineage-specific TE gains and losses—a limitation raised in our initial analysis with only Pronghorn as an outgroup—we applied the k-mer framework using two nonruminant outgroups: human and pig. This comparative approach was designed to validate the accuracy of our k-mer strategy by clearly distinguishing conserved TEs from those specifically acquired in the ruminant lineage. The k-mer-based hierarchical clustering across all species (Supplemental Fig. S10) visually confirms the lineage-specific expansion of these TEs in ruminants, thereby supporting the robustness of our original evolutionary interpretation. Therefore, our evidence indicates that TE k-mer sequences serve as reliable proxies for TE conserved sequences when examining the evolutionary relationship between TEs and the KZFP family.
Our analysis of TE k-mer clustering patterns in ruminant genomes revealed distinct enrichment profiles across various TE families and subfamilies. The analysis identified multiple taxon-specific TE k-mer clusters. Evidence indicated that Bovidae family-specific TE k-mer clusters correlated significantly with LTR2_BT, LTR2B_BT, and LTR2C_BT, whereas Cervidae family-specific TE k-mer clusters demonstrated a clear association with BTLTR1E1. Additionally, Bovinae family-specific TE k-mer clusters exhibited significant correlations with eight ERVK subfamilies. These results provided valuable insights into the complex evolutionary relationships between TE families and subfamilies within ruminant genomes, highlighting distinct patterns of genomic expansion across different TE families. Through systematic comparison of TE k-mer cluster expansion patterns and KZFP family distribution across ruminant species, we have identified specific KZFPs that appeared to have coevolved with particular TE k-mer clusters. Notably, a greater number of KZFPs demonstrated association with taxon-specific TEs, potentially attributable to the enhanced activity observed in these taxon-specific elements.
Studies have demonstrated that KZFPs interact with TE sequences through binding mechanisms. In our study, we employed TFBS matrices from the JASPAR 2024 database and the KZFP motifs prediction model (B1H-RC model) to assess this relationship in ruminants. Given the current lack of tissue-specific H3K9me3 ChIP-seq data for most ruminants, our use of the B1H-RC model and k-mer enrichment serves as a robust computational proxy for identifying potential repressive regulatory interactions. Our examination of coevolving KZFP transcription binding sites across various TE k-mer clusters indicated that most TEs contain corresponding TFBS. When analyzing TE subfamilies that share sequence similarities but show enrichment in different TE k-mer clusters, we observed a notable correlation between KZFP binding motif reliability and their coevolutionary patterns with TE k-mer clusters. This finding suggests increased sequence binding reliability between TEs and their predicted coevolving KZFPs. Our findings confirmed that the C2 cluster displays expected binding characteristics in comparison to the C3 cluster. These outcomes provide support for the binding mechanism between KZFPs and TEs, enhancing our understanding of TE sequence specificity through KZFPs in ruminants.
We utilized TE k-mers to identify taxon-specific TE subfamilies that emerged during various stages of ruminant family evolution. We systematically classified LTR/ERVK TE families into Bovidae-specific, Bovinae-specific, or Caprinae-specific categories to investigate how TE formation influences genomic functional regions. Analysis revealed that these taxon-specific TEs play a significant role in functional evolution through exonization in 14 genes. This process primarily affects the last exon (71.43%) and less frequently the first-second exon (28.57%). We speculate that this 3′ bias is driven by cryptic polyadenylation signals within TEs and lower selective pressure on terminal exons, which avoids disrupting upstream protein-coding frames. Notable examples include ACAD8 (associated with growth and tenderness in cattle), IL18R1 (involved in immune function), and IFI44 (regulates growth through MSTN suppression). Using cattle as a model organism, we determined that TEs contribute to numerous SVs occurring at high frequency in modern cattle populations, thus enhancing genetic diversity. Several of these diversity-contributing SVs are located within genes, with four gene formations specifically linked to young ERVK subfamilies. Regarding regulatory functions, our findings indicate that certain taxon-specific TEs overlap with promoter and enhancer regions, although TEs have a relatively limited role as cis-regulatory elements (∼6.39%). Notably, these TEs exhibiting tissue-specific and functional characteristics show preferential enrichment in digestive tissue. Additionally, TE-embedded sequences serve as TFBSs, predominantly in repressive regulatory regions. Future experimental validation, such as ChIP-exo in cattle, will be essential to further substantiate these predicted interactions and their tissue-specific functional roles.
In summary, our study introduced the novel TE k-mer methodology, offering a thorough analysis of TE evolution patterns in ruminants. Our systematic annotation and comparative analysis of the KZFPs family identified key coevolutionary relationships, which were subsequently confirmed through TFBS analysis. Additionally, we performed a comprehensive assessment of how taxon-specific families affect genomic variation, gene structure, CREs, and TFBSs. These findings enhance our knowledge of TE formation, regulation, and functional evolution in ruminants while shedding light on the complex mechanisms of TE-genome coevolution.
Methods
Annotation of KZFPs in ruminant genomes
Thirty-two high-quality ruminant genomes were obtained from the Ruminant Genome Database (http://animal.omics.pro/code/index.php/RGD). To establish a robust foundation for KZFP identification, representative template protein sequences were curated from the NCBI annotations of three comprehensively annotated ruminant species—cattle (Bos taurus, assembly ARS-UCD1.2), sheep (Ovis aries, assembly ARS-UI_Ramb_v3.0), and goat (Capra hircus, assembly ARS1.2)—alongside the human reference genome (Homo sapiens, assembly GRCh38).
We established a KZFP database for each of the 32 ruminant species utilizing makeblastdb (Altschul et al. 1990) (v2.5.0), drawing from template protein sequences of all potential KZFP proteins. Subsequently, we conducted preliminary protein localization analysis across each ruminant genome employing BLASTN (Altschul et al. 1990) (v2.5.0). For identified localizations, we defined candidate KZFP regions by extending sequences 10 kb in both upstream and downstream directions. To ensure precision, we implemented Exonerate (Slater and Birney 2005) (v2.2.0) to perform detailed protein localization analysis on these regions for KZFP structural annotation, applying the following parameters: “‐‐model est2genome ‐‐querytype dna ‐‐targettype dna ‐‐showvulgar no ‐‐softmaskquery no ‐‐softmasktarget yes ‐‐showalignment no ‐‐showtargetgff yes ‐‐showcigar no ‐‐score 30 ‐‐bestn 1 ‐‐percent 50”.
We performed a comprehensive domain architecture analysis focusing on key KZFP-associated domains (C2H2 zinc finger, KRAB, SCAN, and DUF3669) using HMMER v3.1b2-icc-14.0.2 (Potter et al. 2018). The analysis utilized calibrated profile hidden Markov models (HMMs) from the Pfam database (Mistry et al. 2021) (models: PF00096 for ZNF_C2H2, PF01352 for KRAB, PF02023 for SCAN, PF12417 for DUF3669). We applied specific score thresholds to ensure accuracy: ZNF_C2H2: 0 (per domain), KRAB: 13, SCAN: 10, DUF3669: 21. To identify putative KZFP isoforms, we conducted proximity analysis by examining genomic loci for instances where KRAB domain-containing proteins were located near C2H2 zinc finger domain arrays (typically within 5–10 kb on the same scaffold). Proteins exhibiting this KRAB-ZNF structural arrangement were designated as candidate KZFPs.
Annotation and classification of TE family
To comprehensively characterize TE sequences within ruminant genomes, we implemented an integrated dual-methodology framework combining de novo discovery with homology-based classification. Initially, de novo prediction was executed using LongRepMarker (v2.0) (Liao et al. 2021), leveraging its optimized algorithms to identify novel repeats without a priori references. Subsequently, a homology-based classification phase was performed by cross-referencing all putative repeats against the Repbase (v26.12) database, applying stringent 80-80 criteria (≥80% sequence identity over ≥80% of the repeat length) to taxonomically classify conserved repeats and filter false positives. The de novo-derived repeat libraries, augmented with Repbase-validated annotations, were then utilized to mask repetitive regions across each ruminant genome assembly via RepeatMasker (v4.1.5) (Tarailo-Graovac and Chen 2009), employing default parameters with RMblastn (Altschul et al. 1990) as the alignment engine.
k-mer-based TE evolution analysis
k-mer-based TE analysis began with systematic organization and classification of TE sequences across ruminant species. We conducted this process through sequence alignments against established TE reference databases using BLASTN (v2.5.0) (Altschul et al. 1990). To identify the optimal k-mer length, we performed a comprehensive spectrum distribution analysis across a range from k = 5 to k = 200 using ntCard (v1.2.2) (Mohamadi et al. 2017). This evaluation determined k = 42 as the optimal length, representing maximum k-mer abundance.
We used Jellyfish (v2.2.10) (Marçais and Kingsford 2011) to count all possible 42 k-mers within the consolidated ruminant TE sequences, creating a comprehensive TE-derived k-mer data set. To focus on biologically significant signals, we extracted the 1000 most abundant k-mers for each TE subfamily, requiring each selected k-mer to appear in at least one representative species within the subfamily to ensure broad taxonomic representation.
We quantified these representative TE k-mers across all ruminant genomes using BWA (v0.7.17-r1188) (Li and Durbin 2009) in “aln” alignment mode. This produced a structured k-mer count matrix—with rows representing species and columns representing TE subfamily-specific k-mers—that served as our foundation for subsequent analyses. For phylogenetic relationship analysis based on TE k-mer profiles, we calculated a Manhattan distance matrix from the normalized k-mer counts and applied hierarchical clustering analysis (hclust function in R). Additionally, to examine TE expansion dynamics over time, we conducted hierarchical clustering specifically on TE families grouped by their estimated evolutionary age, defined by sequence divergence levels from RepeatMasker outputs.
Finally, to identify patterns within the k-mer space, we applied k-means clustering (kmeans function in R) to the complete set of 38,451 identified TE k-mers based on their distribution profiles across all ruminant species. This grouped k-mers with similar cross-species distribution patterns regardless of their original TE subfamily classification. We calculate the ratio of specific k-mer clustering in each species by dividing the number of k-mers from a particular k-mer clustering present in that species by the total number of k-mers in that clustering.
TE-KZFP interactions analysis
To comprehensively identify DNA-binding sites, we employed an integrated approach combining database mining and de novo motif prediction. For established motif references, we retrieved 25 experimentally unvalidated TFBS profiles for KZFP from the JASPAR 2024 database (Supplemental Table S12). We then generated 78 additional DNA-binding motifs through computational prediction using the B1H-RC model (http://zifrc.ccbr.utoronto.ca/), which leverages protein sequence information from tandem zinc finger domains to infer binding specificities. All 130 combined motifs were scanned against TE-derived k-mer sequences using the FIMO tool (Grant et al. 2011) (version 4.11.2) from the MEME Suite (Bailey et al. 2015). This scanning was performed with default parameters and a significance threshold of P-value < 0.01 (‐‐thresh 0.01), enabling genome-wide detection of putative binding sites.
Gene annotation
To comprehensively annotate all identified TE locations and elucidate their potential functional impacts, we utilized ANNOVAR (Wang et al. 2010) (version 20221005) for gene-centric annotation. This analysis integrated multispecies genome annotations from five ruminant lineages: Chinese muntjac (Muntiacus reevesi, GCA_028583565.1), water buffalo (Bubalus bubalis, GCF_019923935.1), cattle (Bos taurus, GCF_002263795.1), sheep (Ovis aries, GCF_016772045.2), and goat (Capra hircus, GCF_001704415.2). Each species'annotation file provided a hierarchical genomic context, enabling precise categorization of TE positions relative to functional regions. Specifically, we extracted: (1) exonic regions (further stratified by synonymous/nonsynonymous effects); (2) splicing sites (±2 bp boundaries); (3) intronic regions; (4) 5′ and 3′ untranslated regions (UTRs); (5) regulatory regions (1 kb upstream/downstream of transcription start/end sites); and (6) intergenic regions.
KEGG enrichment analysis
We performed KEGG enrichment analysis on genes associated with SVs derived from TE polymorphism utilizing Metascape (Karnovsky et al. 2012). For the KEGG pathway enrichment analysis, we employed cattle gene IDs mapped against a comprehensive cattle gene background list after completing the necessary ID conversion process.
Definition of cis-regulatory elements
To comprehensively annotate TEs in the cattle genome, we leveraged five key epigenetic markers—ATAC-seq, H3K27ac, H3K27me3, H3K4me1 and H3K4me3—across 16 biologically diverse tissue samples derived from the Cattle functional annotation (Fang et al. 2019). These markers were systematically integrated using a unified computational pipeline to characterize chromatin accessibility, active transcription, repressive domains, and enhancer signatures. Building on established chromatin state segmentation frameworks by ChromHMM (Ernst and Kellis 2017), 15 distinct functional states were decoded through combinatorial patterns of these epigenetic signals. Promoter-associated chromatin states comprise three subtypes: TssA (active promoters with strong transcription); TssAHet (flanking active transcription start sites lacking ATAC-seq signal); and TssBiv (bivalent promoters). Enhancers were subdivided into five states: EnhA (strong active enhancers); EnhAMe (medium enhancers with ATAC-seq signal); EnhAWk (weak active enhancers); EnhAHet (active enhancers without ATAC-seq signal); and EnhPois (poised enhancers). Transcription start site (TSS)-proximal regions included TxFlnk (transcribed regions at gene bodies), TxFlnkWk (weakly transcribed regions), and TxFlnkHet (transcribed regions lacking ATAC-seq signal). The remaining states comprised Repr (repressed heterochromatin), ReprWk (weakly repressed regions), and Qui (quiescent/inactive regions).
Permutation test of TEs in functional regions
To comprehensively assess the enrichment patterns of specific TE families within distinct functional genomic regions, we employed a rigorous permutation-based statistical framework. This approach systematically evaluates whether the observed spatial association between TEs and functional annotations (e.g., promoters, enhancers, or repressive domains) exceeds random expectation. For each TE family, we conducted this analysis independently using the regionR (Gel et al. 2016) package (v1.34.0) in R (R Core Team 2011), leveraging its built-in functions for permutation, null modeling, and significance estimation. The permutation count (n = 100) was validated through saturation analysis to ensure stable Z-score estimation.
TFBS scanning on TE sequences
TE sequences from the cattle reference genome were extracted to identify TFBS within the TE sequences. Then, the FIMO software (Grant et al. 2011) (version 4.11.2), part of the MEME Suite (Bailey et al. 2015), was used to scan for TFBS occurrences across these sequences. The FIMO results with motif information, using the 841 validated transcription factors (TFs), were annotated from the Vertebrate JASPAR 2024 database (Castro-Mondragon et al. 2022) (https://jaspar.elixir.no/). Eighty-eight unvalidated TFBS for KZFPs were used to predict the protein-DNA sequence binding. The FIMO software parameters were set to: P-value = 1 × 10− 4, ‐‐max-stored-scores 100000000, and ‐‐alpha = 1.
Ethics statement
The experimental data acquisition in this study strictly complied with the relevant provisions of the “Regulations for the Administration of Laboratory Animals” (March 2017 revision) of the Ministry of Science and Technology of China.
Sources of published data sets
The genome accession records from previous publications are accessible through the RGD database (http://animal.omics.pro/code/index.php/RGD). The genomic annotation files were obtained from the NCBI Genome database (https://www.ncbi.nlm.nih.gov/home/genomes/) for the following species: Chinese muntjac (GCA_028583565.1), water buffalo (GCF_019923935.1), cattle (GCF_002263795.1), sheep (GCF_016772045.2), and goat (GCF_001704415.2). Cattle genetic variation data, comprising 37,611 SVs, were obtained from 2262 samples across 11 populations in our previous PanCattle SV project (figshare: https://doi.org/10.6084/m9.figshare.28021577) and the GitHub repository (https://github.com/PengjuZ/CattleSV).
Code availability
All software and their respective versions used in this study are publicly available, as described in the Methods section. The pipeline for KZFP annotation, de novo TE annotation, and k-mer-based TE analysis is available at GitHub (https://github.com/PengjuZ/RuminantTE) and as Supplemental Code.
Data access
The TE k-mer matrix from this study is available at GitHub (https://github.com/PengjuZ/RuminantTE) and in the Supplemental Data.
Competing interest statement
The authors declare no competing interests.
Acknowledgments
This work is financially supported by the National Natural Science Foundation of China General Program (32370678), Research Startup Funding from Hainan Institute of Zhejiang University (HZY20210401), and High-performance Computing Platform of YZBSTCACC.
Author contributions: P.Z., Z.W., and L.F. conceived and designed the experiments. P.Z. designed an analytical strategy and performed all analyses. J.H. and C.P. assisted in the bioinformatics analysis. Y.Z. and C.W. collected data for sequencing. P.Z., Z.W., L.F., and D.Y. wrote and revised the paper. All authors read and approved the final manuscript.
Notes
[1] Supplementary material [Supplemental material is available for this article.]
[2] Article published online before print. Article, supplemental material, and publication date are at https://www.genome.org/cgi/doi/10.1101/gr.281289.125.
References
- ↵Ali A, Liang P. 2024. Transposable elements contribute to tissue-specific gene regulation in humans. Genes Genomics 46: 1327–1343. 10.1007/s13258-024-01550-6
- ↵Altschul SF, Gish W, Miller W, Myers EW, Lipman DJ. 1990. Basic local alignment search tool. J Mol Biol 215: 403–410. 10.1016/S0022-2836(05)80360-2
- ↵Arkhipova IR. 2018. Neutral theory, transposable elements, and eukaryotic genome evolution. Mol Biol Evol 35: 1332–1337. 10.1093/molbev/msy083
- ↵Bailey TL, Johnson JE, Grant CE, Noble WS. 2015. The MEME suite. Nucleic Acids Res 43: W39–W49. 10.1093/nar/gkv416
- ↵Bao W, Kojima K, Kohany O. 2015. Repbase update, a database of repetitive elements in eukaryotic genomes. Mob DNA 6: 11. 10.1186/s13100-015-0041-9
- ↵Bourque G, Burns KH, Gehring M, Gorbunova V, Seluanov A, Hammell MG, Imbeault M, Izsvák Z, Levin HL, Macfarlan TS, 2018. Ten things you should know about transposable elements. Genome Biol 19: 199. 10.1186/s13059-018-1577-z
- ↵Castro-Mondragon JA, Riudavets-Puig R, Rauluseviciute I, Berhanu Lemma R, Turchi L, Blanc-Mathieu R, Lucas J, Boddie P, Khan A, Manosalva Perez N, 2022. JASPAR 2022: the 9th release of the open-access database of transcription factor binding profiles. Nucleic Acids Res 50: D165–D173. 10.1093/nar/gkab1113
- ↵Chen L, Qiu Q, Jiang Y, Wang K, Lin Z, Li Z, Bibi F, Yang Y, Wang J, Nie W, 2019. Large-scale ruminant genome sequencing provides insights into their evolution and distinct traits. Science 364: eaav6202. 10.1126/science.aav6202
- ↵Chen S, Liu S, Shi S, Jiang Y, Cao M, Tang Y, Li W, Liu J, Fang L, Yu Y, 2022. Comparative epigenomics reveals the impact of ruminant-specific regulatory elements on complex traits. BMC Biol 20: 273. 10.1186/s12915-022-01459-0
- ↵de Tribolet-Hardy J, Thorball CW, Forey R, Planet E, Duc J, Coudray A, Khubieh B, Offner S, Pulver C, Fellay J, 2023. Genetic features and genomic targets of human KRAB-zinc finger proteins. Genome Res 33: 1409–1423. 10.1101/gr.277722.123
- ↵Ecco G, Cassano M, Kauzlaric A, Duc J, Coluccio A, Offner S, Imbeault M, Rowe HM, Turelli P, Trono D. 2016. Transposable elements and their KRAB-ZFP controllers regulate gene expression in adult tissues. Dev Cell 36: 611–623. 10.1016/j.devcel.2016.02.024
- ↵Ernst J, Kellis M. 2017. Chromatin-state discovery and genome annotation with ChromHMM. Nat Protoc 12: 2478–2492. 10.1038/nprot.2017.124
- ↵Fang L, Liu S, Liu M, Kang X, Lin S, Li B, Connor EE, Baldwin RL 6th, Tenesa A, Ma L, 2019. Functional annotation of the cattle genome through systematic discovery and characterization of chromatin states and butyrate-induced variations. BMC Biol 17: 68. 10.1186/s12915-019-0687-8
- ↵Farré M, Kim J, Prokuryakova AA, Zhang Y, Kulemzina AI, Li Q, Zhou Z, Xiong Y, Johnson JL, Perelman PL, 2019. Evolution of gene regulation in ruminants differs between evolutionary breakpoint regions and homologous synteny blocks. Genome Res 29: 576–589. 10.1101/gr.239863.118
- ↵Fu W, Wang R, Nanaei HA, Wang J, Hu D, Jiang Y. 2022. RGD v2.0: a major update of the ruminant functional and evolutionary genomics database. Nucleic Acids Res 50: D1091–D1099. 10.1093/nar/gkab887
- ↵Fueyo R, Judd J, Feschotte C, Wysocka J. 2022. Roles of transposable elements in the regulation of mammalian transcription. Nat Rev Mol Cell Biol 23: 481–497. 10.1038/s41580-022-00457-y
- ↵Gel B, Díez-Villanueva A, Serra E, Buschbeck M, Peinado MA, Malinverni R. 2016. Regioner: an R/Bioconductor package for the association analysis of genomic regions based on permutation tests. Bioinformatics 32: 289–291. 10.1093/bioinformatics/btv562
- ↵Grant CE, Bailey TL, Noble WS. 2011. FIMO: scanning for occurrences of a given motif. Bioinformatics 27: 1017–1018. 10.1093/bioinformatics/btr064
- ↵Helleboid P-Y, Heusel M, Duc J, Piot C, Thorball CW, Coluccio A, Pontis J, Imbeault M, Turelli P, Aebersold R, 2019. The interactome of KRAB zinc finger proteins reveals the evolutionary history of their functional diversification. EMBO J 38: e101220. 10.15252/embj.2018101220
- ↵Hill R, Smith D, Canning G, Grey M, Hammond-Kosack KE, McMullan M. 2025. Starship giant transposable elements cluster by host taxonomy using k-mer-based phylogenetics. G3 (Bethesda) 15: jkaf082. 10.1093/g3journal/jkaf082
- ↵Imbeault M, Helleboid P-Y, Trono D. 2017. KRAB zinc-finger proteins contribute to the evolution of gene regulatory networks. Nature 543: 550–554. 10.1038/nature21683
- ↵Karnovsky A, Weymouth T, Hull T, Tarcea VG, Scardoni G, Laudanna C, Sartor MA, Stringer KA, Jagadish HV, Burant C, 2012. Metscape 2 bioinformatics tool for the analysis and visualization of metabolomics and gene expression data. Bioinformatics 28: 373–380. 10.1093/bioinformatics/btr661
- ↵Kong L, Liu G, Deng M, Lian Z, Han Y, Sun B, Guo Y, Lie D, Li Y. 2020. Growth retardation-responsive analysis of mRNAs and long noncoding RNAs in the liver tissue of Leiqiong cattle. Sci Rep 10: 14254. 10.1038/s41598-020-71206-4
- ↵Lanciano S, Cristofari G. 2020. Measuring and interpreting transposable element expression. Nat Rev Genet 21: 721–736. 10.1038/s41576-020-0251-y
- ↵Li H, Durbin R. 2009. Fast and accurate short read alignment with Burrows–Wheeler transform. Bioinformatics 25: 1754–1760. 10.1093/bioinformatics/btp324
- ↵Li H, Xu S, Gao X, Ren H. 2007. Structure of the bovine ACAD8 gene and the association of its polymorphism with the production traits. J Genet Genomics 34: 315–320. 10.1016/s1673-8527(07)60033-2
- ↵Liao X, Li M, Hu K, Wu F-X, Gao X, Wang J. 2021. A sensitive repeat identification framework based on short and long reads. Nucleic Acids Res 49: e100. 10.1093/nar/gkab563
- ↵Liu S, Gao Y, Canela-Xandri O, Wang S, Yu Y, Cai W, Li B, Xiang R, Chamberlain AJ, Pairo-Castineira E, 2022. A multi-tissue atlas of regulatory variants in cattle. Nat Genet 54: 1438–1447. 10.1038/s41588-022-01153-5
- ↵Machnik M, Cylwa R, Kielczewski K, Biecek P, Liloglou T, Mackiewicz A, Oleksiewicz U. 2019. The expression signature of cancer-associated KRAB-ZNF factors identified in TCGA pan-cancer transcriptomic data. Mol Oncol 13: 701–724. 10.1002/1878-0261.12407
- ↵Marçais G, Kingsford C. 2011. A fast, lock-free approach for efficient parallel counting of occurrences of k-mers. Bioinformatics 27: 764–770. 10.1093/bioinformatics/btr011
- ↵Mistry J, Chugaransky S, Williams L, Qureshi M, Salazar G, Sonnhammer ELL, Tosatto SCE, Paladin L, Raj S, Richardson L, 2021. Pfam: the protein families database in 2021. Nucleic Acids Res 49: D412–D419. 10.1093/nar/gkaa913
- ↵Mohamadi H, Khan H, Birol I. 2017. ntCard: a streaming algorithm for cardinality estimation in genomics data. Bioinformatics 33: 1324–1330. 10.1093/bioinformatics/btw832
- ↵Najafabadi HS, Mnaimneh S, Schmitges FW, Garton M, Lam KN, Yang A, Albu M, Weirauch MT, Radovani E, Kim PM, 2015. C2h2 zinc finger proteins greatly expand the human regulatory lexicon. Nat Biotechnol 33: 555–562. 10.1038/nbt.3128
- ↵Platt RN, Vandewege MW, Ray DA. 2018. Mammalian transposable elements and their impacts on genome evolution. Chromosome Res 26: 25–43. 10.1007/s10577-017-9570-z
- ↵Pontis J, Pulver C, Playfoot CJ, Planet E, Grun D, Offner S, Duc J, Manfrin A, Lutolf MP, Trono D. 2022. Primate-specific transposable elements shape transcriptional networks during human development. Nat Commun 13: 7178. 10.1038/s41467-022-34800-w
- ↵Potter S, Luciani A, Eddy SR, Park YM, Lopez R, Finn RD. 2018. HMMER web server: 2018 update. Nucleic Acids Res 46: W200–W204. 10.1093/nar/gky448
- ↵R Core Team. 2011. R: a language and environment for statistical computing. R Foundation for Statistical Computing, Vienna. https://www.R-project.org/.
- ↵Rex DAB, Agarwal N, Keshava Prasad TS, Kandasamy RK, Subbannayya Y, Pinto SM. 2020. A comprehensive pathway map of IL-18-mediated signalling. J Cell Commun Signal 14: 257–266. 10.1007/s12079-019-00544-4
- ↵Senft AD, Macfarlan TS. 2021. Transposable elements shape the evolution of mammalian development. Nat Rev Genet 22: 691–711. 10.1038/s41576-021-00385-1
- ↵Slater GSC, Birney E. 2005. Automated generation of heuristics for biological sequence comparison. BMC Bioinformatics 6: 31. 10.1186/1471-2105-6-31
- ↵Storer JM, Hubley R, Rosen JR, Wheeler TJ, Smit AFA. 2021. The Dfam community resource of transposable element families, sequence models, and genome annotations. Mob DNA 12: 2. 10.1186/s13100-020-00230-y
- ↵Tang L, Swedlun B, Dupont S, Harland C, Moreira GCM, Durkin K, Artesi M, Mullaart E, Sartelet A, Karim L, 2024. GWAS reveals determinants of mobilization rate and dynamics of an active endogenous retrovirus of cattle. Nat Commun 15: 2154. 10.1038/s41467-024-46434-1
- ↵Tarailo-Graovac M, Chen N. 2009. Using RepeatMasker to identify repetitive elements in genomic sequences. Curr Protoc Bioinformatics Chapter 4: Unit 4.10. 10.1002/0471250953.bi0410s05
- ↵Wang K, Li M, Hakonarson H. 2010. ANNOVAR: functional annotation of genetic variants from high-throughput sequencing data. Nucleic Acids Res 38: e164. 10.1093/nar/gkq603
- ↵Wu Q, Xu J, Zeng J, Wang Y, Yang P. 2025. Exploration of evolutionary mechanisms shaping KZFP and retrotransposon interactions. Sci Bull 70: 328–332. 10.1016/j.scib.2024.07.023
- ↵Xia B, Zhang W, Zhao G, Zhang X, Bai J, Brosh R, Wudzinska A, Huang E, Ashe H, Ellis G, 2024. On the genetic basis of tail-loss evolution in humans and apes. Nature 626: 1042–1048. 10.1038/s41586-024-07095-8
- ↵Yang B, Fang L, Gao Q, Xu C, Xu J, Chen Z, Wang Y, Yang P. 2022. Species-specific KRAB-ZFPs function as repressors of retroviruses by targeting PBS regions. Proc Natl Acad Sci 119: e2119415119. 10.1073/pnas.2119415119
- ↵Zhao P, Gu L, Gao Y, Pan Z, Liu L, Li X, Zhou H, Yu D, Han X, Qian L, 2023a. Young SINEs in pig genomes impact gene regulation, genetic diversity, and complex traits. Commun Biol 6: 894. 10.1038/s42003-023-05234-x
- ↵Zhao P, Chen P, Fang L, Wang Z, Liu GE. 2023b. Taming transposable elements in livestock and poultry: a review of their roles and applications. Genet Sel Evol 55: 50. 10.1186/s12711-023-00821-2