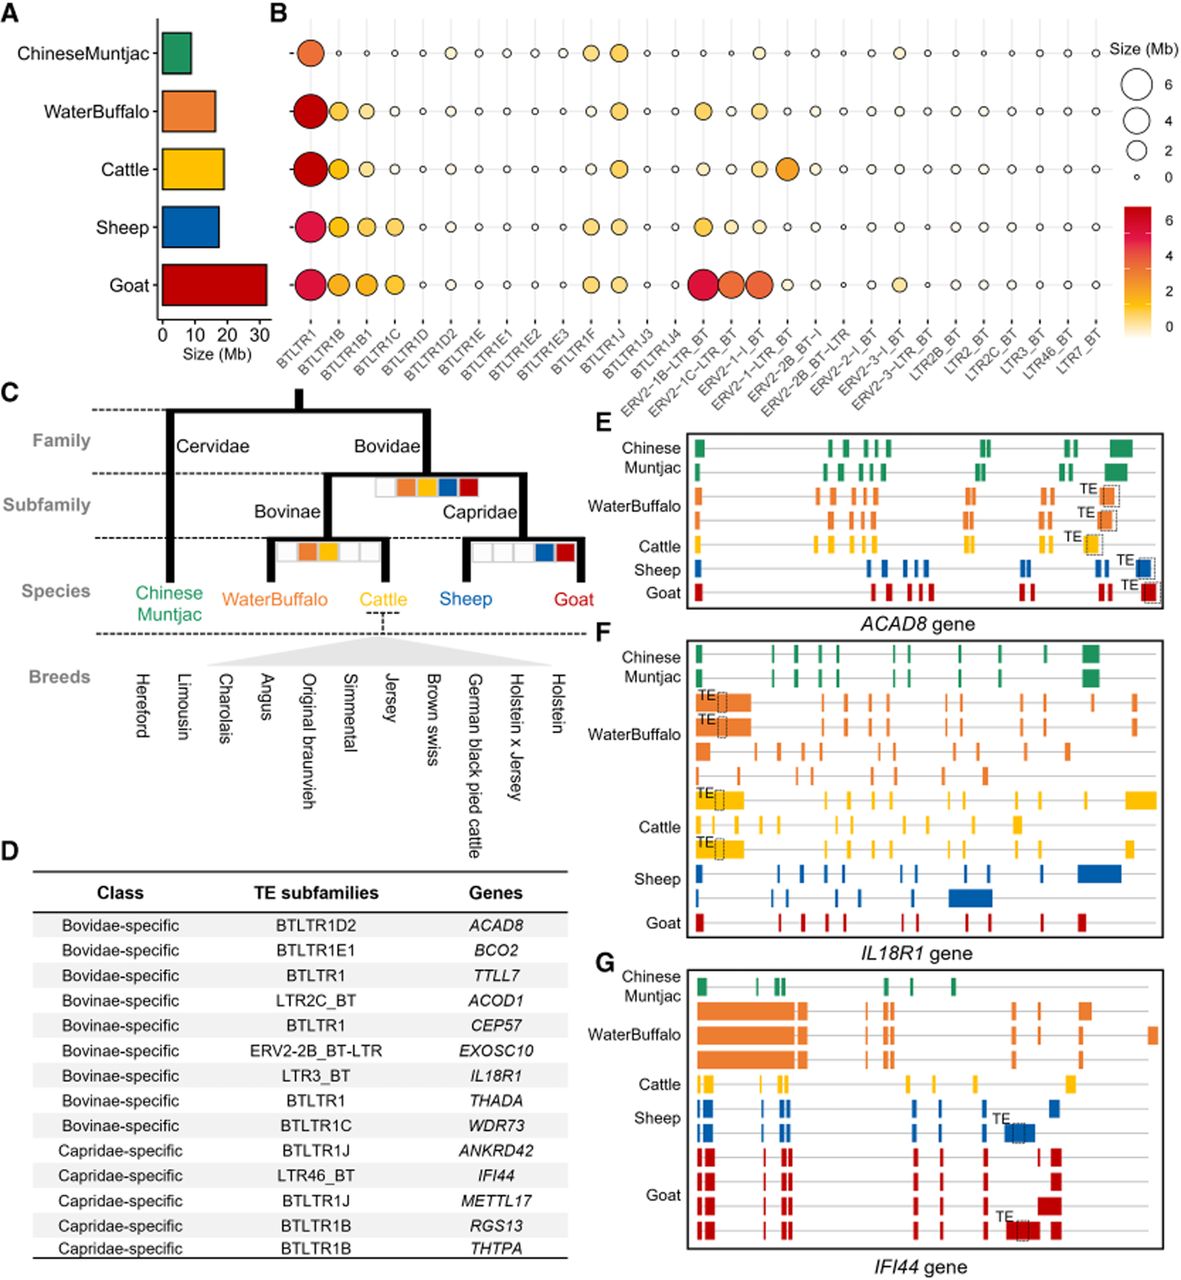
Impact of taxon-specific TE genes on ruminant genomes. (A) Bar plots quantify the total genomic content of the ERVK family across five ruminant species. (B) A dot-based heat map visualizes the abundance of individual ERVK subfamilies (rows) in each ruminant genome (columns). Dot size and red color intensity scale with genomic occupancy. This reveals subfamily-specific proliferation bursts, with larger/darker dots indicating subfamilies that underwent significant expansion in particular species. (C) Phylogenetic distribution of taxon-specific TE. A maximum-likelihood tree depicts evolutionary relationships among the five ruminant species. Concentric arcs around the tree illustrate the distribution of genes disrupted by family-specific and subfamily-specific TEs. (D) Exonization events driven by taxon-specific TEs. A table catalogs 14 genes exhibiting TE-induced exonization. (E) Bovidae-specific exonization in ACAD8. (F) Bovinae-specific exonization in IL18R1. (G) Caprinae-specific exonization in IFI44.