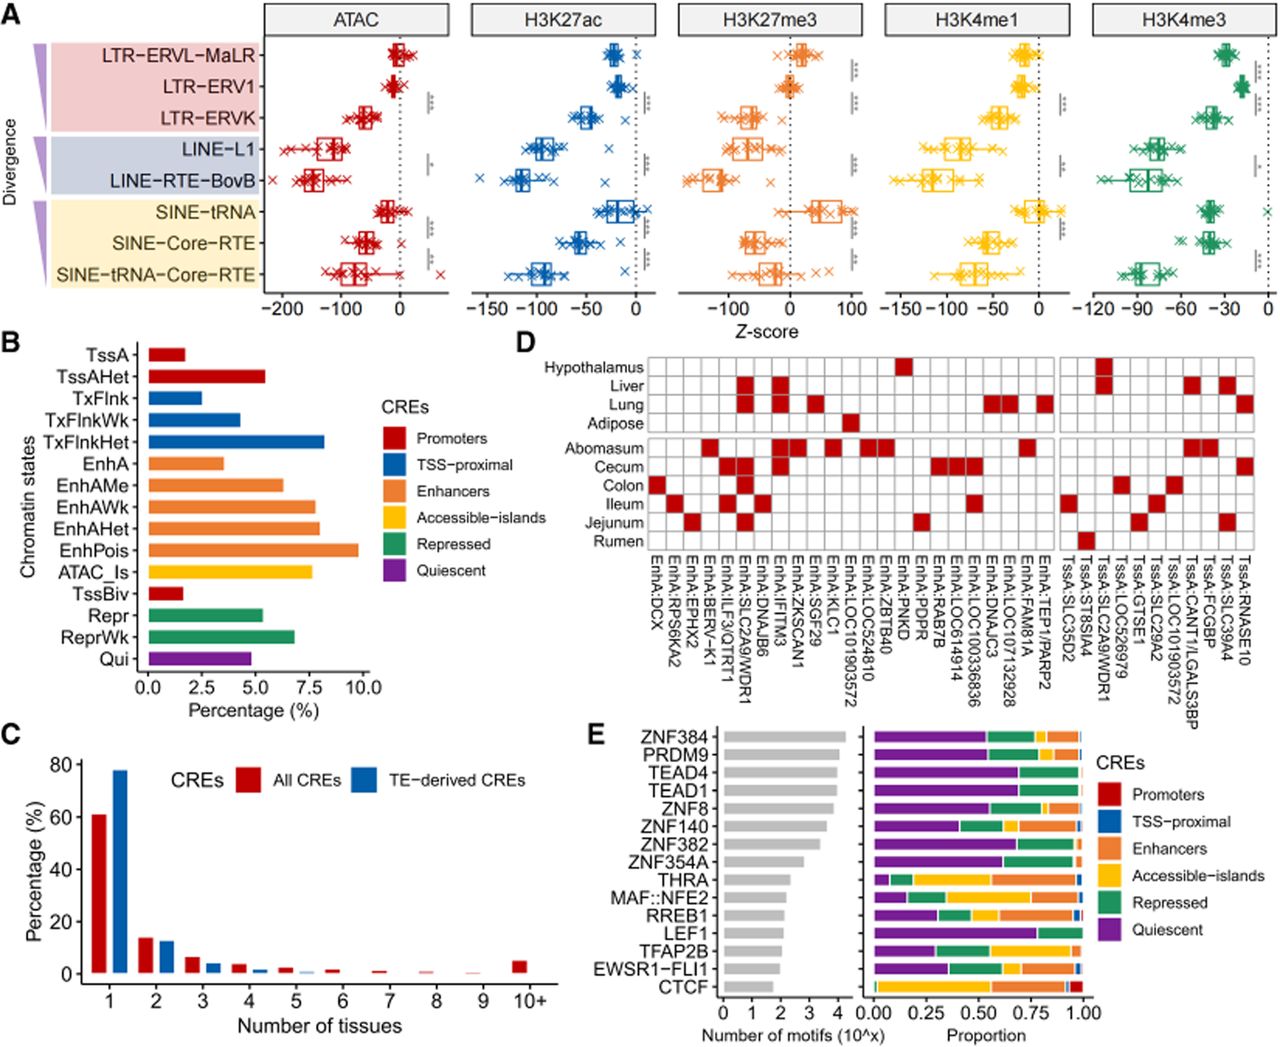
Epigenetic regulation of recent TEs in ruminants. (A) Distribution of TE enrichment across epigenetic markers. Box plot illustrates systematic enrichment patterns of eight TE families relative to five functionally distinct epigenetic markers (ATAC, H3K27ac, H3K4me1, H3K4me3, and H3K27me3). Peaks signify genomic regions where TEs colocalize with active/repressive marks, suggesting TE roles in regulatory elements. Significance levels: (*) P-value < 0.05, (**) P-value < 0.01, (***) P-value < 0.001. (B) Contribution of TE-derived CREs by functional class. Bar plot quantifies the percentage of TE-derived CREs within distinct functional annotations (y-axis: e.g., enhancers, promoters, insulators, and repressed regions). The x-axis spans 0%–100%, revealing TEs’ preferential contribution to specific regulatory classes. (C) Tissue specificity of TE-derived versus all CREs. Grouped bar plot compares the distribution of all CREs (red fill) and TE-derived CREs (blue fill) across tissues. (D) Tissue-gene association of TE-derived CREs. Heat map shows rows: genes with TE-derived CREs; columns: tissues. Red = CRE presence; white = CRE absence. (E) ERVK-derived TFBSs. Left: Bar plot showing TFBS counts (y-axis) for key transcription factors within ERVK-derived CREs. Right: Proportional bar plot depicting the genomic context of ERVK TFBSs.