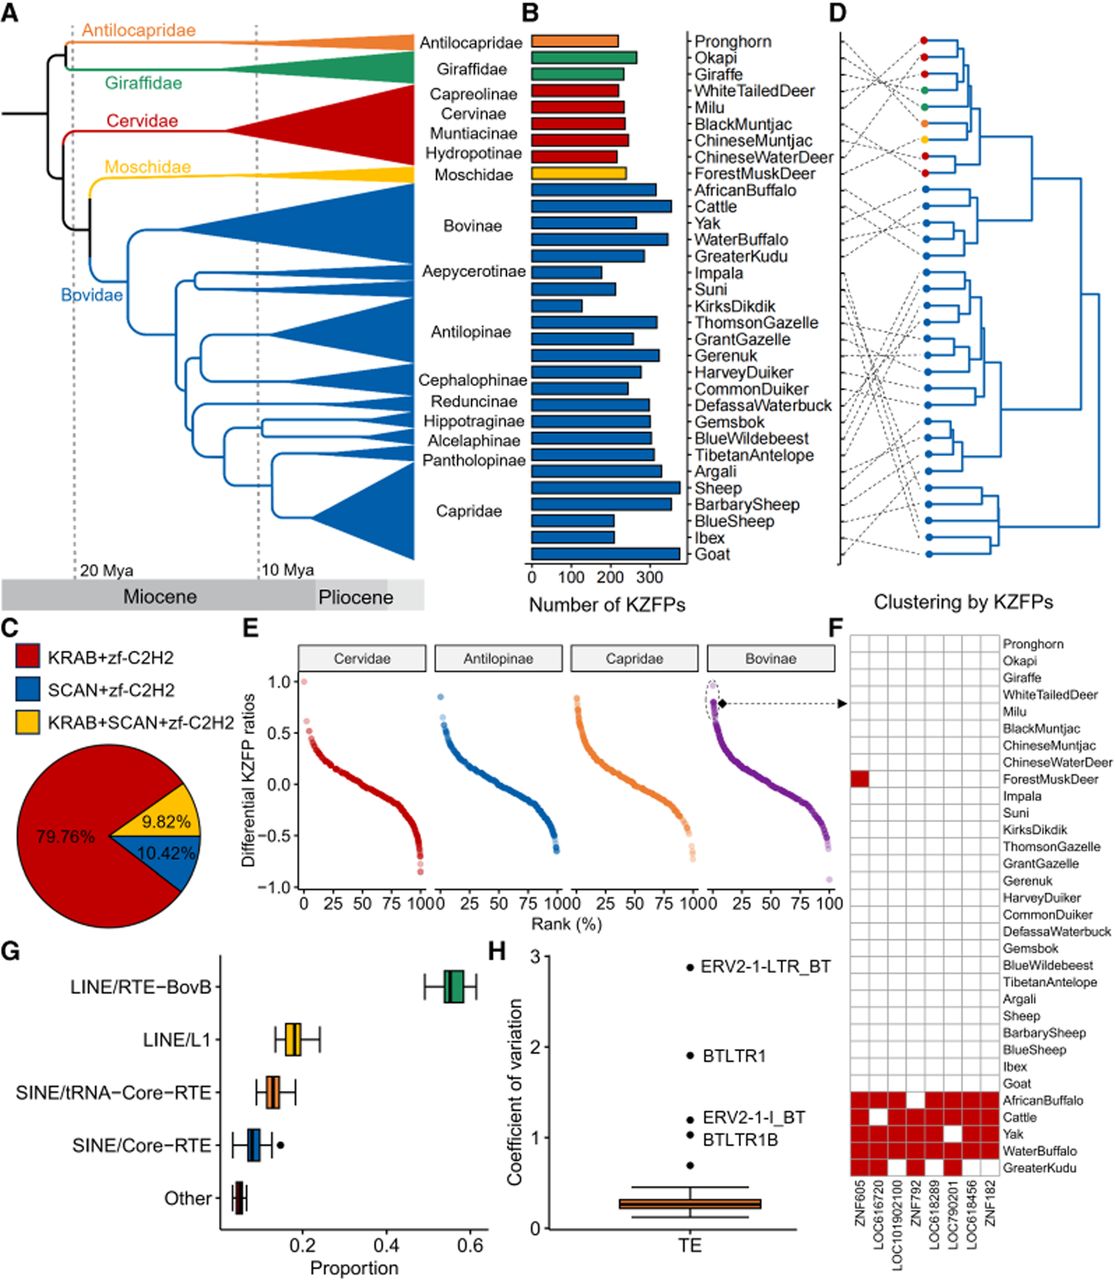
Annotation of KZFPs and TE Families. (A) The phylogenetic tree illustrates the evolutionary diversification across 32 ruminant species, showing speciation events and divergence timescales. (B) The bar plot displays the number of annotated KZFPs for each ruminant species. (C) The multisegmented pie chart shows the proportional distribution of KZFP domain architectures, categorizing structural configurations for KRAB, SCAN, and zf-C2H2. (D) The hierarchical clustering based on KZFP distribution patterns demonstrates evolutionary relationships among ruminant species. (E) The scatterplot characterizes rank-ordered family-differential KZFP proportions, visualizing taxon-specific expansions or contractions of particular KZFP families. The x-axis represents the rank distribution ordered from highest to lowest differential KZFP ratio. The y-axis represents the differential KZFP ratio between the specific taxon and other ruminants. (F) The heat map tracks the presence/absence status of eight KZFPs across all 32 species. (G) The box plot shows genomic landscape occupation by TE families, revealing substantial variation in TE content proportions. (H) The box plot illustrates the variation coefficient (CV) in TE subfamily frequency across the analyzed ruminant species.