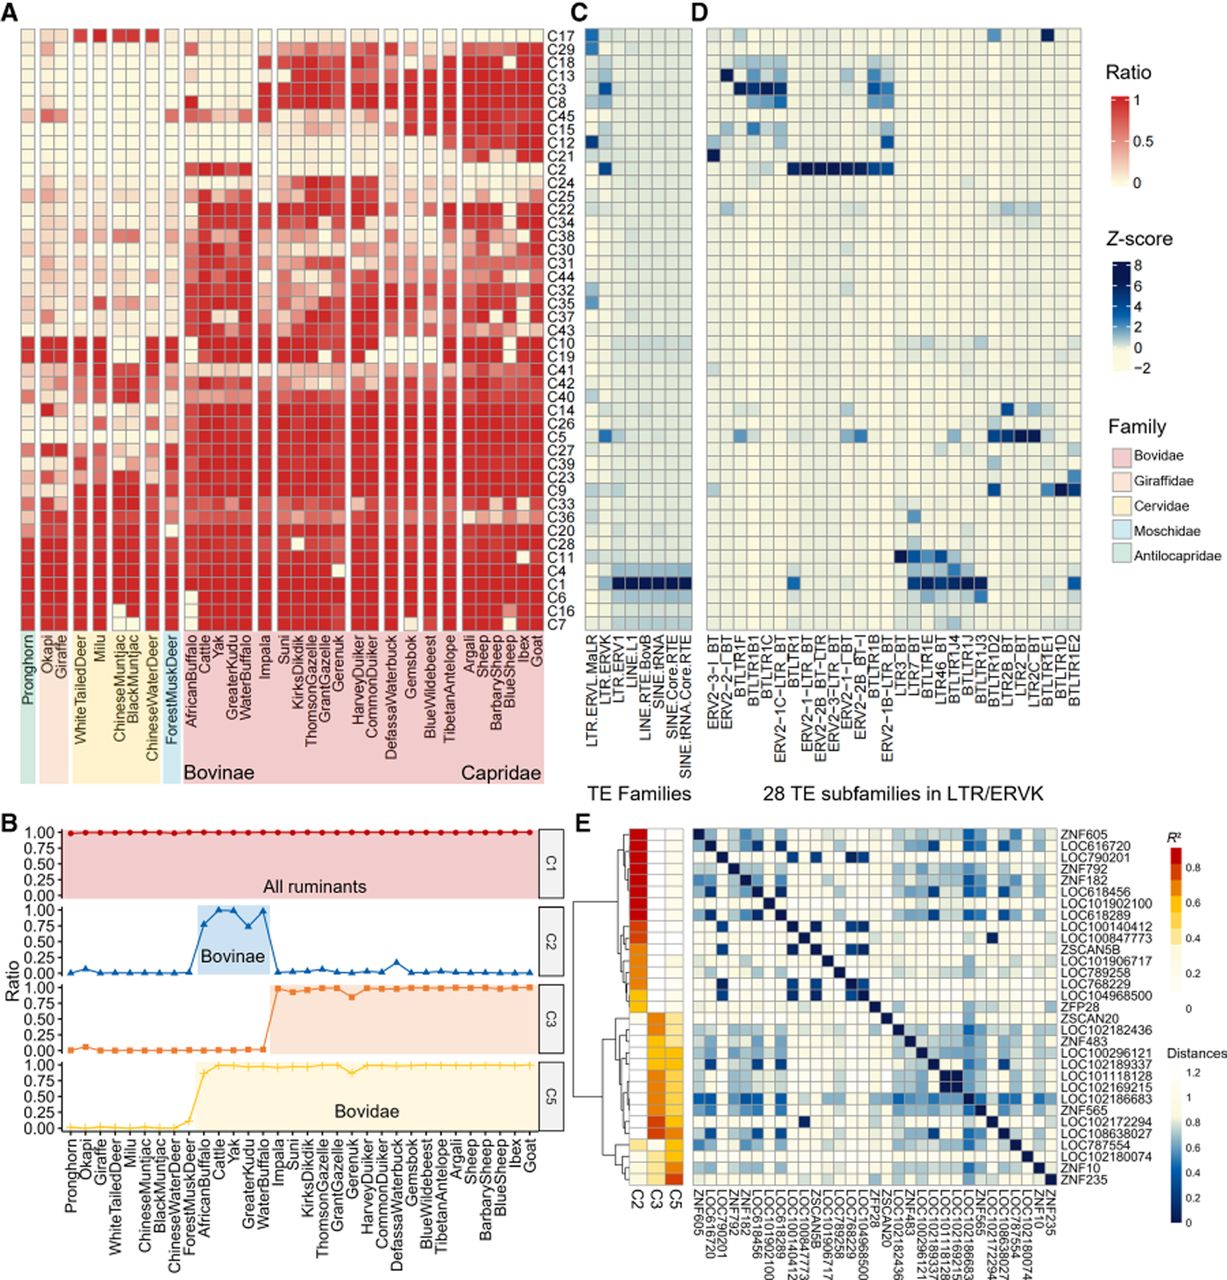
Coevolution analysis between the KZFP and TE families. (A) TE k-mer cluster enrichment across ruminant genomes. Heat map displaying the distribution and enrichment patterns of TE k-mer clusters in 32 ruminant genomes. Rows represent specific TE k-mer clusters, columns denote individual genomes. Color intensity indicates the ratio of specific k-mer clustering present in each species. (B) Compositional dynamics of major TE k-mer clusters. Dot plot illustrating the proportional representation of four conserved TE k-mer clusters (C1/C2/C3/C5) across ruminant genomes. (C,D) TE k-mer cluster enrichment in family and subfamily. Heat map correlating eight major TE families and 28 LTR/ERVK subfamilies with k-mer clusters. Color intensity reflects enrichment levels of family or subfamily within each cluster. (E) KZFP-TE coevolution and sequence divergence. Left: Correlation heat map between KZFPs and TE k-mer clusters. Rows: KZFP genes; columns: TE clusters (C2/C3/C5). Red indicates a positive correlation, suggesting KZFP putative binding preferences for specific TE k-mer clusters. Right: Heat map showing pairwise distance matrix of KZFP protein sequences.