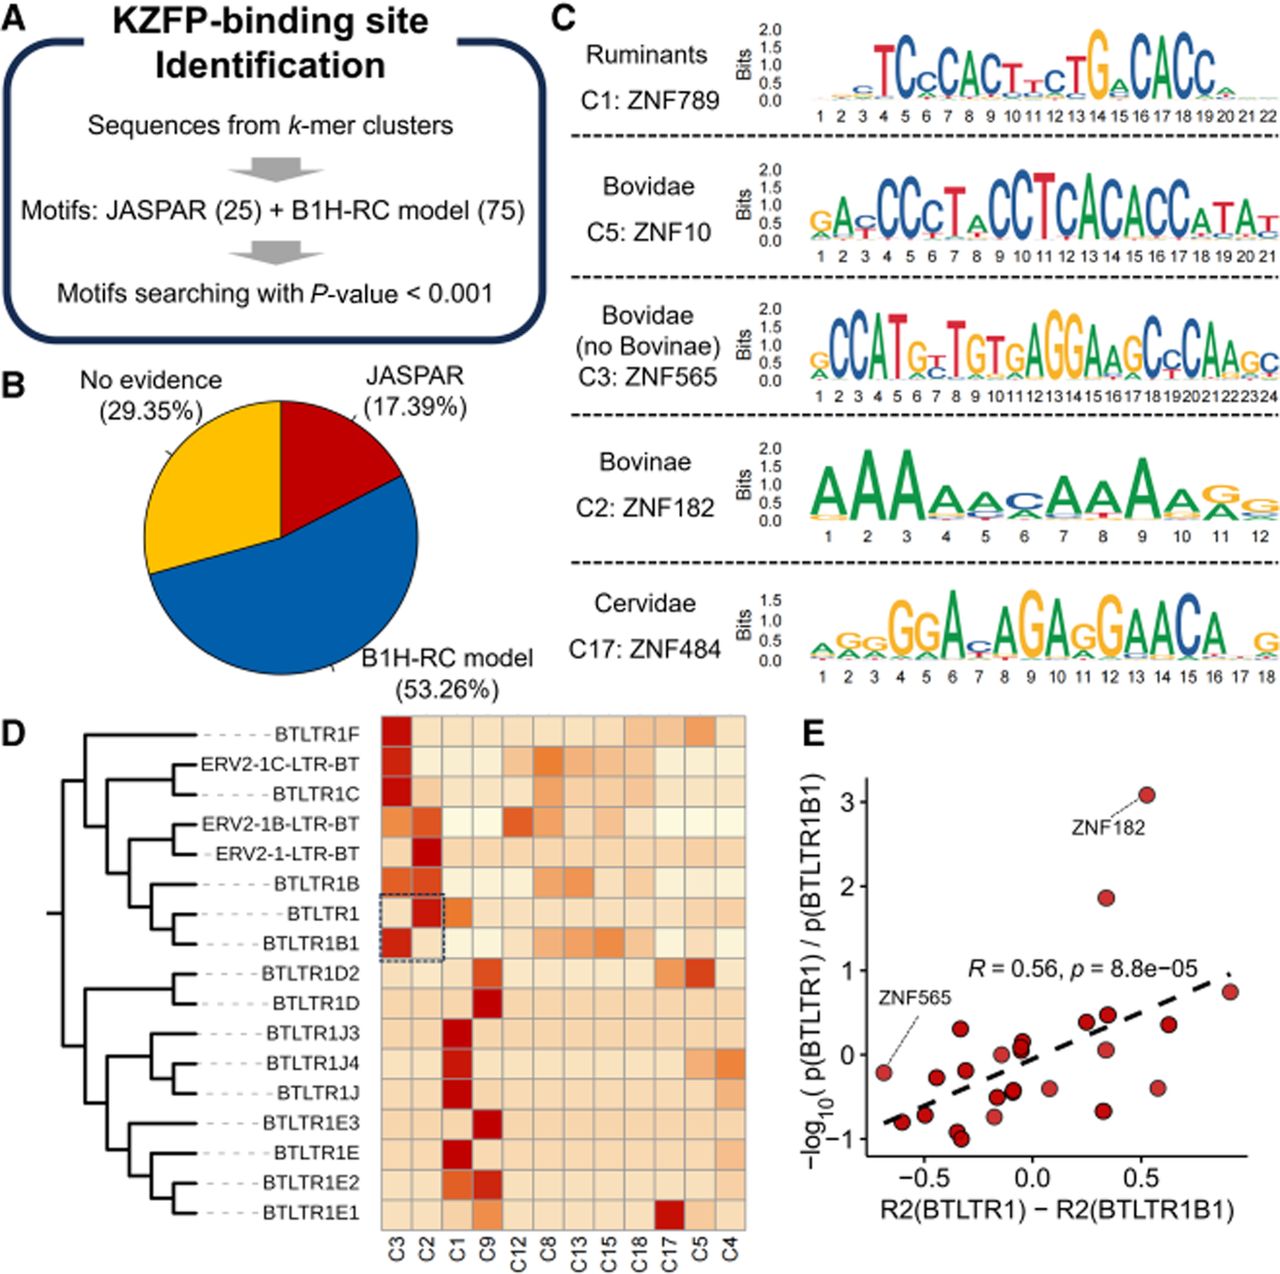
Analysis and verification of ruminant TE-KZFP interactions. (A) Schematic of TE-KZFP interaction and binding site identification. KZFP-binding sites were identified by integrating de novo motifs from JASPAR database and B1H-RC model predictions. (B) Proportion of TE-derived k-mers containing KZFP-binding motifs. Pie chart show the proportion of KZFP-binding motifs among all motif-containing k-mers derived from TEs. (C) Position weight matrices of coevolved KZFP motifs. Sequence logos and position weight matrices (PWMs) representing DNA-binding motifs of KZFPs showing coevolutionary with TE k-mer clusters. Motifs are stratified by TE family specificity, with matrix height reflecting nucleotide conservation at each position. (D) ERVK family phylogeny and TE k-mer cluster enrichment. Left: Maximum-likelihood phylogenetic tree of ERVK subfamilies, reconstructed from consensus TE sequences. Right: Heat map showing enrichment scores of TE k-mer clusters across ERVK subfamilies. Color intensity denotes enrichment levels of ERVK family within each cluster. (E) Correlation between KZFP motif reliability and coevolution with TE k-mers. Scatterplot evaluating the relationship between KZFP motif prediction confidence and coevolutionary patterns with TE k-mer clusters. x-axis: Difference in correlation R² between C2 and C3 clusters. y-axis: Negative log-transformed ratio of motif detection P-values (C2/C3).