
Abstract
Histone methylation, catalyzed by SET domain-containing lysine methyltransferases, is a conserved epigenetic mechanism regulating gene expression in eukaryotes. However, the evolutionary dynamics of SET domain proteins and their functional interplay in fungi remain poorly understood. Here, we analyzed 18,718 SET domain proteins from 1038 fungal genomes and identified three major clusters, with Cluster 1 enriched for canonical histone methyltransferases. The evolution of the SET domain protein family coordinates with genome expansion in fungi. Functional characterization of seven Cluster 1 proteins in Fusarium graminearum, a globally significant fungal pathogen, reveals diverse roles in growth, development, and virulence. In-depth analyses of two H3K36-specific methyltransferases, Set2 and Ash1, uncover their distinct regulatory functions. Set2-mediated H3K36me3 is enriched in gene bodies of euchromatic regions and facilitates transcription elongation. In contrast, Ash1-mediated H3K36me3 localizes to promoters within facultative heterochromatin and represses transcription. Notably, Ash1-mediated H3K36me3 cooperates with Polycomb repressive complex 2 (PRC2)-dependent H3K27me3 to silence secondary metabolite (SM) gene clusters. Deletion of ASH1 reduces H3K27me3 levels and derepresses SM gene expression. Conversely, Set2-mediated H3K36me3, facilitated by Ctk1-dependent RNA polymerase II phosphorylation, promotes transcriptional elongation of SM genes. Together, these findings reveal evolutionary features of fungal SET domain proteins and uncover a synergistic interplay between H3K36me3 and H3K27me3 in regulating fungal secondary metabolism and virulence. This study advances our understanding of epigenetic regulation in fungi and provides potential targets for controlling fungal pathogens.
Transcriptional regulation in eukaryotes is profoundly influenced by chromatin status, integrating diverse cellular signals to control gene expression (Berger 2007). Chromatin dynamics are modulated by multiple mechanisms, including histone modifications, DNA methylation, and chromatin remodeling complexes (Shilatifard 2006; Mattei et al. 2022; Shang and He 2022). Histone methylation, central to defining chromatin states, distinguishes transcriptionally active euchromatin from repressive heterochromatin. Histone methylation occurs at specific lysine residues of histones H3, H4, and H2B, including H3K4, H3K9, H3K27, H3K36, H4K20, H2BK122, and H2BK130 (Zhang et al. 2024a,b). H3K4 methylation associates with active transcription, whereas H3K9 and H3K27 methylation link to transcriptional repression (Freitag 2017). H3K36 methylation, particularly H3K36me3, functions as a cotranscriptional mark, promoting transcriptional fidelity by facilitating elongation, preventing cryptic initiation, and restoring chromatin compaction (Carrozza et al. 2005; Kim et al. 2016; Lee et al. 2021). These modifications form a complex and dynamic network controlling chromatin structure and gene expression (Martin and Zhang 2005). Histone methylation is catalyzed by histone methyltransferases (HMTs), which typically contain a conserved SET domain that mediates lysine methylation. Evolutionary studies in plants and animals reveal considerable SET domain protein functional diversity, specializing in development and stress responses (Zhang and Ma 2012; Zhao et al. 2019). Beyond histone lysine methylation, some SET domain proteins possess additional domains, such as tudor and chromo domains, facilitating recruitment to specific chromatin regions for gene regulation (Schotta et al. 2002; Zhu et al. 2013; Jurkowska et al. 2017; Chandrasekaran et al. 2024). Limited phylogenetic analyses of SET domain proteins across 20 representative fungal species suggested extensive gene duplications, losses, and domain rearrangements, implying unique HMT regulatory mechanisms in fungi (Ding et al. 2022). However, comprehensive, systematic analysis of SET domain protein distribution and evolutionary patterns across the fungal kingdom, leveraging rapidly accumulating genome sequences, remains unexplored.
H3K36 methylation is particularly important for transcriptional regulation and chromatin organization in eukaryotes (Wagner and Carpenter 2012; Lam et al. 2022; Krogan et al. 2023). Its biological roles exhibit considerable species-specific divergence. Mammals employ at least eight enzymes to catalyze H3K36 methylation, coordinating diverse processes like alternative splicing and DNA repair, with aberrant patterns linked to human diseases (Lucio-Eterovic et al. 2010; Shirane et al. 2020). In plants, three SET domain proteins, SDG4, SDG8, and SDG26, function as H3K36 methyltransferases. SDG8 is the major enzyme, essential for reproductive development and stress responses (Cazzonelli et al. 2009; Yang et al. 2014; Li et al. 2020), whereas SDG4 and SDG26 regulate pollen tube growth and flowering time (Cartagena et al. 2008; Berr et al. 2015). Fungi further illustrate this diversification. Budding yeast utilizes a single methyltransferase Set2 to catalyze H3K36me1/2/3 (Keogh et al. 2005). However, filamentous fungi typically harbor two distinct H3K36 methyltransferases, Set2 and Ash1, with diverse functions. For example, in Neurospora crassa, Set2 targets actively transcribed genes, whereas Ash1 represses silent genes and is essential for viability (Bicocca et al. 2018). Similarly, in Fusarium fujikuroi and Magnaporthe oryzae, Set2 and Ash1 exhibit distinct genomic localization and functions, influencing processes like growth, sporulation, and virulence (Janevska et al. 2018; Xu et al. 2023). These findings highlight the importance of H3K36 methylation in fungal development and gene regulation, along with substantial species-specific variations in its biological roles and the underlying SET domain enzymes.
Furthermore, H3K36 methylation frequently interacts with other chromatin modifications, such as histone acetylation and H3K27 methylation, to modulate gene expression. For instance, Set2-mediated H3K36 methylation recruits the Rpd3S histone deacetylase complex, suppressing intragenic transcription initiation (Carrozza et al. 2005). In yeast, H3K36me3 anchors the H3K14 histone acetyltransferase (HAT) Mst2 to euchromatin, preventing its mistargeting (Flury et al. 2017). Antagonistic interactions between H3K36 and H3K27 methylation have been reported in both plants and animals. In mouse embryonic stem cells, NSD1-mediated loss of H3K36me2 increases H3K27me3 at PRC2 target genes (Fang et al. 2021), and in Arabidopsis, these modifications antagonistically regulate FLC expression (Yang et al. 2014). However, the interplay between H3K36 and H3K27 methylation in fungi appears more complex and context-dependent. For example, in M. oryzae, Ash1-catalyzed H3K36me2 colocalizes with H3K27me3 (Xu et al. 2023), whereas ASH1 deletion in F. fujikuroi enhances H3K27me3 levels (Janevska et al. 2018). Furthermore, N. crassa Ash1 activity has both positive and negative impacts on H3K27 methylation (Bicocca et al. 2018). These divergent observations suggest multiple models for how H3K36 and H3K27 methylation interact in fungi, highlighting the need for further investigation into their precise mechanisms in regulating gene expression, particularly within facultative heterochromatin.
This study first provides a comprehensive evolutionary analysis of SET domain proteins across the fungal kingdom. Subsequently, we characterize key Cluster 1 SET domain proteins, specifically the H3K36-specific methyltransferases Set2 and Ash1, in Fusarium graminearum, a major fungal pathogen of cereal crops worldwide (Dean et al. 2012; Chen et al. 2019). Our work elucidates their distinct regulatory mechanisms and uncovers a synergistic interplay between H3K36me3 and H3K27me3 that is critical for controlling fungal secondary metabolism and virulence.
Results
Distribution and phylogenetic analysis of SET domain proteins in fungi
To understand the diversity of SET domain proteins in fungal evolution, we performed domain-based functional annotations for all 23.64 million proteins from 1038 publicly available fungal genomes across nine phyla. This analysis identified 18,718 SET domain-containing proteins (PF00856) (Supplemental Table S1), averaging 18 per species but varying widely across phyla. A significant positive correlation (R = 0.52, P < 2.2 × 10⁻¹⁶) was found between total genes and SET domain abundance (Fig. 1A), suggesting a link between this family's evolution and genome expansion. We further performed a CLANS cluster analysis of these 18,718 proteins based on sequence similarity (Supplemental Fig. S1A), dividing them into three distinct clusters (Fig. 1B). Notably, nearly all known fungal HMTs with SET domains grouped into cluster 1, indicating evolutionary conservation (Fig. 1B,C; Supplemental Tables S2, S3). Given the critical role of HMTs in gene regulation, we focused on cluster 1 for further in-depth analysis. Phylogenetic analysis showed cluster 1 proteins formed distinct branches corresponding to different methylation types: Set1 (H3K4), Kmt1 (H3K9), Kmt6 (H3K27), and Kmt5 (H4K20). However, the SET2 family, responsible for H3K36 methylation, was divided into two subfamilies: Set2 and Ash1.
Distribution and phylogeny of SET domain proteins across fungi kingdom. (A) Correlation between SET domain protein number and total gene count in fungal genomes. Pearson correlation coefficient: R = 0.52, P < 2.2 × 10⁻¹⁶. (B) Cluster analysis of 18,718 SET domain proteins from 1038 fungal species. Thirty groups within three clusters are shown by distinct colors and shapes. (C) Phylogenetic tree of cluster 1 SET domain proteins, highlighting histone methyltransferase (HMT) clades. Scale bar = 1. (D) Distribution of key HMT families (Set1, Kmt1, Kmt5, Kmt6) and subfamilies (Set2, Ash1) across seven fungal phyla. Average copy number per class is shown.
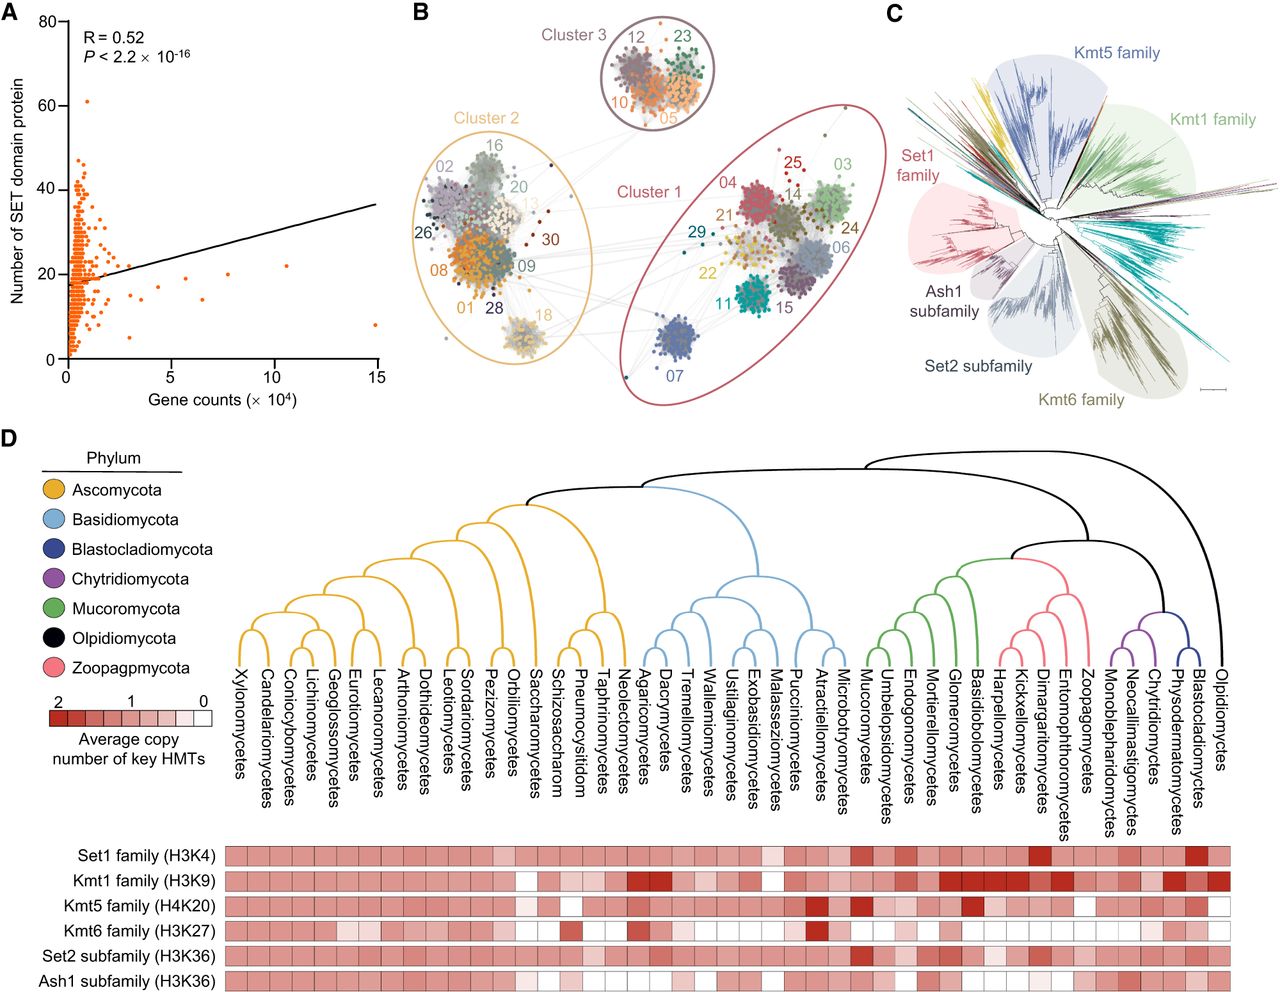
The distribution analysis revealed that these key HMTs are relatively conserved across fungi. However, the Kmt6 family and Ash1 subfamily appear to be less conserved (Fig. 1D), being absent in 417 and 382 species, respectively (Supplemental Fig. S1B). Approximately 36.8% of species lack Ash1 subfamily members, prompting an investigation into the evolutionary relationship between Set2 and Ash1. A phylogenetic tree showed both subfamilies forming distinct branches (Supplemental Fig. S1C), suggesting independent evolution and functional divergence. Additionally, we observed copy number variations for Set2 (≥2 copies in 108 of 1038 genomes) and Ash1 (≥2 copies in 35 of 1038 genomes) (Supplemental Fig. S1D,E). These results indicated that species-specific deletion or duplication events drive Set2 family variation. In summary, fungal SET domain protein numbers correlate with genome size, and fungal HMTs, particularly the Set2 family, exhibit extensive copy number variations. Next, we will use F. graminearum as a model to explore the biological functions of HMT candidates in cluster 1.
Cluster 1 SET domain proteins regulate histone methylation and pathogenicity in F. graminearum
F. graminearum harbors 19 SET domain proteins, with seven in cluster 1, 10 in cluster 2, and two in cluster 3 (Supplemental Table S4). To investigate the functions of these seven HMT candidates, we constructed deletion mutants for each gene and analyzed their roles in histone methylation and biological phenotypes. All mutants, except Δset3, exhibited significant hyphal growth defects on complete medium compared to wild-type PH-1 (Fig. 2A,B). Notably, Δash1 showed a particularly severe growth reduction, with only 5% of the wild-type relative growth rate. Next, we performed western blotting assays with site-specific antibodies for histone methylation to detect the impact of each mutant on histone methylation levels. Consistent with previous studies, Set1, Kmt1, Kmt6, and Kmt5 are responsible for H3K4, H3K9, H3K27, and H4K20 methylation, respectively, in fungi (Connolly et al. 2013; Liu et al. 2015; Bachleitner et al. 2021). Deletion of these genes resulted in complete loss or significant reduction of corresponding histone methylation levels in F. graminearum (Fig. 2C,D). Notably, H3K36me3 levels were significantly reduced in both Δset2 and Δash1 mutants, indicating that Set2 and Ash1 function as H3K36 methyltransferases in F. graminearum. In contrast, the Δset3 mutant shows no changes in tested histone methylation levels.
Role of SET domain proteins in histone modification and pathogenicity in F. graminearum. (A) Colony morphologies of wild-type PH-1 and seven individual SET domain deletion mutants grown on complete medium (CM) for 3 days. (B) Colony diameters of strains in A. Data are mean ± standard deviation (s.d.) (n = 3). Different letters indicate statistically significant differences (ANOVA, Tukey's multiple comparisons test, P < 0.05). (C) Western blot analysis of PH-1 and deletion mutants using antibodies against H3K4me3, H3K9me3, H3K27me3, H3K36me3, and H4K20me3. Anti-H3 served as a loading control. (D) Relative histone methylation levels, normalized to H3, quantified by ImageJ software. PH-1 band intensity was set to 1. (E) Symptoms on flowering wheat heads inoculated with conidial suspensions of the indicated strains, photographed at 15 days postinoculation (dpi). (F) Symptoms on wheat seedling stems inoculated with mycelial plugs from the indicated strains, photographed at 5 dpi.
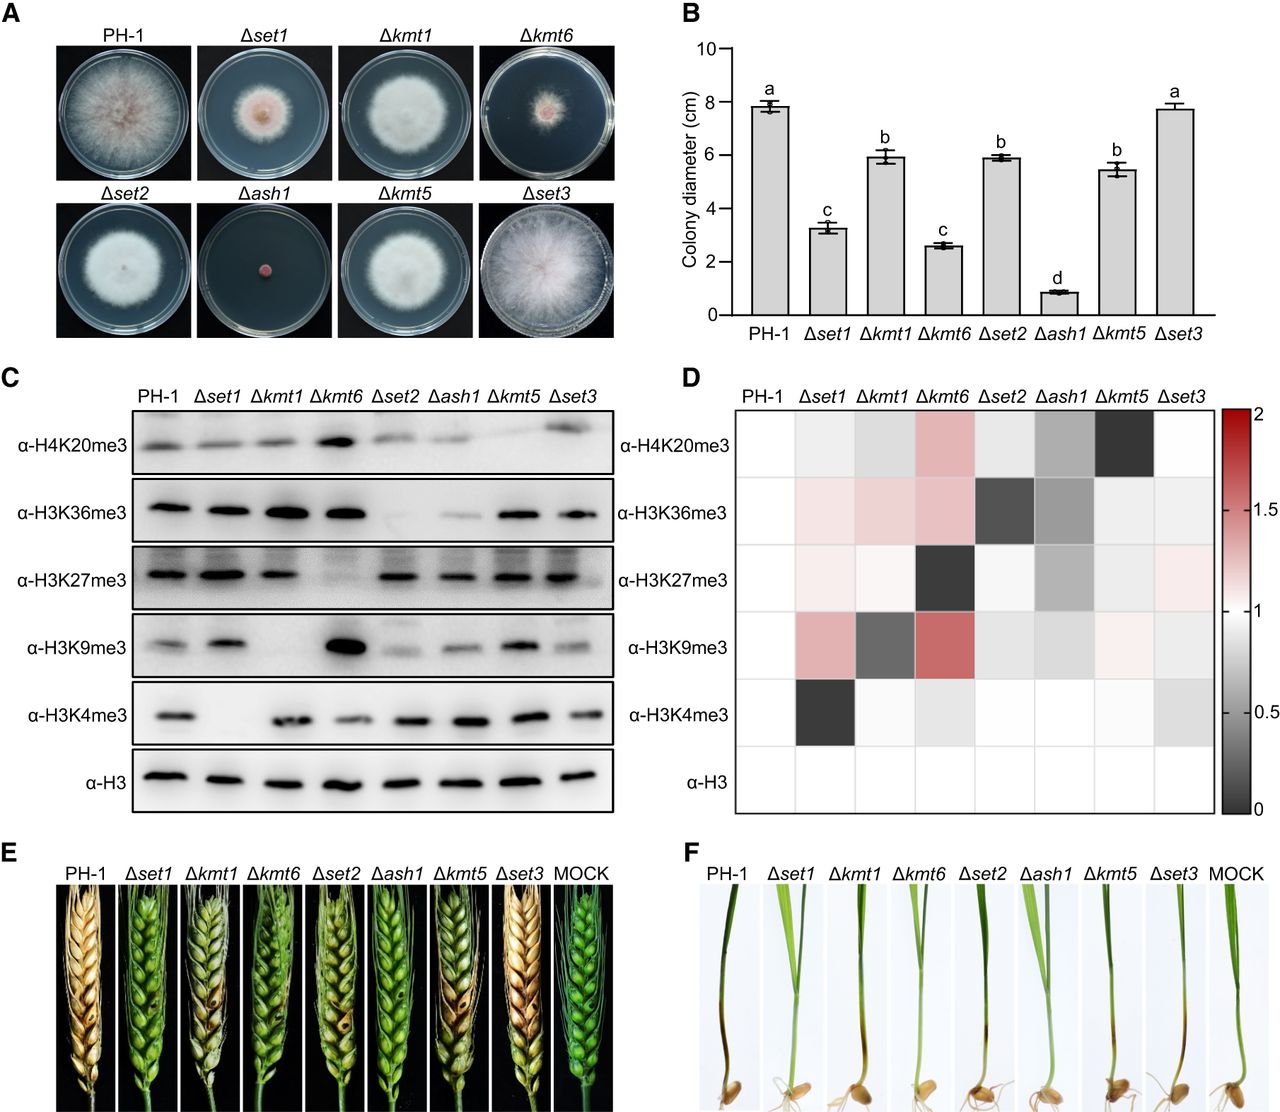
Mutant pathogenicity was evaluated by point-inoculating conidial suspensions into flowering wheat heads and placing mycelial plugs on wheat seedling stems. In wheat heads, wild-type PH-1 inoculation resulted in scab symptoms developing on inoculated spikelets and rapidly spreading to neighboring spikelets. Fifteen days postinoculation, wild-type PH-1 caused severe, typical scab symptoms (Fig. 2E). In contrast, all mutants, except Δset3, showed significantly reduced virulence. The Δset1, Δkmt6, and Δash1 mutants were nonpathogenic, whereas the Δset2 mutant exhibited scab symptoms restricted to the inoculated spikelets without rachis spread (Fig. 2E). The Δkmt1 and Δkmt5 mutants infected the inoculated spikelets and spread to neighboring spikelets, but their virulence was significantly reduced compared to the wild type. Additionally, these mutants demonstrated attenuated virulence on wheat seedlings (Fig. 2F). Collectively, six of seven SET domain proteins in cluster 1 regulate histone methylation, growth, and pathogenicity in F. graminearum. Given that the roles of Set1, Kmt1, Kmt6, and Kmt5 are already characterized, we will specifically focus on Set2 and Ash1 to investigate their distinct or overlapping contributions in regulating H3K36 methylation, gene expression, and biological functions.
Distinct roles of Set2 and Ash1 in H3K36 methylation, development, virulence, and stress response in F. graminearum
To determine if F. graminearum Set2 and Ash1 possess H3K36 methyltransferase activity, we heterologously expressed and purified them in Escherichia coli for in vitro enzyme assays. A recombinant H3K36 peptide, devoid of pre-existing histone modifications, served as the substrate, with S-adenosylmethionine (SAM) as the methyl donor. Western blotting and LC–MS/MS analyses evaluated the reaction products’ methylation status. Western blotting revealed specific H3K36me2 and H3K36me3 signals when probed with corresponding antibodies (Fig. 3A). LC–MS/MS analysis further showed mass shifts of 28.03 Da and 42.05 Da at the H3K36 residue, consistent with di- and trimethylation (Supplemental Fig. S2; Supplemental Table S5). These findings confirm that both Set2 and Ash1 possess in vitro H3K36 methyltransferase activity. We then assessed the in vivo H3K36 methyltransferase activity of Set2 and Ash1 and explored their roles in various biological processes. Localization analyses with GFP-tagged Set2 and Ash1 demonstrated nuclear localization in mycelia, confirmed by colocalization with H1-mCherry (Supplemental Fig. S3). We then evaluated relative H3K36me2 and H3K36me3 levels via western blotting, using specific antibodies, in single (Δset2, Δash1), double (Δset2/ash1), and H3K36A (H3K36 substituted with alanine) mutants. As shown in Figure 3, B and C, SET2 mutation significantly reduced global H3K36me3 levels to ∼10% of wild-type, whereas ∼80% H3K36me3 was retained in Δash1. In both single mutants, global H3K36me2 levels decreased to ∼45% of PH-1. Importantly, H3K36me2 and H3K36me3 levels were completely abolished in both the Δset2/ash1 and H3K36A mutants (Fig. 3B,C). These findings suggest that Set2 and Ash1 redundantly contribute to full H3K36me2/3 activity in F. graminearum, with Set2 playing a more dominant role in regulating H3K36me3.
Set2 and Ash1 regulate development, virulence, and stress responses in F. graminearum. (A) Western blot analysis of Set2 and Ash1 in vitro HMT activity, probed with anti-H3K36me2 and anti-H3K36me3 antibodies. (B) H3K36me2 and H3K36me3 levels in PH-1, deletion mutants, and complemented strains. Anti-H3 served as a loading control. (C) Quantification of H3K36me2 and H3K36me3 signal intensities using ImageJ software. PH-1 intensity was set to 100%. (n.d.) not detectable. Different letters indicate significant differences among all groups shown. (D) Colony diameters of PH-1 and mutant strains after 3 days on PDA and CM. Different letters indicate statistically significant differences among all tested groups. Representative colony morphologies are shown in E. (F) Conidial production of strains grown in carboxymethyl cellulose (CMC) liquid medium for 5 days. Different letters indicate statistically significant differences among strains. (G) Virulence of PH-1 and mutants on wheat heads after point-inoculated with conidia, photographed at 15 dpi. (H) Deoxynivalenol (DON) production by PH-1 and mutants after 7 days in trichothecene biosynthesis-inducing (TBI) medium. Different letters indicate statistically significant differences among strains. (I) DON toxisome formation in PH-1, Δset2, and Δash1 visualized by Tri1-GFP after 36 or 48 h in TBI medium. Scale bar, 5 µm. (J) Heat map showing sensitivity of PH-1 and mutants to various abiotic stresses. Growth inhibition of PH-1 under each condition was normalized to 1.0. Data are mean ± standard deviation (n = 3). For panels C, D, F, and H, data are presented as mean ± standard deviation (s.d.) from three independent experiments. Statistical analysis was performed using ANOVA with Tukey's multiple comparisons test (P < 0.05).
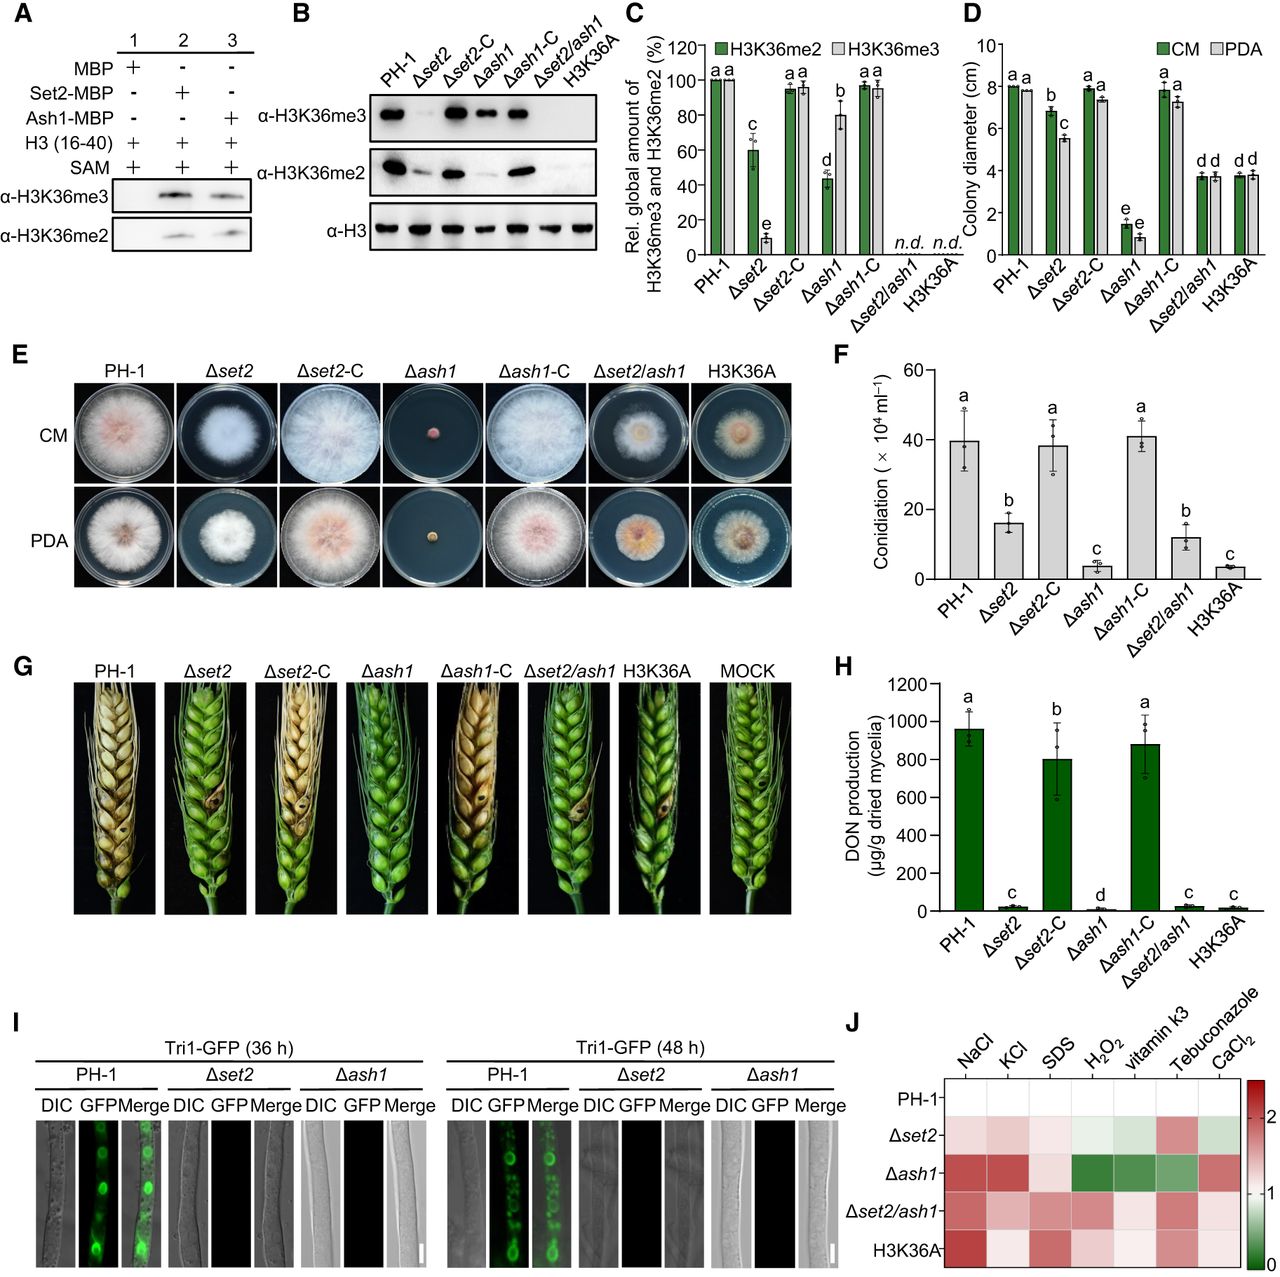
We next assessed fungal development, pathogenicity, and stress tolerance in these deletion mutants and their complemented strains. All mutants exhibited significant growth defects on both tested media compared to PH-1, with Δash1 displaying the most severe reduction (only 5% of the growth rate of PH-1). Notably, Δset2/ash1 partially restored its growth rate compared to Δash1 (Fig. 3D,E). Additionally, conidiation was significantly reduced across all mutants (Fig. 3F). Pathogenicity was evaluated by point-inoculating conidial suspensions onto flowering wheat heads (Fig. 3G). Fifteen days postinoculation, scab symptoms caused by Δset2 and Δset2/ash1 were restricted to inoculated spikelets, whereas Δash1 was entirely nonpathogenic. In contrast, PH-1 and the complemented mutants induced severe scab symptoms across the wheat heads (Fig. 3G). Deoxynivalenol (DON), a critical virulence factor, is essential for fungal spread within a spike. Given the mutants’ restricted spread or complete loss of pathogenicity, we quantified DON production. Cultivation in trichothecene biosynthesis induction (TBI) medium for 3 days revealed that all mutants produced significantly lower DON amounts compared to PH-1 and complemented strains (Fig. 3H). To further confirm, we investigated DON-toxisome formation using GFP-tagged Tri1 (Tri1-GFP) as a marker in TBI medium. As shown in Figure 3I, no toxisomes were detected in either Δset2 or Δash1, whereas they were clearly visible in PH-1. The H3K36A mutant mirrored Δset2/ash1 phenotypes, including defects in growth, conidiation, virulence, and DON biosynthesis.
Subsequently, we evaluated the sensitivity of all mutants to various abiotic stresses (Fig. 3J; Supplemental Fig. S4). Compared to PH-1, Δash1 and Δset2 exhibited increased sensitivity to osmotic stress agents KCl and NaCl and to the cell membrane stress agent sodium dodecyl sulfate (SDS). However, these single deletion mutants showed significantly increased tolerance to oxidative stress induced by hydrogen peroxide (H2O2) and vitamin K3. Moreover, Δset2 displayed heightened sensitivity to the fungicide tebuconazole but increased tolerance to the ionic stress agent CaCl2. In contrast, Δash1 exhibited an opposite pattern of sensitivity to tebuconazole and CaCl2 relative to Δset2. Both Δash1/set2 and the H3K36A mutant showed increased sensitivity to all tested stress agents. Taken together, these findings indicate that Set2 and Ash1 have both overlapping and distinct functions in regulating fungal development, virulence, secondary metabolism, and response to diverse abiotic stresses.
Distinct contributions of Ash1 and Set2 to H3K36me3
To investigate the roles of Ash1 and Set2 in H3K36me3 and transcriptional regulation, we performed chromatin immunoprecipitation sequencing (ChIP-seq) to profile H3K36me3 distribution in PH-1, Δset2, and Δash1 strains. In PH-1, we identified 8390 significant H3K36me3 peaks. In contrast, Δset2 had 2366 peaks, whereas Δash1 showed 4610 peaks. Over 85% of peaks in both mutants overlapped with PH-1 (Fig. 4A), indicating substantial yet distinct contributions from the two enzymes. Δset2 showed increased H3K36me3 enrichment at transcriptional start sites (TSSs) but reduced methylation across gene bodies. Conversely, Δash1 displayed diminished H3K36me3 at TSSs, with other genomic regions largely unaffected. These observations suggest that Set2 primarily deposits H3K36me3 within gene bodies, whereas Ash1 preferentially targets TSS regions (Fig. 4B,C).
Ash1 and Set2 deposit H3K36me3 in distinct genomic regions of F. graminearum. (A) Venn diagram of H3K36me3 peaks in PH-1, Δset2, and Δash1 strains. (B) Heat maps showing genome-wide H3K36me3 signal intensity across all genes within 2.0-kb genomic regions in PH-1, Δset2, and Δash1. TSS: Transcription start site; TTS: transcription termination site. (C) Metagene plots showing H3K36me3 distribution across target transcription units and adjacent intergenic regions in PH-1, Δset2, and Δash1. (D) Integrative Genomics Viewer (IGV) tracks of H3K36me3 ChIP-seq signals across four chromosomes in PH-1, Δset2, and Δash1. Y-axis: reads per million (RPM), normalized to total mapped reads. mRNA abundance profiles in PH-1 shown as reference.
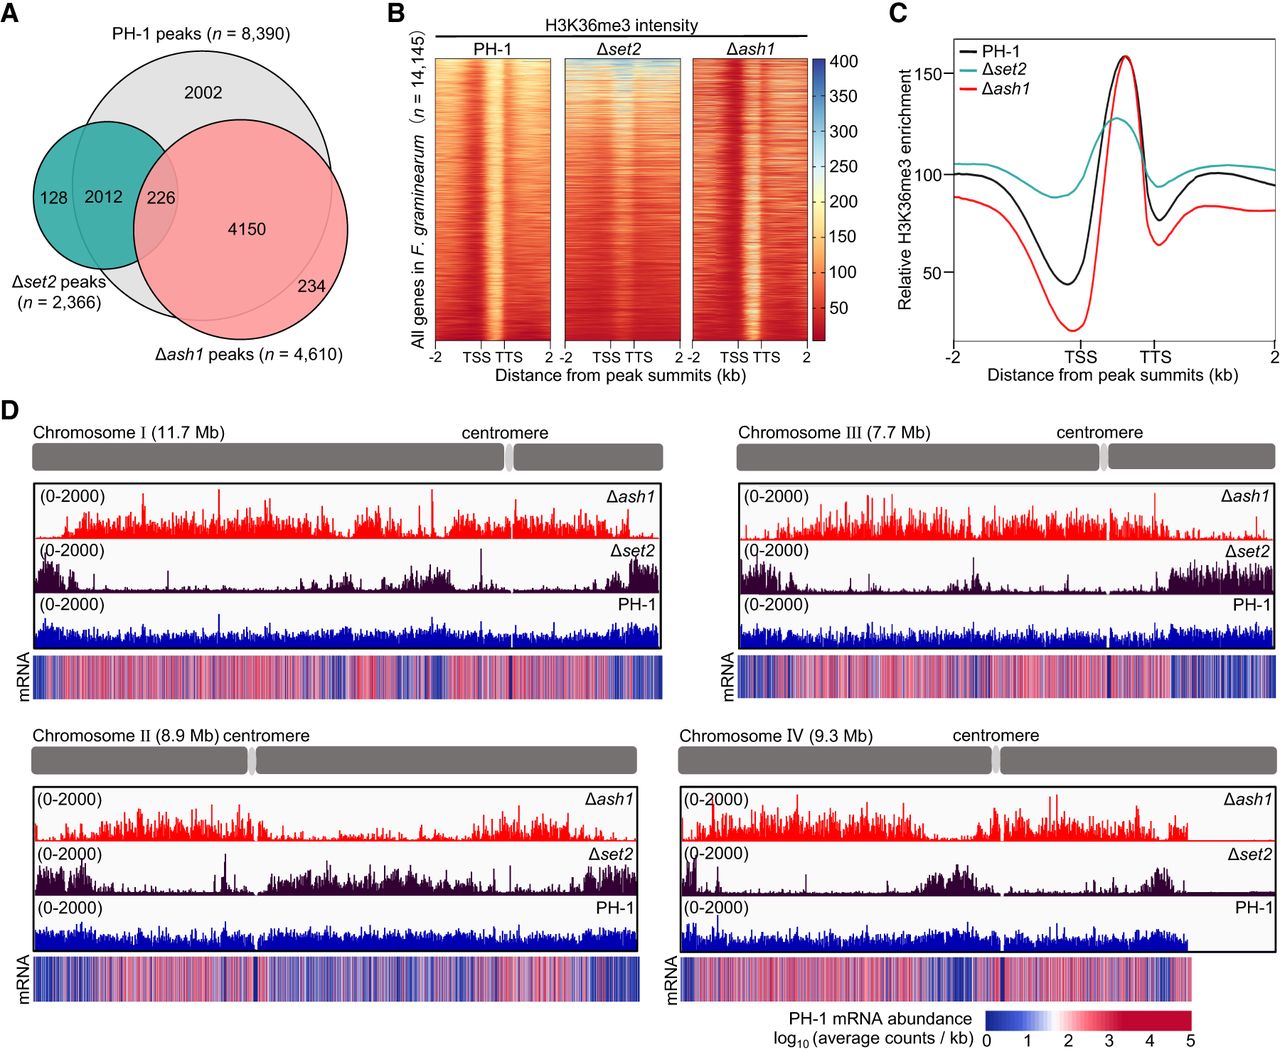
Integrative Genomics Viewer (IGV) (Thorvaldsdóttir et al. 2013) tracks showed H3K36me3 in PH-1 is broadly distributed across all four chromosomes, with notable absence in centromeric regions (Fig. 4D). Δset2 and Δash1 mutants displayed distinct, mutually exclusive H3K36me3 patterns, collectively recapitulating the wild-type H3K36me3 landscape. Specifically, H3K36me3 was mainly enriched in telomeric and centromere-proximal regions in Δset2, whereas Δash1 showed H3K36me3 enrichment in euchromatic regions. To explore the functional significance of these patterns, we examined the relationship between H3K36me3 distribution and mRNA expression in PH-1 (Fig. 4D). Ash1-mediated H3K36me3 was enriched in genes with low or no expression, whereas Set2-mediated H3K36me3 was found in highly expressed genes. These findings suggest that Ash1 and Set2 contribute differently to H3K36me3 deposition, with Ash1 primarily in facultative heterochromatin regions and Set2 in transcriptionally active euchromatin.
Set2 and Ash1 differentially regulate H3K36me3-marked gene expression
To elucidate the regulatory functions of Set2- and Ash1-mediated H3K36me3, we integrated ChIP-seq with RNA-seq to correlate H3K36me3 enrichment and gene expression. We first identified genomic regions with significantly reduced H3K36me3 occupancy in Δset2 and Δash1 mutants. In Δset2, 5025 H3K36me3 peaks associated with 5680 genes were significantly diminished, whereas Δash1 showed 3810 peaks linked to 3813 genes with reduced H3K36me3 (Fig. 5A). Notably, in Δset2, 60.3% of reduced H3K36me3 signals were confined to gene bodies, whereas in Δash1, reductions occurred in both promoters (42.7%) and gene bodies (49.6%) (Supplemental Fig. S5A). We then performed RNA-seq on PH-1, Δset2, Δash1, and Δset2/ash1 under the same ChIP-seq conditions. Principal component analysis (PCA) revealed distinct transcriptomic profiles for Δset2 and Δash1 compared to PH-1, with the double mutant clustering closer to Δset2 (Fig. 5B). Compared to PH-1, Δset2 exhibited 1002 differentially expressed genes (DEGs), with 604 upregulated and 398 downregulated (Supplemental Fig. S5B). In contrast, Δash1 exhibited a more pronounced transcriptional effect, with 3317 DEGs (1893 upregulated and 1424 downregulated (Supplemental Fig. S5C). At the genomic scale, H3K36me3-marked genes in PH-1 did not differ significantly in expression from nonmarked genes (P = 0.062) (Fig. 5C). However, in the Δset2 and Δash1, H3K36me3-marked genes were downregulated in Δset2 but upregulated in Δash1, suggesting opposing regulatory roles for Set2 and Ash1 in gene expression (Fig. 5C). Beyond its role in gene regulation, Set2-mediated H3K36me3 suppresses cryptic transcription in other eukaryotes (Carrozza et al. 2005; Kim et al. 2016; DiFiore et al. 2020; Lee et al. 2021). To determine whether this function is conserved in F. graminearum, we analyzed read distributions across ORF regions to detect aberrant transcription initiation within gene bodies. Compared to PH-1, cryptic transcription emerged at 67 genes in Δset2, all marked by Set2-dependent H3K36me3 across their gene bodies (Supplemental Fig. S6; Supplemental Table S6). These findings indicate Set2-mediated H3K36me3 contributes to both transcriptional regulation and cryptic transcription suppression in F. graminearum.
Distinct transcriptional roles of Set2 and Ash1 via H3K36me3 in F. graminearum. (A) Heat maps of Ash1- and Set2-dependent H3K36me3 peaks across all genes ±3.0 kb. (B) Principal component analysis (PCA) of transcriptomes for PH-1 and deletion mutants. (C) Violin plots of expression for genes with/without H3K36me3. Different letters indicate statistically significant differences among all groups shown. (D) Venn diagram: Δash1 upregulated versus Ash1 targets (top); Δset2 downregulated versus Set2 targets (bottom). RF: Representation factor. (E,F) Gene Ontology (GO) enrichment of overlapping sets in D. (G) IGV tracks of H3K36me3 and RNA expression of LEU1 in PH-1, Δset2, and Δash1. (H) Colony morphology of strains on FGA (fructose gelatin agar) medium with/without 0.3 mM leucine after 3 days. (I) Mycelial dry weight of strain of incubation in liquid FGM with/without 0.3 mM leucine after 3 days (25°C, 180 rpm). Different letters indicate statistically significant differences within each treatment condition. (J) IGV tracks of H3K36me3 and RNA expression of STF in PH-1, Δset2, and Δash1. (K) Perithecium formation in mating cultures at 14 days postfertilization. Scale bar, 0.5 cm. (L) IGV tracks of H3K36me3 and RNA expression of NRPS7 in PH-1, Δset2, and Δash1. (M) Ultraperformance liquid chromatography-mass spectrometry (UPLC-MS) ion chromatograms of fusaristatin A in PH-1 (blue) and Δash1 (red). Peaks: m/z 659.43 ([M+H]+) and 681.41 ([M+Na]+). (N) IGV tracks of H3K36me3 and RNA expression of CHSA in PH-1, Δset2, and Δash1. (O) Colony morphologies on CM with Congo red (CR, 0.2 g/L) or calcofluor white (CFW) (100 mg/L) at 3 days. (P) Inhibition rates under indicated stress conditions. Different letters indicate statistically significant differences within each treatment condition. Data in I and P represent the mean ± s.d. of three independent experiments. For panels C, I, and P, statistical significance (P < 0.05) was determined by ANOVA followed by Tukey's multiple comparisons test.
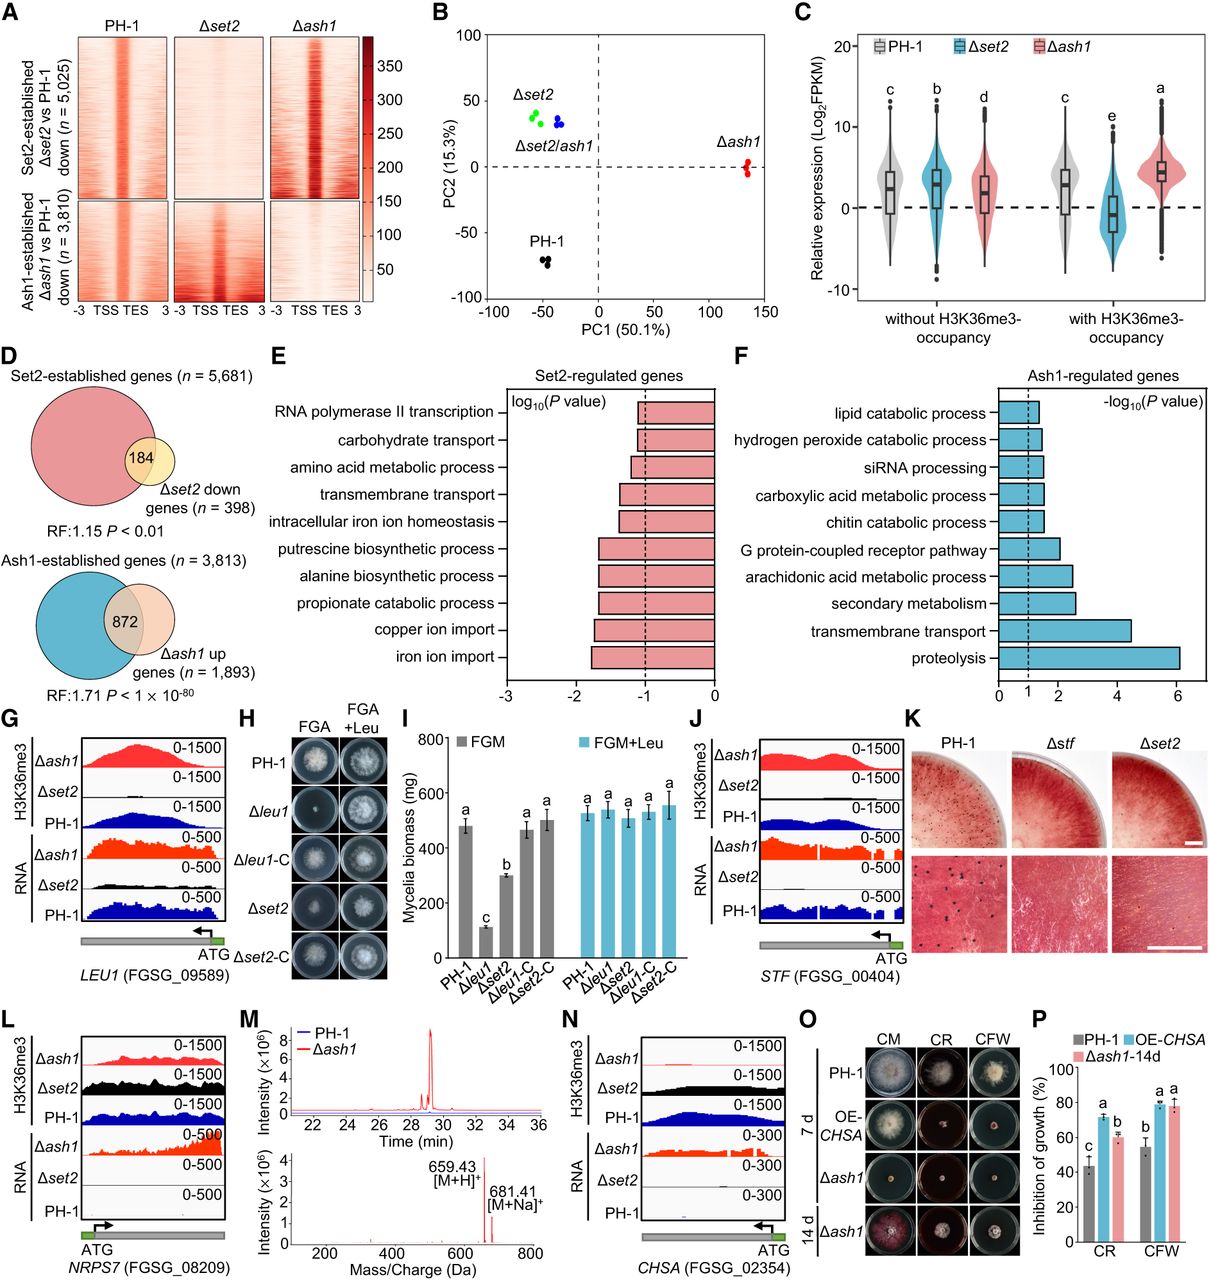
To further elucidate the regulatory interplay of Set2- and Ash1-mediated H3K36me3 and their impact on gene expression, we investigated the relationship between H3K36me3-enriched genes and DEGs in Δash1 and Δset2. Our results showed a substantial overlap, with 46.2% (184/398) of downregulated genes in Δset2 linked to Set2-dependent H3K36me3, and 46.1% (872/1893) of upregulated genes in Δash1 linked to Ash1-mediated H3K36me3 (Fig. 5D). These overlapping genes were defined as direct targets of Set2 or Ash1. Gene Ontology (GO) analysis revealed that Set2-regulated genes were enriched in pathways related to metal ion transport, putrescine and β-alanine biosynthesis, and RNA polymerase II transcription (Fig. 5E). Ash1-regulated genes were enriched in proteolysis, siRNA processing, and secondary metabolite biosynthesis (Fig. 5F).
To validate these roles, we selected two candidate genes from each Set2- and Ash1-regulated sets and constructed corresponding deletion mutants for phenotypic assessment. For Set2, we selected LEU1 (FGSG_09589), encoding isopropyl malate isomerase, and STF (FGSG_00404), a sexual-specific transcription factor. Both genes showed reduced H3K36me3 in their coding regions and decreased transcript levels in Δset2 (Fig. 5G,J). Phenotypic analysis revealed Δleu1 exhibited significantly impaired growth on solid and liquid FGA medium without leucine supplementation (Fig. 5H,I), and Δstf exhibited defective perithecium formation (Fig. 5K). Notably, Δset2 exhibited partial phenotypes resembling Δleu1 and Δstf, suggesting Set2 regulates leucine biosynthesis and sexual development. For Ash1, we selected NRPS7, involved in fusaristatin A biosynthesis, and CHSA (FGSG_02354), encoding chitinase. Both genes showed reduced H3K36me3 at their promoter and/or coding regions, with elevated expression in Δash1 (Fig. 5L,N). As expected, fusaristatin A production increased in Δash1 compared to PH-1 (Fig. 5M). In addition, CHSA overexpression led to increased sensitivity to cell wall stress, paralleling Δash1 (Fig. 5O,P). Collectively, these results indicate that Set2 and Ash1 play distinct roles in the transcriptional landscape of H3K36me3-marked genes in F. graminearum, with Set2 associated with actively transcribed genes and Ash1 enriched at loci with lower transcriptional activity.
Ash1 activity modulates H3K27me3 accumulation
Previous studies have shown that H3K27me3 is deposited by Kmt6, the catalytic subunit of PRC2, marking facultative heterochromatin and mediating transcriptional repression in F. graminearum (Connolly et al. 2013; Tang et al. 2021). Notably, Ash1-catalyzed H3K36me3 is also enriched in facultative heterochromatin and implicated in transcriptional repression, partially overlapping in genomic distribution with H3K27me3 (Fig. 6A). In Δash1, we observed a substantial global reduction in H3K27me3, whereas no decrease was detected in Δset2 (Fig. 6B). ChIP-seq further confirmed this, revealing significantly reduced H3K27me3 occupancy in Δash1 compared to PH-1 (Fig. 6C). These observations suggest functional cross-talk between Ash1-mediated H3K36me3 and H3K27me3 in gene expression regulation.
Ash1 modulates H3K27me3 deposition and target gene transcription. (A) IGV tracks of H3K36me3 in Δset2 and H3K27me3 in PH-1 across all four chromosomes. (B) Immunoblot analysis of H3K27me3 levels in PH-1 and deletion mutants. Relative intensities were quantified using ImageJ; anti-H3 as a loading control. (C) Metagene plots and heat maps of average H3K27me3 distribution in PH-1 and Δash1 around H3K27me3-marked genes (±2.0 kb). (D) Venn diagrams of overlap between H3K27me3-marked genes and Ash1-dependent H3K36me3-marked genes. (E) GO enrichment analysis of overlapping genes from D (n = 1092). (F,G) Heat maps of loci with increased (F) or decreased (G) H3K27me3 in Δash1, with corresponding transcript changes. (H,I) IGV tracks of H3K36me3/H3K27me3 and expression for MFS1, LPP1 (H), and P450A, P450B (I) in PH-1 and Δash1.
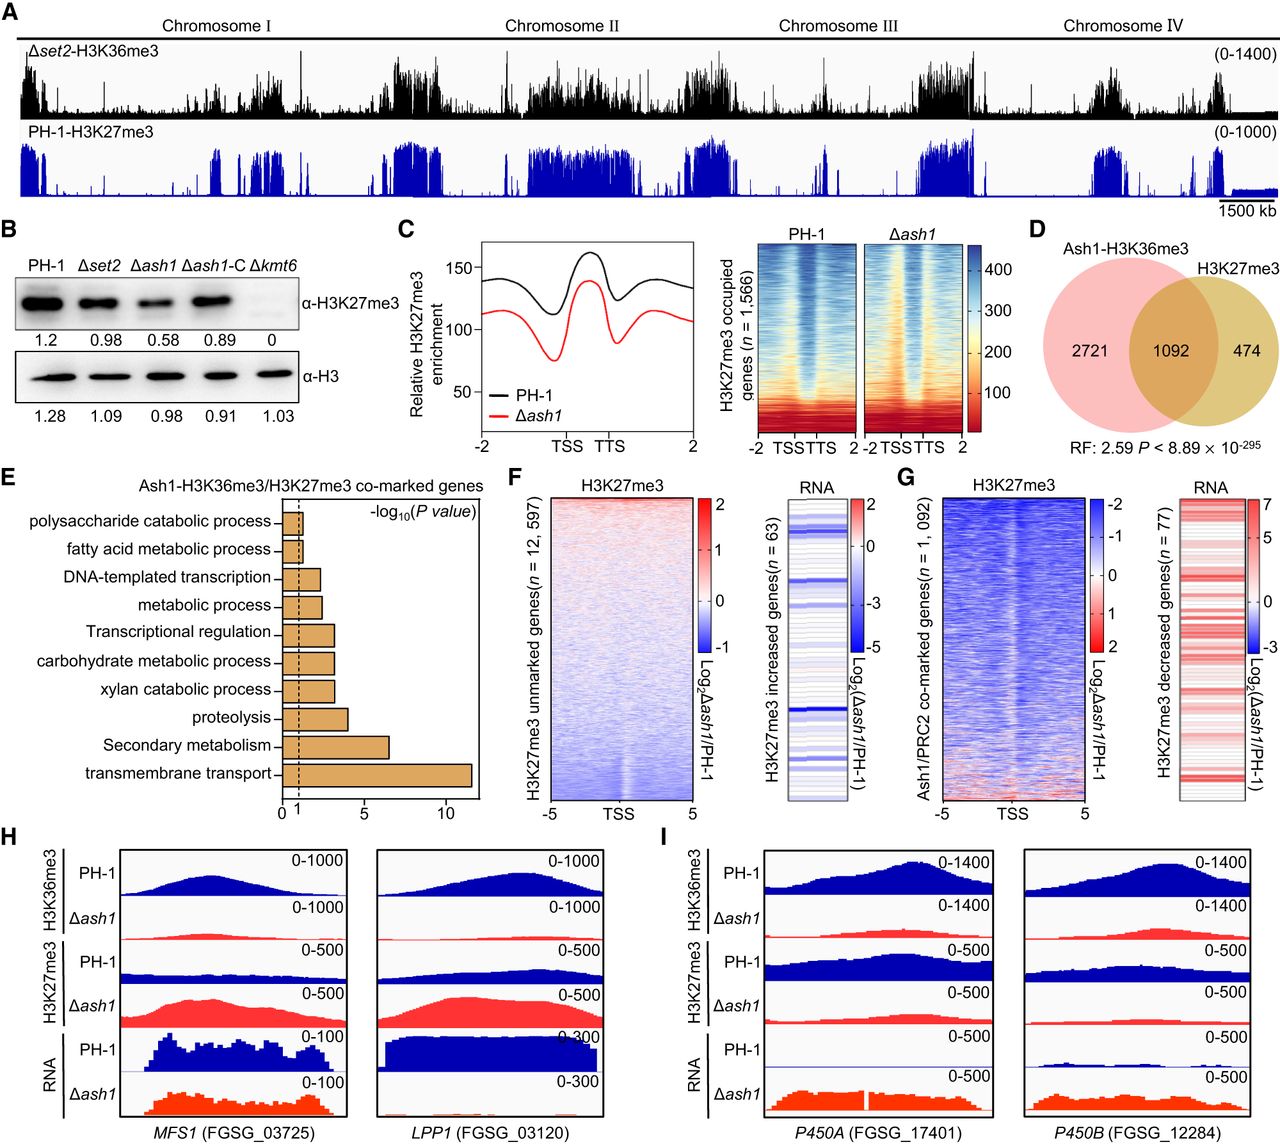
Approximately 70% (1092/1566) of H3K27me3-enriched genes were also co-occupied by Ash1-mediated H3K36me3 (Fig. 6D). GO analysis revealed these comarked genes were predominantly enriched in transport and secondary metabolism (Fig. 6E). To assess whether Ash1 influences H3K27me3 deposition, we analyzed H3K27me3 ChIP-seq profiles in Δash1. Loss of ASH1 led to increased H3K27me3 occupancy at 63 genes, with 17 having reduced transcript levels (Fig. 6F). Conversely, 77 genes showed decreased H3K27me3 enrichment, with 42 displaying transcriptional upregulation (Fig. 6G). For instance, MFS1 (FGSG_03725) and LPP1 (FGSG_03120), which gained H3K27me3 in Δash1, showed reduced expression, indicating Ash1-dependent H3K36me3 may promote repression by facilitating H3K27me3 accumulation (Fig. 6H). In contrast, two cytochrome P450 genes that lost both H3K36me3 and H3K27me3 in Δash1 showed increased expression, indicating transcriptional derepression (Fig. 6I). Together, these findings suggest that Ash1-mediated H3K36me3 exerts dual roles in modulating H3K27me3 dynamics, enabling both repression and activation of comarked genes in F. graminearum.
H3K36me3 coordinates with H3K27me3 in secondary metabolism regulation
Secondary metabolite (SM) gene clusters, including polyketide synthases (PKSs), nonribosomal peptide synthases (NRPSs), terpene synthases (TPSs), and cytochrome P450s, are predominantly located in telomeric and pericentromeric regions of the F. graminearum genome. Previous studies show that Kmt6 represses SM gene expression through H3K27me3 deposition (Tang et al. 2021; Atanasoff-Kardjalieff and Studt 2022). Loss of H3K27me3 in Δkmt6 derepressed genes involved in SM biosynthesis. Given H3K36me3 enrichment in telomeric and pericentromeric regions and Ash1's role in modulating H3K27me3 deposition, we investigated whether H3K36me3 contributes to SM regulation in F. graminearum.
Heat map analysis revealed that primary metabolism gene expression remained largely unaffected in Δash1, Δset2, and Δset2/ash1, consistent with patterns in Δkmt6 (Fig. 7A). In contrast, SM genes exhibited greater transcriptional variability, particularly in Δash1, where 35.8% (245/683) of SM genes were differentially expressed. A similar trend was observed in Δkmt6, which showed differential expression of 59.5% (407/683) SM genes (Fig. 7B). Notably, 130 SM genes were upregulated in both Δash1 and Δkmt6 (Fig. 7C). Furthermore, 85% of SM genes upregulated in Δash1 were restored to wild-type expression in Δset2/ash1, suggesting Set2 also participates in their regulation (Fig. 7B,C). Further analysis identified 62 key SM genes, including PKSs, NRPSs, TPSs, and cytochrome P450s, marked by H3K36me3 in PH-1 and showing significant changes in the single or double mutants (Fig. 7D). Among these, 34 genes were comarked by H3K36me3 and H3K27me3 and showed elevated expression in Δash1 (Fig. 7D). ChIP-seq showed a substantial reduction in both H3K36me3 and H3K27me3 at the promoters and gene bodies of derepressed genes in Δash1, with H3K36me3 levels nearly abolished at promoters (Fig. 7E).
Ash1 regulates secondary metabolism via H3K36me3-H3K27me3 interplay. (A,B) Heat maps of transcript changes in primary metabolism (A, n = 2590) and secondary metabolism (SM) genes (B, n = 683) across mutants. (C) Overlap of upregulated SM genes in Δash1 and Δkmt6. (D) Heat maps of PKS, NRPS, and P450 expression changes in mutants. H3K36me3 and H3K27me3 enrichment in PH-1 is marked (√, enriched; ×, not enriched). (E) Metagene plots of average H3K36me3 and H3K27me3 in PH-1 and Δash1 over upregulated gene from D (±2.0 kb). (F) IGV tracks of H3K27me3 and H3K36me3 across cluster C62. Bar graph shows transcriptional changes of genes within the cluster. (G,H) ChIP-qPCR analysis of H3K36me3 and H3K27me3 enrichment at the promoter (P1), 5′ (F1), and 3′ (F2) region of AUR1 (G) and PKS12 (H) in PH-1 and Δash1. Different letters indicate significant differences between PH-1 and Δash1 at each indicated region. (I) Relative expression of AUR1 and PKS12. Expression levels in PH-1 were set to 1, with ACTIN as the internal normalization control. Different letters indicate statistically significant differences among all groups. Error bars, s.d. (n = 3). Student's t-test (P < 0.05). (J,K) Δash1 shows pigment overproduction on CM plates and in liquid cultures. (L) Colony morphologies and diameters of strains grown on CM for 3 days. (M) Suppressor sectors (red arrows). Colony morphologies and diameters of strains grown on CM for 3 days. Data are mean ± s.d. (n = 3). (N) Spontaneous suppressor mutations in CTK1 and SET2. (fs) frameshift. (O) RT-qPCR of representative SM genes in PH-1, Δash1, Δset2/ash1, and Δctk1/ash1 strains. ACTIN served as the normalization control. Different letters indicate statistically significant differences among the strains for each gene. Data in G, H, I, L, M, and O are presented as mean ± s.d. from three independent experiments. Statistical significance (P < 0.05) was determined as follows: Student's t-test was used for pairwise comparisons in G and H, whereas ANOVA followed by Tukey's multiple comparisons test was used for multiple group comparisons in I and O. Error bars, s.d. (n = 3).
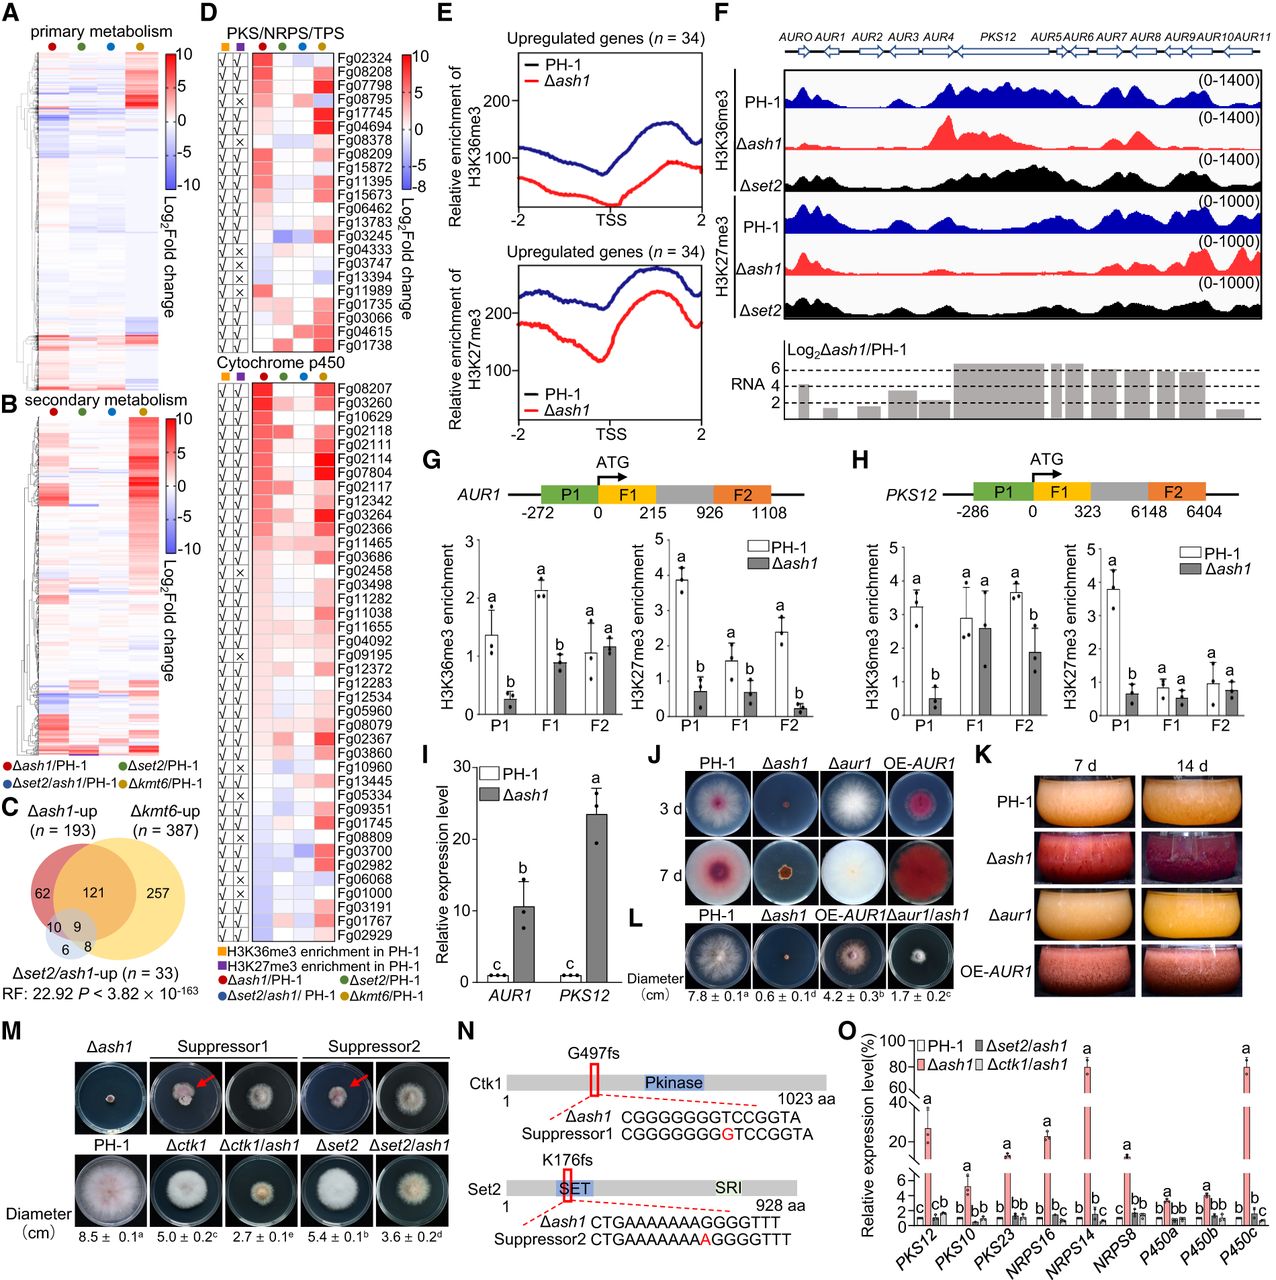
To further elucidate Ash1's effects on SM gene regulation, we analyzed the aurofusarin biosynthetic gene cluster as an example (Fig. 7F). All 13 genes in this cluster were upregulated in Δash1, coinciding with reductions of H3K36me3 and H3K27me3 at their promoters (Fig. 7F). This trend was further validated by ChIP-qPCR and RT-qPCR for two representative genes—AUR1, encoding the transcription factor, and PKS12, encoding polyketide synthase. Both genes exhibited decreased promoter enrichment of H3K36me3 and H3K27me3, with increased transcript levels (Fig. 7G–I). Notably, H3K36me3 enrichment across the gene bodies of several cluster genes, including AUR4, PKS12, AUR8, and AUR9, was not altered in Δash1 (Fig. 7F). Elevated expression of the aurofusarin biosynthesis cluster in Δash1 led to increased pigment accumulation on CM plates and in liquid cultures (Fig. 7J,K). Additionally, AUR1 overexpression under a constitutive tubulin promoter (∼25-fold increase) enhanced pigment production but reduced vegetative growth by ∼70% compared to PH-1 (Fig. 7J,L). Subsequent experiments revealed that purified aurofusarin significantly suppressed mycelial growth, conidiation, and conidial germination in PH-1 (Supplemental Fig. S7). These suggest that the growth defects in Δash1 are partially due to increased aurofusarin production. To test this, we generated a Δash1/aur1 double mutant, which partially rescued the growth defects in Δash1 (Fig. 7L). These findings show that Ash1-mediated H3K36me3 and Kmt6-mediated H3K27me3 cooperatively repress SM gene expression via promoter occupancy and that growth defects in Δash1 are partially due to overproduction of toxic SMs, such as aurofusarin.
As observed, Δash1 exhibited phenotypic instability, producing fast-growing sectors after 2 weeks of incubation. Whole-genome resequencing of two suppressor mutants identified frameshift mutations in CTK1 (FGSG_16718) and SET2 (FGSG_05558) (Fig. 7M,N). Previous studies show that Ctk1, a cyclin-dependent kinase, phosphorylates the C-terminal domain (CTD) of RNA polymerase II (RNAPII) at serine 2 (Ahn et al. 2004; Röther and Sträßer 2007), facilitating Set2 recruitment and H3K36me3 deposition during transcription elongation (Youdell et al. 2008; Dronamraju and Strahl 2014). We hypothesize that frameshift mutations in Ctk1 and Set2 impair transcription elongation, particularly in SM genes, which partially alleviates the growth defects in Δash1. Consistent with this, transcript levels of representative SM genes were reduced in both Δash1/ctk1 and Δash1/set2 compared to Δash1 (Fig. 7O). Moreover, the growth rates of these double mutants were faster than Δash1 and comparable to the suppressor strains (Fig. 7M).
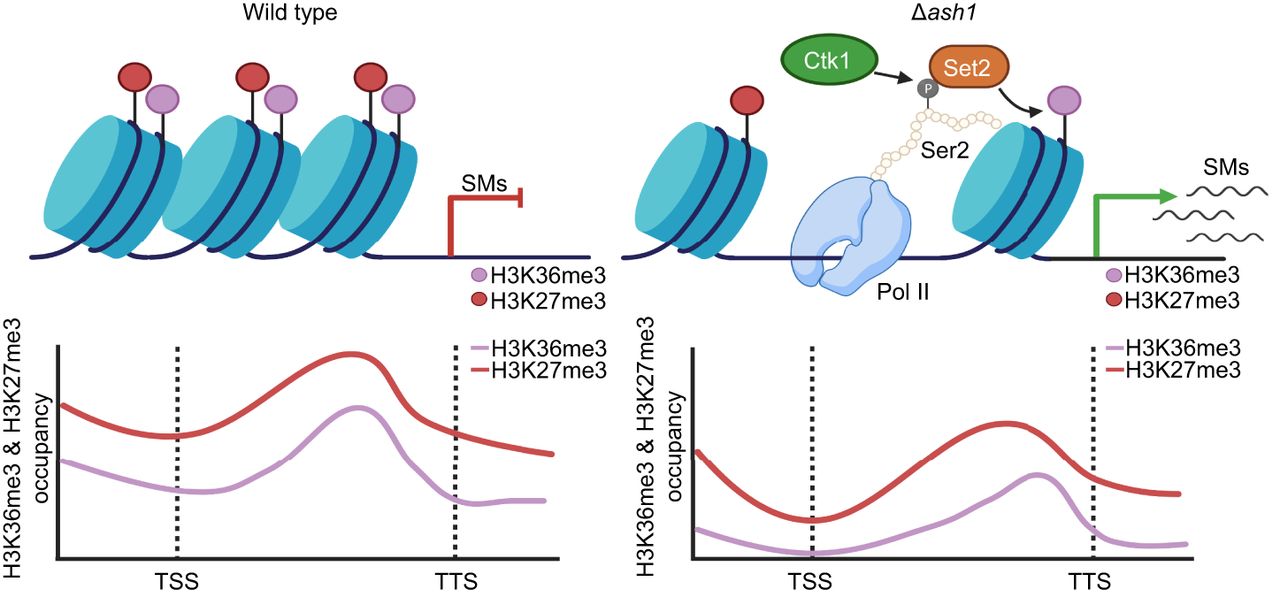
In conclusion, these findings highlight the cooperative roles of H3K36me3 and H3K27me3 in regulating SM gene expression. In PH-1, SM gene promoter regions are co-occupied by Ash1-catalyzed H3K36me3 and PRC2-catalyzed H3K27me3, maintaining transcriptional repression. Deletion of ASH1 results in a near-complete loss of H3K36me3 at SM gene promoters, with a marked reduction in H3K27me3 enrichment. This epigenetic disruption relieves repression, leading to SM gene activation. Set2 catalyzes H3K36me3 in the SM gene coding regions, playing a key role in elongation. This process is facilitated by Ctk1 kinase, which phosphorylates Ser2 residues in RNAPII's CTD, transitioning RNAPII into a highly phosphorylated state. Phosphorylated Ser2 enables Set2 recruitment to coding regions, where it catalyzes H3K36me3, ensuring efficient transcription elongation. Importantly, H3K36me3 levels in SM gene coding regions remain robust in Δash1, highlighting its critical role in sustaining transcription elongation of SM genes (Fig. 8).
Model of H3K36me3-H3K27me3 interplay in regulating secondary metabolism gene expression. In PH-1, SM genes are repressed by Ash1-catalyzed H3K36me3 (purple) and PRC2-medicated H3K27me3 (red) at promoters (left). ASH1 deletion causes loss of H3K36me3 and reduced H3K27me3, releasing repression and activating transcription (right). During elongation, kinase Ctk1 phosphorylates the Ser2 residue of the C-terminal domain (CTD) of RNA polymerase II (Pol II), facilitating Set2 recruitment. Set2 deposits H3K36me3 along gene bodies to sustain elongation of activated SM genes. Green arrow, activation; red arrow, repression. Figure created with BioRender (https://www.biorender.com).
Discussion
The SET domain is a conserved catalytic domain in HMTs, studied across diverse species (Veerappan et al. 2008; Herz et al. 2013). Previous evolutionary analyses, using limited genomic data sets, suggest SET domain proteins undergo dynamic processes, including gene loss, duplication, and functional diversification (Zhang and Ma 2012; Zhu et al. 2013). Here, we extend these findings by analyzing 18,718 SET domain proteins from 1038 fungal species, providing a comprehensive survey across the fungal kingdom. A positive correlation between SET domain proteins and genome size suggests adaptive expansion during fungal evolution. Most fungal HMTs clustered into conserved groups, with Set2 and Ash1 showing distinct evolutionary paths. Set2 proteins are conserved across nearly all analyzed species, whereas Ash1 homologs are absent in a third of species, suggesting lineage-specific loss or functional replacement. Phylogenetic analyses suggest early divergence of Set2 and Ash1, highlighting their nonredundant roles. Functional studies in F. graminearum confirm that Set2 and Ash1 mediate H3K36me3 at distinct loci, with Set2 acting in euchromatin linked to active genes and Ash1 depositing it in heterochromatin to repress transcription. These findings highlight the complementary, nonredundant functions of Set2 and Ash1 in chromatin and gene expression. Moreover, our analysis revealed that the absence of Kmt6 in 417 species, except Ash1, suggests a shared evolutionary history among HMTs associated with heterochromatic silencing, highlighting the precision of histone methylation in gene regulation. In fungi lacking both Ash1 and Kmt6, alternative silencing strategies likely compensate for the absence of classical methylation marks. For instance, short double-stranded RNAs induce RNA silencing through distinct mechanisms (Meister and Tuschl 2004). Telomere-associated factors such as DNA helicase Dna2p, telomerase Dot1, and ubiquitinase Dot4p may also contribute to gene silencing (van Leeuwen et al. 2002; Gardner et al. 2005).
H3K36me3 is a cotranscriptional modification that facilitates transcription elongation and is implicated in repression (Wagner and Carpenter 2012). With increasing functional characterization across fungal species, evidence suggests that H3K36me3's regulatory role varies across distinct chromatin contexts (Suzuki et al. 2016; Bicocca et al. 2018). Beyond its conserved role in cotranscriptional histone modification, where Set2 associates with elongating RNAPII to deposit H3K36me2/3 along coding regions, several studies have uncovered additional functions of Set2. Loss of SET2 in Saccharomyces cerevisiae leads to increased histone exchange and H3K56ac accumulation within gene bodies, facilitating aberrant transcriptional activation (Venkatesh et al. 2012). Set2-mediated H3K36 methylation is critical for proper pre-mRNA splicing, and its absence impairs splice site recognition, leading to unstable transcripts or pre-mRNA degradation, reducing transcriptional levels (Li et al. 2016; Bhattacharya et al. 2021). In F. graminearum, H3K36me3-mediated regulation is context-dependent and governed by two distinct HMTs: Set2 and Ash1. Set2 functions in euchromatin to sustain transcription, whereas Ash1 operates in heterochromatin to mediate silencing. H3K36me3 levels were reduced across gene bodies in Δset2, while promoter enrichment increased. Conversely, Δash1 retained H3K36me3 in the gene body but showed reduced enrichment at promoters. These patterns highlight the distinct activities of Set2 and Ash1, with Set2 in coding regions and Ash1 at promoters. Beyond gene expression regulation, Set2-mediated H3K36me3 suppresses cryptic transcription initiation and restores chromatin compaction after RNA polymerase II passes (Carrozza et al. 2005; Kim et al. 2016). Consistent with this, compared to PH-1, we identified 67 genes with cryptic transcription in Δset2. These findings suggest that Set2-mediated H3K36me3 is critical for transcriptional fidelity by preventing cryptic transcription in gene bodies, likely conserved across fungi and other eukaryotes.
Previous studies show that H3K27me3 and H3K36me3 are mutually exclusive on the same histone H3 and rarely co-occur across the genome (Schmitges et al. 2011; Alabert et al. 2020). However, we found that a significant portion of Ash1-marked chromatin displayed H3K27me3. In F. graminearum, loss of Ash1-dependent H3K36 methylation was linked to both decreases and increases in H3K27me3, suggesting complex interplay between these modifications. Notably, loss of ASH1 led to increased H3K27me3 at 63 genes; however, only 17 exhibited reduced transcript levels. This limited transcriptional response is likely due to the chromatin context of Ash1-regulated genes, which are in heterochromatic regions where expression is low or silent. Transcriptomic analysis further supported this, showing that, of 63 Ash1-regulated genes with increased H3K27me3 in Δash1, 17 were downregulated, 28 were silent in PH-1, and 18 showed no significant change (Supplemental Table S7). These findings suggest that the repressive effect of the newly deposited H3K27me3 in Δash1 is similar to the repression conferred by H3K36me3 at these loci. In addition to the interplay between H3K36me3 and H3K27me3, we observed altered levels of H4K20me3 in Δash1 (Fig. 2C,D), suggesting a functional connection between Ash1-mediated H3K36me3 and H4K20me3 in F. graminearum. To investigate this, we performed genome-wide profiling of H4K20me3 by ChIP-seq in both PH-1 and Δash1. Our analysis revealed that H4K20me3 is distributed across the F. graminearum genome (Supplemental Fig. S8A). Comparative analysis identified 874 significantly upregulated peaks and 1003 significantly downregulated peaks in Δash1 (Supplemental Fig. S8B,C). The upregulated peaks were enriched in euchromatic regions, whereas the downregulated peaks were in facultative heterochromatin, showing a pattern similar to Zymoseptoria tritici(Möller et al. 2023). The regulatory relationships among H3K36me3, H3K27me3, and H4K20me3 warrant further investigation to elucidate their roles in chromatin-based gene regulation.
Set2 and Ash1 play essential, distinct roles in chromatin-based regulation affecting fungal growth, virulence, and secondary metabolism (Gu et al. 2017; Bicocca et al. 2018; Janevska et al. 2018; Zhuang et al. 2022; Xu et al. 2023). In F. graminearum, Δash1 exhibited a severe growth defect, with its growth rate reduced by ∼90%, a phenotype more drastic than in other fungi (Janevska et al. 2018; Zhuang et al. 2022; Xu et al. 2023). Notably, this severe growth defect was partially rescued in Δset2/ash1, suggesting a genetic interaction between Set2 and Ash1. This partial rescue may be due to the overexpression of genes typically silenced in PH-1 after ASH1 deletion. Supporting this, overexpression of AUR1 impaired mycelial growth, whereas deleting AUR1 in Δash1 partially rescued the defect. Deletion of both SET2 and ASH1 reduced virulence in F. graminearum, consistent with previous findings in other pathogenic fungi (Gu et al. 2017; Janevska et al. 2018; Xu et al. 2023). Fungal SMs are small molecules with diverse functions and applications in medicine, agriculture, and industry. Their biosynthesis is controlled by coexpressed genes in gene clusters. Most SM gene clusters remain silent due to tight regulation under laboratory conditions (Brakhage 2013). Environmental cues, chromatin accessibility, and histone modifications regulate the activation of these gene clusters (Brakhage 2013; Collemare and Seidl 2019). Efforts to activate silent SM gene clusters in fungi have primarily focused on histone acetylation and methylation (Yu and Keller 2005; Atanasoff-Kardjalieff and Studt 2022). Acetylation marks like H3K9ac and H3K27ac and H3K4 methylation are enriched at promoters of actively transcribed SM genes, promoting RNA polymerase II recruitment and transcription initiation (Liu et al. 2015). H3K27 methylation, deposited by PRC2, represses SM clusters in facultative heterochromatin under noninducing conditions (Connolly et al. 2013). Whereas these modifications are well characterized, the role of H3K36me3 in regulating SM gene expression is less understood but gaining attention due to its emerging significance. Deletion of SET2 in F. verticillioides caused defects in FB1 mycotoxin biosynthesis and pigmentation (Gu et al. 2017). In F. fujikuroi, deletion of SET2 and ASH1 reduced gibberellin production but elevated fusarins and fusaric acid level. ASH1 deletion reduced bikaverin production while increasing fusarubin levels (Janevska et al. 2018). Our findings reveal distinct, complementary roles for Set2 and Ash1 in regulating SM gene expression in F. graminearum. Ash1-mediated H3K36me3 cooperates with PRC2-dependent H3K27me3 at SM gene promoters to repress SM gene transcription. Deletion of ASH1 disrupts this balance, reducing H3K27me3 occupancy and activating SM gene clusters. Set2-mediated H3K36me3, enriched in SM gene bodies, facilitates transcriptional elongation and proper SM gene expression. These findings emphasize the complexity of chromatin-based regulation of SM. A deeper understanding of histone modifications like H3K36me3 and their interactions with other chromatin regulators will be critical for elucidating and harnessing fungal SM biosynthesis.
Methods
Identification of SET domain proteins in fungi
To systematically identify SET domain proteins across fungi, a total of 23.64 million protein sequences were retrieved from 1038 fungal genomes spanning nine phyla, all obtained from the NCBI database. Domain annotations were performed using Pfam (PF00856), SMART (SM000317), and InterPro (IPR001214). Proteins containing at least one SET domain were retained, resulting in the identification of 18,718 SET domain proteins. To investigate subfamily relationships, the identified sequences were clustered with CLANS v2.0 (https://github.com/inbalpaz/CLANS), a Python-based tool for sequence-similarity network analysis, executed in non-GUI mode with the “-nogui” flag.
Phylogenetic analysis of SET domain proteins in fungi
Phylogenetic reconstruction was performed for cluster 1, which contained 6640 sequences grouped into 11 groups. Multiple sequence alignments were generated with MAFFT v7.475 (Katoh and Standley 2013), and poorly aligned regions were removed using trimAl v1.4.1 (Capella-Gutiérrez et al. 2009) with the “gappyout” setting. A maximum-likelihood tree was inferred with FastTree v2.1 (Poon et al. 2010). The reference species tree for the 1038 fungal genomes was obtained from a previous study (Li et al. 2021), which established phylogenetic relationships using 290 single-copy BUSCO genes. To assess the distribution of major SET domain subfamilies, the average copy number of SET domain proteins was calculated across 42 fungal classes spanning seven phyla (each represented by more than one species). The groups examined included group03-H3K9, group04-H3K4, group06-Set2 (H3K36), group15-Ash1 (H3K36), group07-H4K20, and group14-H3K27.
Strain construction
The wild-type F. graminearum strain PH-1 (NRRL 31084) served as the parental strain for transformants generated in this study. All gene deletions, complementations, and H3K36A point mutation were generated using the double-joint PCR method (Supplemental Fig. S9A–C), and the resulting DNA fragments were introduced into protoplasts via polyethylene glycol (PEG)-mediated transformation as described previously (Yun et al. 2014). Transformants were selected on hygromycin (100 µg/mL) or neomycin (100 µg/mL), depending on the resistance cassette used, and verified by PCR or sequencing (Supplemental Fig. S9D–G). Primers used in this study are listed in Supplemental Table S8. Indel profiles of Δset2, Δash1, Δset2/ash1, complemented strains, and the H3K36A mutant were confirmed by whole-genome sequencing (WGS) (Supplemental Fig. S9H; Supplemental Table S9). For gene deletions, the ORF was replaced with either the hygromycin B phosphotransferase gene (HPH) or the neomycin resistance gene (NEO). Complementation strains of SET2 and ASH1 were generated by in situ replacement with GFP-tagged ORFs fused to flanking regions and the NEO cassette. The PH-1::Tri1-GFP strain was constructed using the same strategy. Double mutants (Δset2/ash1, Δash1/aur1, and Δash1/ctk1) were obtained by replacing the target ORF with the NEO cassette in the Δash1 background. The H3K36A allele was generated by substituting lysine with alanine at position 36 of HISTONE3 (FGSG_04290) and confirmed by sequencing. Overexpression of AUR1 and CHSA was driven by either the native TUB promoter (FGSG_09530) or the A. nidulans GPDA promoter (Frandsen et al. 2008), fused with the NEO cassette, and introduced into the corresponding deletion strains.
Pathogenicity and DON production assays
To evaluate the pathogenicity on wheat heads, 10 µL of conidial suspension (1 × 10⁵ conidia/mL) were injected into the central spikelet of individual flowering wheat heads. Each strain was tested on 15 biological replicates. The number of infected spikelets per head was recorded 14 days postinoculation (dpi). For wheat seedling stem assays, fresh wheat stems were inoculated with mycelial plugs, and lesion development was documented at 5 dpi. For deoxynivalenol quantification, strains were cultured in TBI liquid medium at 28°C in the dark with shaking at 150 rpm for 7 days. DON was extracted and quantified using a Deoxynivalenol (DON) ELISA kit (WS2024-011, Wise Science & Technology Development, Jiangsu, China) according to the manufacturer's instructions. DON assays were conducted with three independent biological replicates.
In vitro histone methyltransferase assay
In vitro HMT assays were performed as described previously (Zhang et al. 2024a). Each 200-µL reaction contained 10 µg of synthetic recombinant histone H3 peptide (PSTGGVKKPHRYKPGT), 2 µg S-adenosyl-L-methionine (Solarbio), and ∼100 µg of purified MBP-Set2, MBP-Ash1, or MBP control protein in HMT buffer (300 mM NaCl, 50 mM Tris-HCl [pH 7.5], 5% glycerol, 1 mM DTT). Reactions were incubated at 30°C for 20 h and terminated by adding SDS-PAGE loading buffer, followed by boiling at 95°C for 5 min. Reaction products were analyzed by western blot using anti-H3K36me3 (Abcam, #ab9050) and anti-H3K36me2 (Abcam, #ab9049,) antibodies, and by ultraperformance liquid chromatography-mass spectrometry (UPLC-MS) on a Waters UPLC system (Waters Corp.). Raw MS data were processed with PEAKS Studio X+ (Bioinformatics Solutions Inc.) and searched against the F. graminearum PH-1 protein database from UniProt. Search parameters were: parent mass tolerance, 10 ppm; fragment mass tolerance, 0.02 Da; maximum missed cleavages, 2; variable modifications, oxidation (M), mono-, di-, and trimethylation (K), acetylation (K, protein N-term); false discovery rate (FDR) < 1%; minimum peptide score, −10lgP ≥ 10. Label-free quantification was performed based on extracted-ion chromatogram peak areas. Peptide-spectrum matches and posttranslational modifications were validated using PEAKS’ built-in FDR estimation and manual inspection. Proteins identified with ≥2 unique peptides were considered confidently identified.
Chromatin immunoprecipitation and ChIP-seq analysis
ChIP assays were performed on PH-1, Δash1, and Δset2 strains using fresh mycelia grown in CM medium at 25°C for 24 h, following previously described protocols (Tang et al. 2021). Briefly, 0.6 g of mycelia was washed twice with cold PBS, crosslinked with 1% formaldehyde at 25°C for 10 min, and quenched with 125 mM glycine. Samples were lysed in buffer containing 50 mM Tris-HCl (pH 8.0), 10 mM EDTA, 1% SDS, and protease inhibitor cocktail. Chromatin was extracted on ice and sonicated to 200- to 500-bp fragments. A 20-µL aliquot of sonicated chromatin was reserved as input, and 100 µL were immunoprecipitated with 10 µg of anti-H3K36me3 (Abcam, #ab9050), anti-H3K27me3 (Active Motif, #39155), or anti-H4K20me3 (Active Motif, #91107) antibodies at 4°C overnight. The following day, 30 µL of protein A magnetic beads were added, and samples were incubated for 3 h. Beads were sequentially washed once with buffer I (20 mM Tris-HCl [pH 8.1], 50 mM NaCl, 2 mM EDTA, 1% Triton X-100, 0.1% SDS), twice with buffer II (10 mM Tris-HCl [pH 8.1], 250 mM LiCl, 1 mM EDTA, 1% NP-40, 1% sodium deoxycholate), and twice with TE buffer (10 mM Tris-HCl [pH 7.5], 1 mM EDTA). DNA was eluted in 300 µL elution buffer (100 mM NaHCO3, 1% SDS), treated with RNase A (8 µg/mL) at 65°C for 6 h, and digested with Proteinase K (345 µg/mL) overnight at 45°C. Immunoprecipitated DNA was used to construct sequencing libraries with the NEXTFLEX ChIP-seq Library Prep kit for Illumina (Bioo Scientific, #NOVA-5143-02) and sequenced on an Illumina NovaSeq 6000 platform using a paired-end 150-bp (PE150) strategy. Low-quality reads were filtered using Trimmomatic v0.36 (Bolger et al. 2014), and clean reads were mapped to the F. graminearum reference genome using BWA v0.7.15 (Li and Durbin 2009). PCR duplicates were removed with SAMtools v1.3.1 (Li et al. 2009). Peak calling was performed with MACS2 v2.1.1 (bandwidth, 300 bp; model fold, 5–50; Q-value ≤ 0.05) (Zhang et al. 2008). ChIP-seq results were validated by ChIP-qPCR using primers listed in Supplemental Table S8. Relative enrichment was calculated as fold enrichment (ChIP signal divided by mock signals). All experiments were conducted with three independent biological replicates.
Identification of cryptic transcription events
To identify genes potentially affected by cryptic transcription initiation in Δset2, a region-based intragenic coverage analysis was performed as described previously (McCauley et al. 2021). Gene bodies were divided into three segments: 5′ (upstream third), middle (central third), and 3′ (downstream third). Read counts for each segment were obtained using featureCounts v2.0.1 (Liao et al. 2014) with parameters -t exon -g transcript_id -f -O -T 8 -p -C, and normalized to TPM. For each gene, a middle-to-edge fold-change ratio was calculated as the read density in the middle segment divided by the average of the 5′ and 3′ segments, reflecting internal transcript accumulation indicative of cryptic initiation. Fold-change values were calculated separately for PH-1 and Δset2. Genes with a middle-to-edge ratio >1 in Δset2 and <1 in PH-1, and a log2 Δset2/PH-1 >1 were considered candidates exhibiting cryptic transcription initiation in Δset2.
Aurofusarin treatment assays in F. graminearum
To evaluate the biological effect of aurofusarin against F. graminearum, PH-1 conidia were germinated in 2% sucrose at 25°C in the dark for 5 h, after which aurofusarin was added at a final concentrations of 10 or 100 ppm. After 48 h, mycelia were harvested, dried, and weighed. For conidiation assays, PH-1 was cultured in CMC liquid medium supplemented with aurofusarin (10 or 100 ppm) at 25°C and 180 rpm in the dark for 5 days. Conidial yield and septation were quantified microscopically. To assess germination, conidia were incubated in 2% sucrose containing 10 or 100 ppm aurofusarin for 5 h under the same conditions. Samples were stained with calcofluor white (CFW) and examined under a fluorescence microscope.
Statistical analysis
All statistical analyses were conducted using IBM SPSS Statistics v27. Data are presented as mean ± standard deviation (s.d.). Differences between two groups were evaluated by a two-tailed Student's t-test. For multiple comparisons, one-way ANOVA followed by Tukey's multiple-range test was applied. P-values and representation factor (RF) for gene-set overlaps were calculated using Fisher's exact test in R (R Core Team 2025), assuming a total F. graminearum genome size of 14,145 genes. Correlation analysis between the total protein number and SET domain proteins across fungal species was performed using Pearson's correlation (linear regression) via the Bioinformatics online platform (https://www.bioinformatics.com.cn; last accessed 10 Dec 2024).
Data access
All raw and processed sequencing data generated in this study have been submitted to the Genome Sequence Archive at the National Genomics Data Center (https://ngdc.cncb.ac.cn/gsa) under BioProject ID PRJCA034518.
Competing interest statement
The authors declare no competing interests.
Acknowledgments
This work was funded by supported by the National Natural Science Foundation (32172356), the China National Key Research and Development Program (2022YFD1400100), China Agriculture Research System (CARS-3-1-15), and Fundamental Research Funds for the Central Universities (226-2024-00213, 226-2024-00070).
Author contributions: Y.C. designed and supervised the project; X.H. conducted most of the experiments; C.X., Y.R., M.G., J.Y., and X.W. performed gene deletion and virulence tests; C.L. and X-X.S. analyzed the RNA-seq data and the distribution and evolution of SET domain proteins. X.H. and Y.C. wrote the manuscript. Y.C., Q.G., and Z.M. revised the manuscript. All authors read and approved the manuscript.
Notes
[1] Supplementary material [Supplemental material is available for this article.]
[2] Article published online before print. Article, supplemental material, and publication date are at https://www.genome.org/cgi/doi/10.1101/gr.280560.125.
References
- ↵Ahn SH, Kim M, Buratowski S. 2004. Phosphorylation of serine 2 within the RNA polymerase II C-terminal domain couples transcription and 3′ end processing. Mol Cell 13: 67–76. 10.1016/S1097-2765(03)00492-1
- ↵Alabert C, Loos C, Voelker-Albert M, Graziano S, Forné I, Reveron-Gomez N, Schuh L, Hasenauer J, Marr C, Imhof A, 2020. Domain model explains propagation dynamics and stability of histone H3K27 and H3K36 methylation landscapes. Cell Rep 30: 1223–1234.e8. 10.1016/j.celrep.2019.12.060
- ↵Atanasoff-Kardjalieff AK, Studt L. 2022. Secondary metabolite gene regulation in mycotoxigenic Fusarium species: a focus on chromatin. Toxins (Basel) 14: 96. 10.3390/toxins14020096
- ↵Bachleitner S, Sulyok M, Sørensen JL, Strauss J, Studt L. 2021. The H4K20 methyltransferase Kmt5 is involved in secondary metabolism and stress response in phytopathogenic Fusarium species. Fungal Genet Biol 155: 103602. 10.1016/j.fgb.2021.103602
- ↵Berger SL. 2007. The complex language of chromatin regulation during transcription. Nature 447: 407–412. 10.1038/nature05915
- ↵Berr A, Shafiq S, Pinon V, Dong A, Shen WH. 2015. The trxG family histone methyltransferase SET DOMAIN GROUP 26 promotes flowering via a distinctive genetic pathway. Plant J 81: 316–328. 10.1111/tpj.12729
- ↵Bhattacharya S, Levy MJ, Zhang N, Li H, Florens L, Washburn MP, Workman JL. 2021. The methyltransferase SETD2 couples transcription and splicing by engaging mRNA processing factors through its SHI domain. Nat Commun 12: 1443. 10.1038/s41467-021-21663-w
- ↵Bicocca VT, Ormsby T, Adhvaryu KK, Honda S, Selker EU. 2018. ASH1-catalyzed h3k36 methylation drives gene repression and marks H3K27me2/3-competent chromatin. eLife 7: e41497. 10.7554/eLife.41497
- ↵Bolger AM, Lohse M, Usadel B. 2014. Trimmomatic: a flexible trimmer for Illumina sequence data. Bioinformatics 30: 2114–2120. 10.1093/bioinformatics/btu170
- ↵Brakhage AA. 2013. Regulation of fungal secondary metabolism. Nat Rev Microbiol 11: 21–32. 10.1038/nrmicro2916
- ↵Capella-Gutiérrez S, Silla-Martínez JM, Gabaldón T. 2009. TrimAl: a tool for automated alignment trimming in large-scale phylogenetic analyses. Bioinformatics 25: 1972–1973. 10.1093/bioinformatics/btp348
- ↵Carrozza MJ, Li B, Florens L, Suganuma T, Swanson SK, Lee KK, Shia W-J, Anderson S, Yates J, Washburn MP, 2005. Histone H3 methylation by Set2 directs deacetylation of coding regions by Rpd3S to suppress spurious intragenic transcription. Cell 123: 581–592. 10.1016/j.cell.2005.10.023
- ↵Cartagena JA, Matsunaga S, Seki M, Kurihara D, Yokoyama M, Shinozaki K, Fujimoto S, Azumi Y, Uchiyama S, Fukui K. 2008. The Arabidopsis SDG4 contributes to the regulation of pollen tube growth by methylation of histone H3 lysines 4 and 36 in mature pollen. Dev Biol 315: 355–368. 10.1016/j.ydbio.2007.12.016
- ↵Cazzonelli CI, Cuttriss AJ, Cossetto SB, Pye W, Crisp P, Whelan J, Finnegan EJ, Turnbull C, Pogson BJ. 2009. Regulation of carotenoid composition and shoot branching in Arabidopsis by a chromatin modifying histone methyltransferase, SDG8. Plant Cell 21: 39–53. 10.1105/tpc.108.063131
- ↵Chandrasekaran TT, Choudalakis M, Bröhm A, Weirich S, Kouroukli Alexandra G, Ammerpohl O, Rathert P, Bashtrykov P, Jeltsch A. 2024. SETDB1 activity is globally directed by H3K14 acetylation via its Triple Tudor Domain. Nucleic Acids Res 52: 13690–13705. 10.1093/nar/gkae1053
- ↵Chen Y, Kistler HC, Ma Z. 2019. Fusarium graminearum trichothecene mycotoxins: biosynthesis, regulation, and management. Annu Rev Phytopathol 57: 15–39. 10.1146/annurev-phyto-082718-100318
- ↵Collemare J, Seidl MF. 2019. Chromatin-dependent regulation of secondary metabolite biosynthesis in fungi: is the picture complete? FEMS Microbiol Rev 43: 591–607. 10.1093/femsre/fuz018
- ↵Connolly LR, Smith KM, Freitag M. 2013. The Fusarium graminearum histone H3K27 methyltransferase KMT6 regulates development and expression of secondary metabolite gene clusters. PLoS Genet 9: e1003916. 10.1371/journal.pgen.1003916
- ↵Dean R, Van KJ, Preorius Z, Hammond KK, Di PA, Spanu PD, Rudd JJ, Dickman M, Kahmann R, Ellis J, 2012. The Top 10 fungal pathogens in molecular plant pathology. Mol Plant Pathol 13: 414–430. 10.1111/j.1364-3703.2011.00783.x
- ↵DiFiore JV, Ptacek TS, Wang Y, Li B, Simon JM, Strahl BD. 2020. Unique and shared roles for histone H3K36 methylation states in transcription regulation functions. Cell Rep 31: 107751. 10.1016/j.celrep.2020.107751
- ↵Ding G, Shang L, Zhou W, Lu S, Zhou Z, Huang X, Li J. 2022. Phylogenomic and evolutionary analyses reveal diversifications of SET-domain proteins in fungi. J Fungi 8: 1159. 10.3390/jof8111159
- ↵Dronamraju R, Strahl BD. 2014. A feed forward circuit comprising Spt6, Ctk1 and PAF regulates Pol II CTD phosphorylation and transcription elongation. Nucleic Acids Res 42: 870–881. 10.1093/nar/gkt1003
- ↵Fang Y, Tang Y, Zhang Y, Pan Y, Jia J, Sun Z, Zeng W, Chen J, Yuan Y, Fang D. 2021. The H3K36me2 methyltransferase NSD1 modulates H3K27ac at active enhancers to safeguard gene expression. Nucleic Acids Res 49: 6281–6295. 10.1093/nar/gkab473
- ↵Flury V, Georgescu PR, Iesmantavicius V, Shimada Y, Kuzdere T, Braun S, Bühler M. 2017. The histone acetyltransferase Mst2 protects active chromatin from epigenetic silencing by acetylating the ubiquitin ligase Brl1. Mol Cell 67: 294–307.e9. 10.1016/j.molcel.2017.05.026
- ↵Frandsen RJ, Andersson JA, Kristensen MB, Giese H. 2008. Efficient four fragment cloning for the construction of vectors for targeted gene replacement in filamentous fungi. BMC Mol Biol 9: 70. 10.1186/1471-2199-9-70
- ↵Freitag M. 2017. Histone methylation by SET domain proteins in fungi. Annu Rev Microbiol 71: 413–439. 10.1146/annurev-micro-102215-095757
- ↵Gardner RG, Nelson ZW, Gottschling DE. 2005. Ubp10/Dot4p regulates the persistence of ubiquitinated histone H2B: distinct roles in telomeric silencing and general chromatin. Mol Cell Biol 25: 6123–6139. 10.1128/MCB.25.14.6123-6139.2005
- ↵Gu Q, Wang Z, Sun X, Ji T, Huang H, Yang Y, Zhang H, Tahir HAS, Wu L, Wu H, 2017. Fvset2 regulates fungal growth, pathogenicity, and secondary metabolism in Fusarium verticillioides. Fungal Genet Biol 107: 24–30. 10.1016/j.fgb.2017.07.007
- ↵Herz H-M, Garruss A, Shilatifard A. 2013. SET for life: biochemical activities and biological functions of SET domain-containing proteins. Trends Biochem Sci 38: 621–639. 10.1016/j.tibs.2013.09.004
- ↵Janevska S, Baumann L, Sieber CMK, Münsterkötter M, Ulrich J, Kämper J, Güldener U, Tudzynski B. 2018. Elucidation of the two H3K36me3 histone methyltransferases Set2 and Ash1 in Fusarium fujikuroi unravels their different chromosomal targets and a major impact of Ash1 on genome stability. Genetics 208: 153–171. 10.1534/genetics.117.1119
- ↵Jurkowska RZ, Qin S, Kungulovski G, Tempel W, Liu Y, Bashtrykov P, Stiefelmaier J, Jurkowski TP, Kudithipudi S, Weirich S, 2017. H3k14ac is linked to methylation of H3K9 by the Triple Tudor Domain of SETDB1. Nat Commun 8: 2057. 10.1038/s41467-017-02259-9
- ↵Katoh K, Standley DM. 2013. MAFFT multiple sequence alignment software version 7: improvements in performance and usability. Mol Biol Evol 30: 772–780. 10.1093/molbev/mst010
- ↵Keogh M-C, Kurdistani SK, Morris SA, Ahn SH, Podolny V, Collins SR, Schuldiner M, Chin K, Punna T, Thompson NJ, 2005. Cotranscriptional Set2 methylation of histone H3 lysine 36 recruits a repressive Rpd3 complex. Cell 123: 593–605. 10.1016/j.cell.2005.10.025
- ↵Kim JH, Lee BB, Oh YM, Zhu C, Steinmetz LM, Lee Y, Kim WK, Lee SB, Buratowski S, Kim T. 2016. Modulation of mRNA and lncRNA expression dynamics by the Set2–Rpd3S pathway. Nat Commun 7: 13534. 10.1038/ncomms13534
- Krogan NJ, Kim M, Tong A, Golshani A, Cagney G, Canadien V, Richards DP, Beattie BK, Emili A, Boone C, 2003. Methylation of histone H3 by Set2 in Saccharomyces cerevisiae is linked to transcriptional elongation by RNA polymerase II. Mol Cell Biol 23: 4207–4218. 10.1128/MCB.23.12.4207-4218.2003
- ↵Lam UTF, Tan BKY, Poh JJX, Chen ES. 2022. Structural and functional specificity of H3K36 methylation. Epigenetics Chromatin 15: 17. 10.1186/s13072-022-00446-7
- ↵Lee BB, Woo H, Lee MK, Youn S, Lee S, Roe J-S, Lee SY, Kim T. 2021. Core promoter activity contributes to chromatin-based regulation of internal cryptic promoters. Nucleic Acids Res 49: 8097–8109. 10.1093/nar/gkab639
- ↵Li H, Durbin R. 2009. Fast and accurate short read alignment with Burrows–Wheeler transform. Bioinformatics 25: 1754–1760. 10.1093/bioinformatics/btp324
- ↵Li H, Handsaker B, Wysoker A, Fennell T, Ruan J, Homer N, Marth G, Abecasis G, Durbin R, 1000 Genome Project Data Processing Subgroup. 2009. The Sequence Alignment/Map format and SAMtools. Bioinformatics 25: 2078–2079. 10.1093/bioinformatics/btp352
- ↵Li Z, Jiang D, Fu X, Luo X, Liu R, He Y. 2016. Coupling of histone methylation and RNA processing by the nuclear mRNA cap-binding complex. Nat Plants 2: 16015. 10.1038/NPLANTS.2016.15
- ↵Li Y, Brooks M, Yeoh-Wang J, McCoy RM, Rock TM, Pasquino A, Moon CI, Patrick RM, Tanurdzic M, Ruffel S, 2020. SDG8-mediated histone methylation and RNA processing function in the response to nitrate signaling. Plant Physiol 182: 215–227. 10.1104/pp.19.00682
- ↵Li Y, Steenwyk JL, Chang Y, Wang Y, James TY, Stajich JE, Spatafora JW, Groenewald M, Dunn CW, Hittinger CT, 2021. A genome-scale phylogeny of the kingdom Fungi. Curr Biol 31: 1653–1665.e5. 10.1016/j.cub.2021.01.074
- ↵Liao Y, Smyth GK, Shi W. 2014. featureCounts: an efficient general purpose program for assigning sequence reads to genomic features. Bioinformatics 30: 923–930. 10.1093/bioinformatics/btt656
- ↵Liu Y, Liu N, Yin Y, Chen Y, Jiang J, Ma Z. 2015. Histone H3K4 methylation regulates hyphal growth, secondary metabolism and multiple stress responses in Fusarium graminearum. Environ Microbiol 17: 4615–4630. 10.1111/1462-2920.12993
- ↵Lucio-Eterovic AK, Singh MM, Gardner JE, Veerappan CS, Rice JC, Carpenter PB. 2010. Role for the nuclear receptor-binding SET domain protein 1 (NSD1) methyltransferase in coordinating lysine 36 methylation at histone 3 with RNA polymerase II function. Proc Natl Acad Sci 107: 16952–16957. 10.1073/pnas.1002653107
- ↵Martin C, Zhang Y. 2005. The diverse functions of histone lysine methylation. Nature Reviews Molecular Cell Biology 6: 838–849. 10.1038/nrm1761
- ↵Mattei AL, Bailly N, Meissner A. 2022. DNA methylation: a historical perspective. Trends Genet 38: 676–707. 10.1016/j.tig.2022.03.010
- ↵McCauley BS, Sun L, Yu R, Lee M, Liu H, Leeman DS, Huang Y, Webb AE, Dang W. 2021. Altered chromatin states drive cryptic transcription in aging mammalian stem cells. Nat Aging 1: 684–697. 10.1038/s43587-021-00091-x
- ↵Meister G, Tuschl T. 2004. Mechanisms of gene silencing by double-stranded RNA. Nature 431: 343–349. 10.1038/nature02873
- ↵Möller M, Ridenour JB, Wright DF, Martin FA, Freitag M. 2023. H4K20me3 is important for Ash1-mediated H3K36me3 and transcriptional silencing in facultative heterochromatin in a fungal pathogen. PLoS Genet 19: e1010945. 10.1371/journal.pgen.1010945
- ↵Poon AFY, Price MN, Dehal PS, Arkin AP. 2010. FastTree 2 – approximately maximum-likelihood trees for large alignments. PLoS One 5: e9490. 10.1371/journal.pone.0009490
- ↵R Core Team. 2025. R: a language and environment for statistical computing. R Foundation for Statistical Computing, Vienna. https://www.R-project.org/.
- ↵Röther S, Sträßer K. 2007. The RNA polymerase II CTD kinase Ctk1 functions in translation elongation. Genes Dev 21: 1409–1421. 10.1101/gad.428407
- ↵Schmitges FW, Prusty AB, Faty M, Stützer A, Lingaraju GM, Aiwazian J, Sack R, Hess D, Li L, Zhou S, 2011. Histone methylation by PRC2 is inhibited by active chromatin marks. Mol Cell 42: 330–341. 10.1016/j.molcel.2011.03.025
- ↵Schotta G, Ebert A, Krauss V, Fischer A, Hoffmann J, Rea S, Jenuwein T, Dorn R, Reuter G. 2002. Central role of Drosophila SU(VAR)3-9 in histone H3-K9 methylation and heterochromatic gene silencing. EMBO J 21: 1121–1131. 10.1093/emboj/21.5.1121
- ↵Shang JY, He XJ. 2022. Chromatin-remodeling complexes: conserved and plant-specific subunits in Arabidopsis. J Integr Plant Biol 64: 499–515. 10.1111/jipb.13208
- ↵Shilatifard A. 2006. Chromatin modifications by methylation and ubiquitination: implications in the regulation of gene expression. Annu Rev Biochem 75: 243–269. 10.1146/annurev.biochem.75.103004.142422
- ↵Shirane K, Miura F, Ito T, Lorincz MC. 2020. NSD1-deposited h3k36me2 directs de novo methylation in the mouse male germline and counteracts polycomb-associated silencing. Nat Genet 52: 1088–1098. 10.1038/s41588-020-0689-z
- ↵Suzuki S, Kato H, Suzuki Y, Chikashige Y, Hiraoka Y, Kimura H, Nagao K, Obuse C, Takahata S, Murakami Y. 2016. Histone H3K36 trimethylation is essential for multiple silencing mechanisms in fission yeast. Nucleic Acids Res 44: 4147–4162. 10.1093/nar/gkw008
- ↵Tang G, Yuan J, Wang J, Zhang YZ, Xie SS, Wang H, Tao Z, Liu H, Kistler HC, Zhao Y, 2021. Fusarium BP1 is a reader of H3K27 methylation. Nucleic Acids Res 49: 10448–10464. 10.1093/nar/gkab844
- ↵Thorvaldsdóttir H, Robinson JT, Mesirov JP. 2013. Integrative Genomics Viewer (IGV): high-performance genomics data visualization and exploration. Brief Bioinform 14: 178–192. 10.1093/bib/bbs017
- ↵van Leeuwen F, Gafken PR, Gottschling DE. 2002. Dot1p modulates silencing in yeast by methylation of the nucleosome core. Cell 109: 745–756. 10.1016/S0092-8674(02)00759-6
- ↵Veerappan CS, Avramova Z, Moriyama EN. 2008. Evolution of SET-domain protein families in the unicellular and multicellular Ascomycota fungi. BMC Evol Biol 8: 190. 10.1186/1471-2148-8-190
- ↵Venkatesh S, Smolle M, Li H, Gogol MM, Saint M, Kumar S, Natarajan K, Workman JL. 2012. Set2 methylation of histone H3 lysine 36 suppresses histone exchange on transcribed genes. Nature 489: 452–455. 10.1038/nature11326
- ↵Wagner EJ, Carpenter PB. 2012. Understanding the language of Lys36 methylation at histone H3. Nat Rev Mol Cell Biol 13: 115–126. 10.1038/nrm3274
- ↵Xu M, Sun Z, Shi H, Yue J, Xiong X, Wu Z, Kou Y, Tao Z. 2023. Two H3K36 methyltransferases differentially associate with transcriptional activity and enrichment of facultative heterochromatin in rice blast fungus. aBIOTECH 5: 1–16. 10.1007/s42994-023-00127-3
- ↵Yang H, Howard M, Dean C. 2014. Antagonistic roles for H3K36me3 and H3K27me3 in the cold-induced epigenetic switch at Arabidopsis FLC. Curr Biol 24: 1793–1797. 10.1016/j.cub.2014.06.047
- ↵Youdell ML, Kizer KO, Kisseleva-Romanova E, Fuchs SM, Duro E, Strahl BD, Mellor J. 2008. Roles for Ctk1 and Spt6 in regulating the different methylation states of histone H3 lysine 36. Mol Cell Biol 28: 4915–4926. 10.1128/MCB.00001-08
- ↵Yu JH, Keller N. 2005. Regulation of secondary metabolism in filamentous fungi. Annu Rev Phytopathol 43: 437–458. 10.1146/annurev.phyto.43.040204.140214
- ↵Yun Y, Liu Z, Zhang J, Shim W-B, Chen Y, Ma Z. 2014. The MAPKK FgMkk1 of Fusarium graminearum regulates vegetative differentiation, multiple stress response, and virulence via the cell wall integrity and high-osmolarity glycerol signaling pathways. Environ Microbiol 16: 2023–2037. 10.1111/1462-2920.12334
- ↵Zhang L, Ma H. 2012. Complex evolutionary history and diverse domain organization of SET proteins suggest divergent regulatory interactions. New Phytologist 195: 248–263. 10.1111/j.1469-8137.2012.04143.x
- ↵Zhang Y, Liu T, Meyer CA, Eeckhoute J, Johnson DS, Bernstein BE, Nusbaum C, Myers RM, Brown M, Li W, 2008. Model-based Analysis of ChIP-Seq (MACS). Genome Biol 9: R137. 10.1186/gb-2008-9-9-r137
- ↵Zhang X, Yang Y, Wang L, Qin Y. 2024a. Histone H2B lysine 122 and lysine 130, as the putative targets of Penicillium oxalicum LaeA, play important roles in asexual development, expression of secondary metabolite gene clusters, and extracellular glycoside hydrolase synthesis. World J Microbiol Biotechnol 40: 179. 10.1007/s11274-024-03978-0
- ↵Zhang Y, Yu W, Lu Y, Wu Y, Ouyang Z, Tu Y, He B. 2024b. Epigenetic regulation of fungal secondary metabolism. Journal of Fungi 10: 648. 10.3390/jof10090648
- ↵Zhao T, Zhan Z, Jiang D. 2019. Histone modifications and their regulatory roles in plant development and environmental memory. J Genet Genomics 46: 467–476. 10.1016/j.jgg.2019.09.005
- ↵Zhu X, Wang B, Kan X, Chen C, Yu C. 2013. Evolution of plant Ash1 SET genes: structural divergence and functional differentiation. Genes Genomics 35: 463–473. 10.1007/s13258-013-0056-x
- ↵Zhuang Z, Pan X, Zhang M, Liu Y, Huang C, Li Y, Hao L, Wang S. 2022. Set2 family regulates mycotoxin metabolism and virulence via H3K36 methylation in pathogenic fungus Aspergillus flavus. Virulence 13: 1358–1378. 10.1080/21505594.2022.2101218