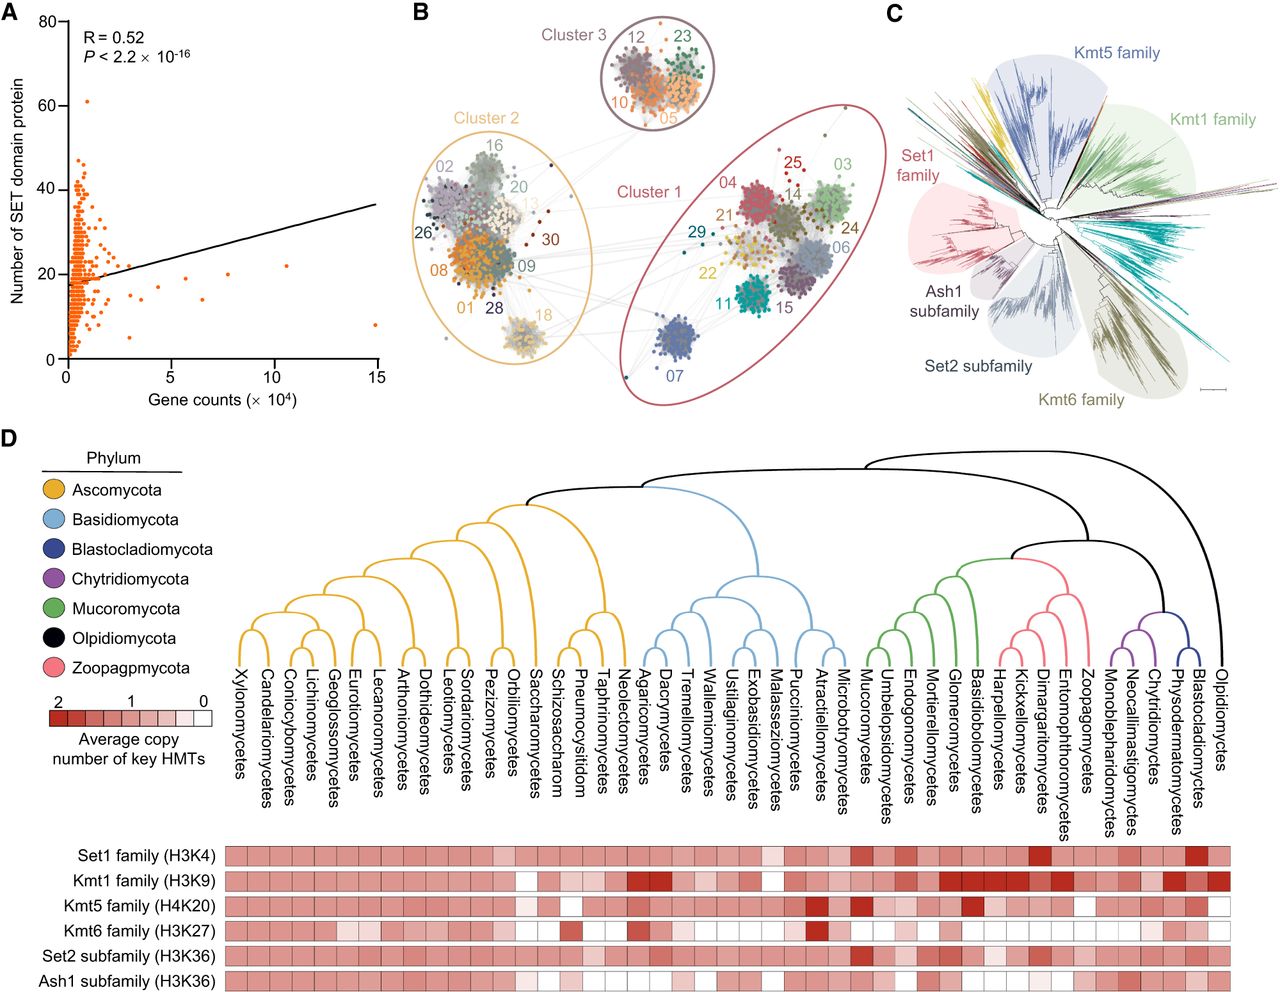
Figure 1.
Distribution and phylogeny of SET domain proteins across fungi kingdom. (A) Correlation between SET domain protein number and total gene count in fungal genomes. Pearson correlation coefficient: R = 0.52, P < 2.2 × 10⁻¹⁶. (B) Cluster analysis of 18,718 SET domain proteins from 1038 fungal species. Thirty groups within three clusters are shown by distinct colors and shapes. (C) Phylogenetic tree of cluster 1 SET domain proteins, highlighting histone methyltransferase (HMT) clades. Scale bar = 1. (D) Distribution of key HMT families (Set1, Kmt1, Kmt5, Kmt6) and subfamilies (Set2, Ash1) across seven fungal phyla. Average copy number per class is shown.