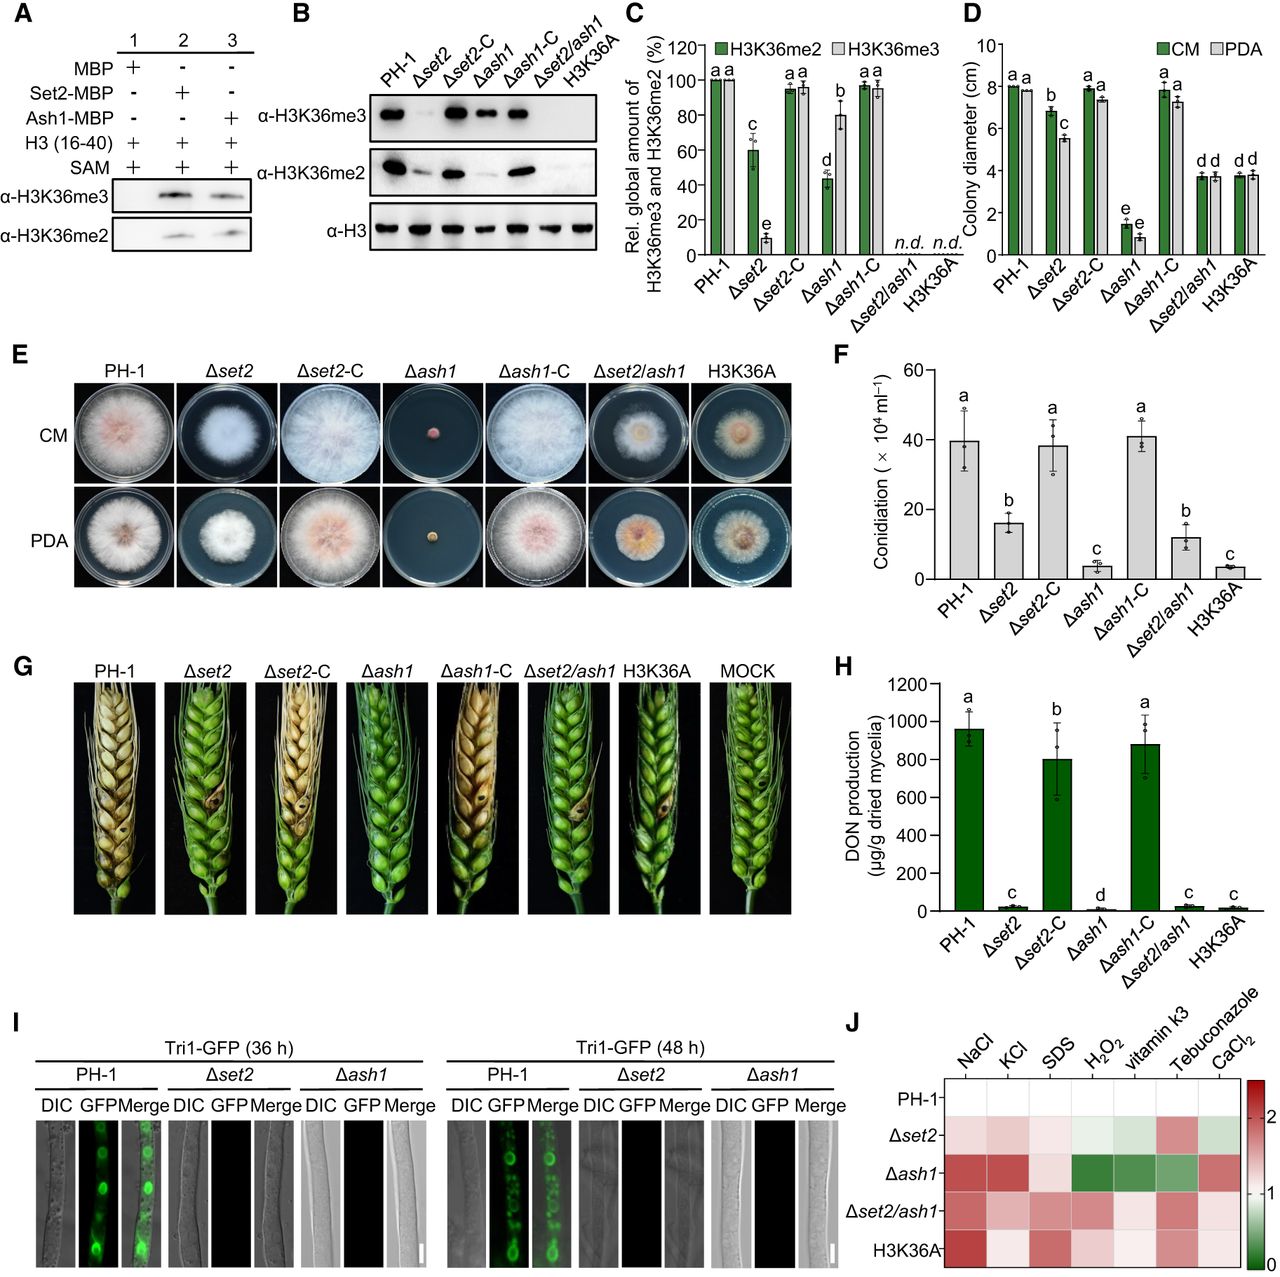
Set2 and Ash1 regulate development, virulence, and stress responses in F. graminearum. (A) Western blot analysis of Set2 and Ash1 in vitro HMT activity, probed with anti-H3K36me2 and anti-H3K36me3 antibodies. (B) H3K36me2 and H3K36me3 levels in PH-1, deletion mutants, and complemented strains. Anti-H3 served as a loading control. (C) Quantification of H3K36me2 and H3K36me3 signal intensities using ImageJ software. PH-1 intensity was set to 100%. (n.d.) not detectable. Different letters indicate significant differences among all groups shown. (D) Colony diameters of PH-1 and mutant strains after 3 days on PDA and CM. Different letters indicate statistically significant differences among all tested groups. Representative colony morphologies are shown in E. (F) Conidial production of strains grown in carboxymethyl cellulose (CMC) liquid medium for 5 days. Different letters indicate statistically significant differences among strains. (G) Virulence of PH-1 and mutants on wheat heads after point-inoculated with conidia, photographed at 15 dpi. (H) Deoxynivalenol (DON) production by PH-1 and mutants after 7 days in trichothecene biosynthesis-inducing (TBI) medium. Different letters indicate statistically significant differences among strains. (I) DON toxisome formation in PH-1, Δset2, and Δash1 visualized by Tri1-GFP after 36 or 48 h in TBI medium. Scale bar, 5 µm. (J) Heat map showing sensitivity of PH-1 and mutants to various abiotic stresses. Growth inhibition of PH-1 under each condition was normalized to 1.0. Data are mean ± standard deviation (n = 3). For panels C, D, F, and H, data are presented as mean ± standard deviation (s.d.) from three independent experiments. Statistical analysis was performed using ANOVA with Tukey's multiple comparisons test (P < 0.05).