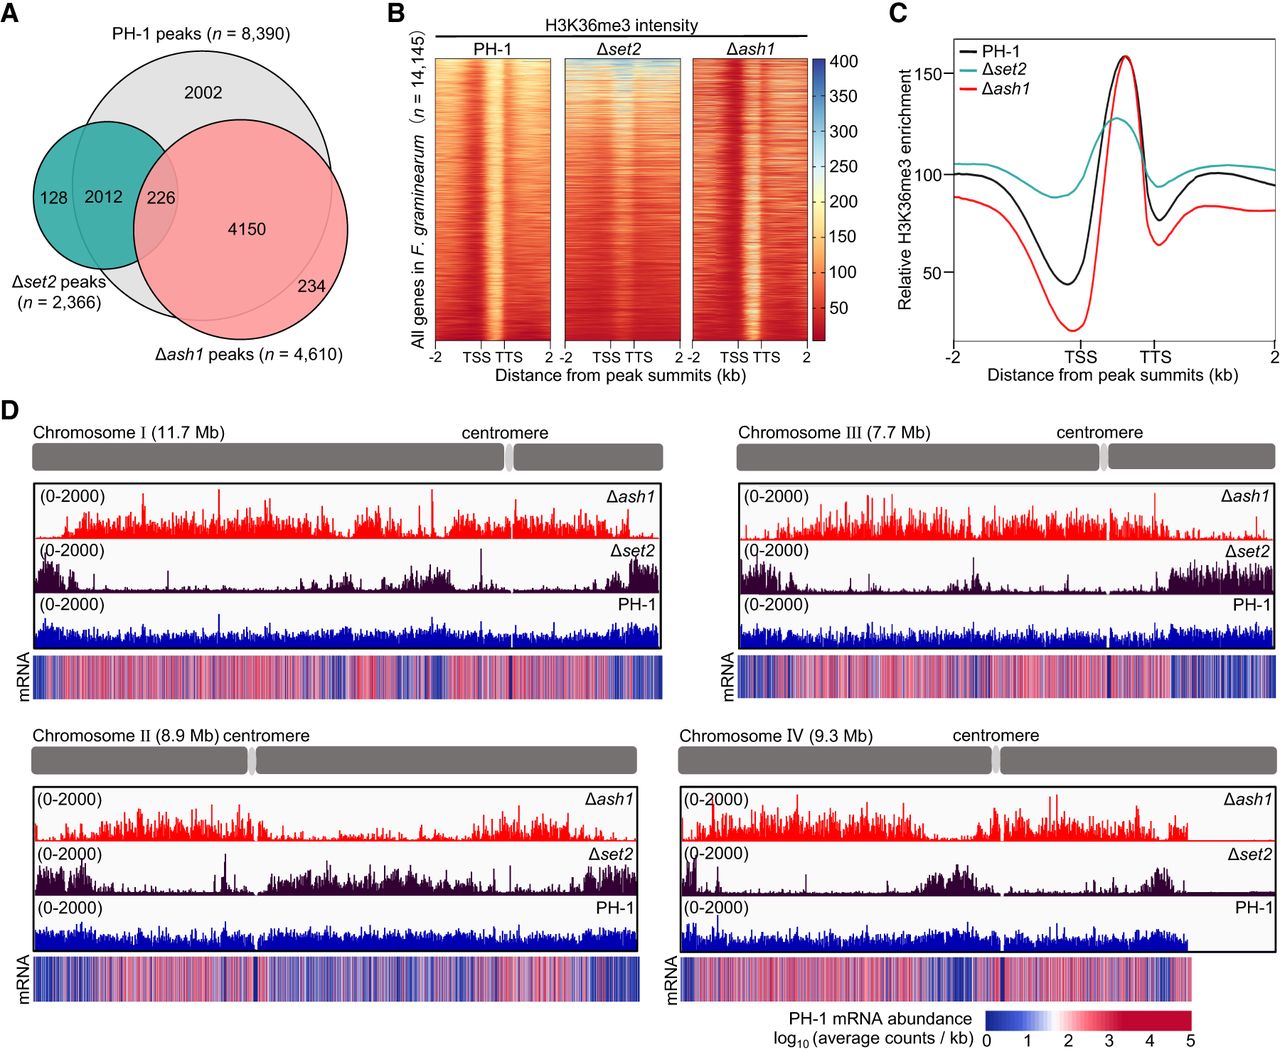
Figure 4.
Ash1 and Set2 deposit H3K36me3 in distinct genomic regions of F. graminearum. (A) Venn diagram of H3K36me3 peaks in PH-1, Δset2, and Δash1 strains. (B) Heat maps showing genome-wide H3K36me3 signal intensity across all genes within 2.0-kb genomic regions in PH-1, Δset2, and Δash1. TSS: Transcription start site; TTS: transcription termination site. (C) Metagene plots showing H3K36me3 distribution across target transcription units and adjacent intergenic regions in PH-1, Δset2, and Δash1. (D) Integrative Genomics Viewer (IGV) tracks of H3K36me3 ChIP-seq signals across four chromosomes in PH-1, Δset2, and Δash1. Y-axis: reads per million (RPM), normalized to total mapped reads. mRNA abundance profiles in PH-1 shown as reference.