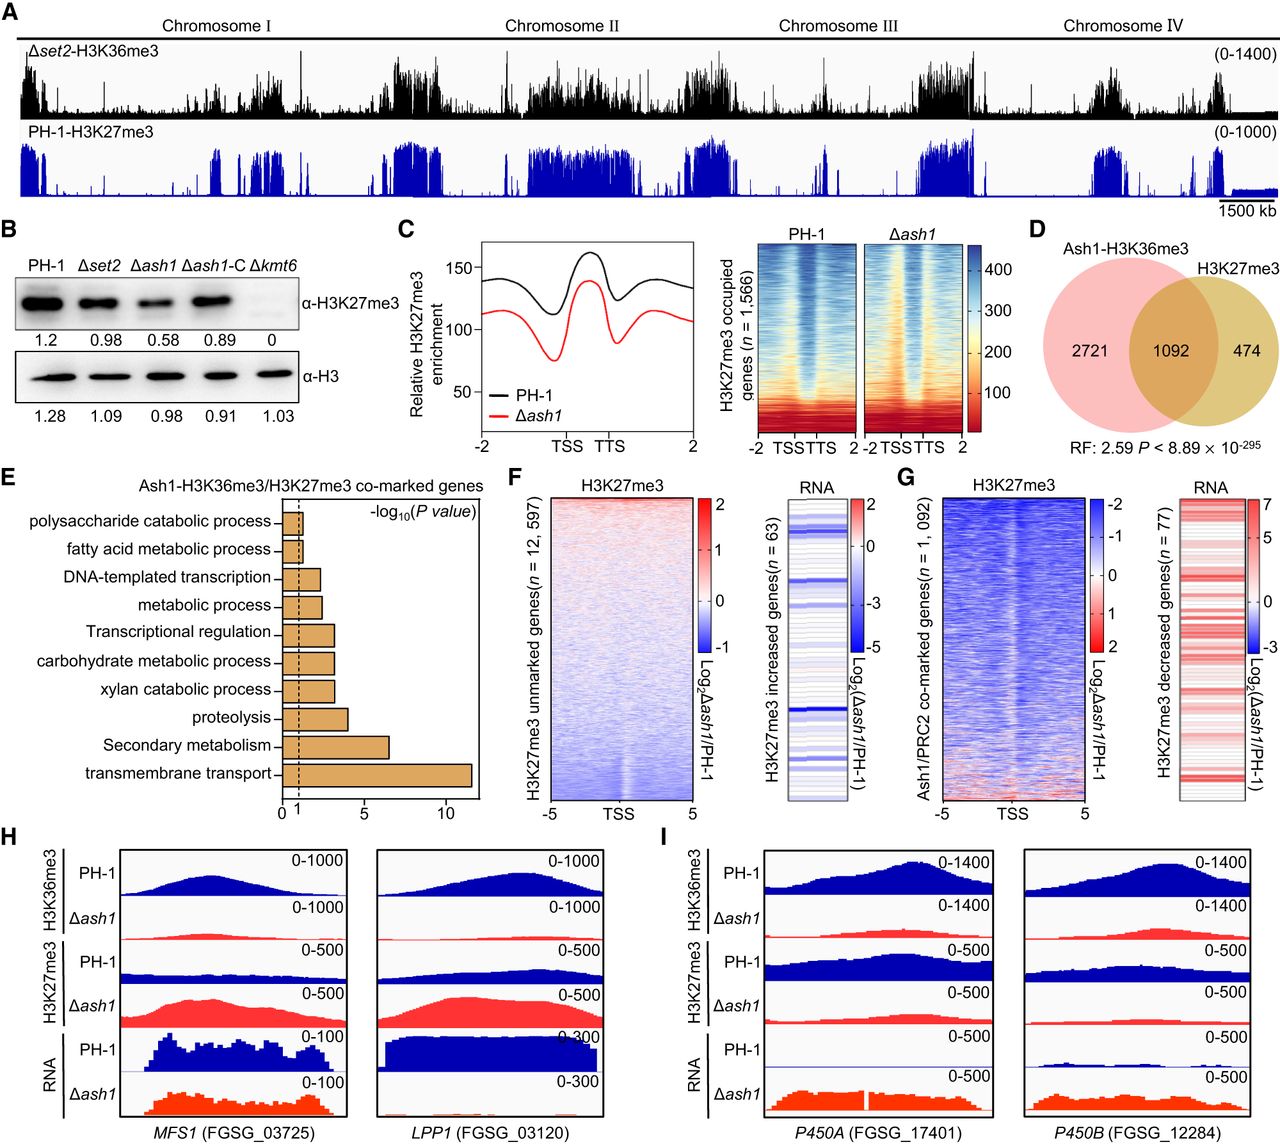
Ash1 modulates H3K27me3 deposition and target gene transcription. (A) IGV tracks of H3K36me3 in Δset2 and H3K27me3 in PH-1 across all four chromosomes. (B) Immunoblot analysis of H3K27me3 levels in PH-1 and deletion mutants. Relative intensities were quantified using ImageJ; anti-H3 as a loading control. (C) Metagene plots and heat maps of average H3K27me3 distribution in PH-1 and Δash1 around H3K27me3-marked genes (±2.0 kb). (D) Venn diagrams of overlap between H3K27me3-marked genes and Ash1-dependent H3K36me3-marked genes. (E) GO enrichment analysis of overlapping genes from D (n = 1092). (F,G) Heat maps of loci with increased (F) or decreased (G) H3K27me3 in Δash1, with corresponding transcript changes. (H,I) IGV tracks of H3K36me3/H3K27me3 and expression for MFS1, LPP1 (H), and P450A, P450B (I) in PH-1 and Δash1.