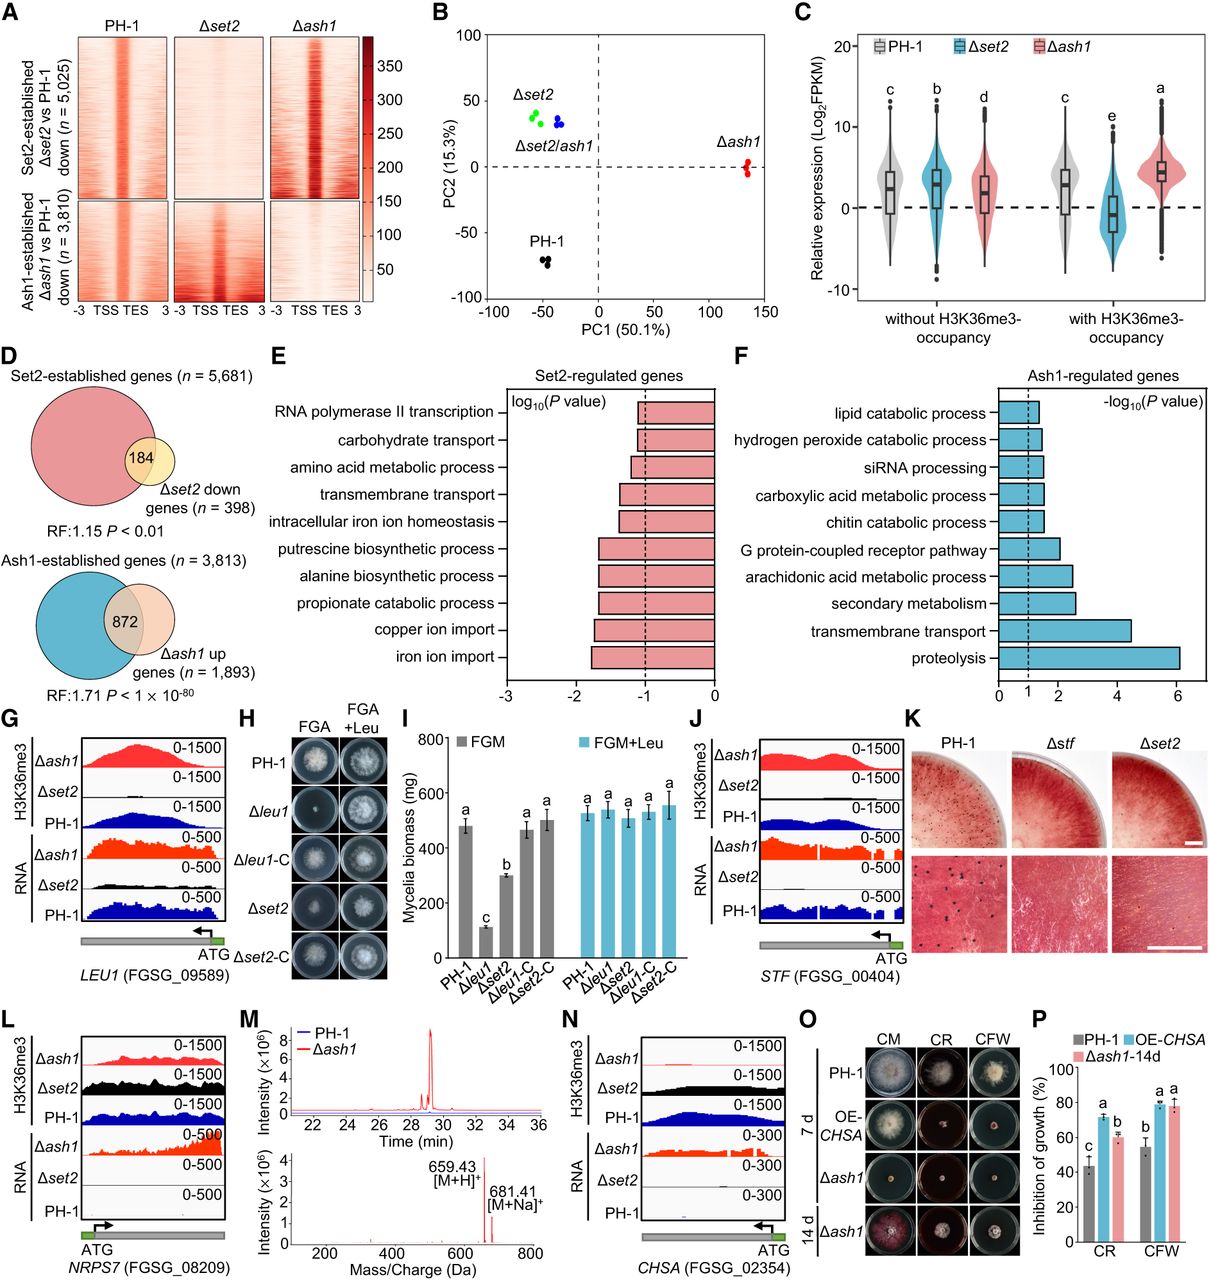
Distinct transcriptional roles of Set2 and Ash1 via H3K36me3 in F. graminearum. (A) Heat maps of Ash1- and Set2-dependent H3K36me3 peaks across all genes ±3.0 kb. (B) Principal component analysis (PCA) of transcriptomes for PH-1 and deletion mutants. (C) Violin plots of expression for genes with/without H3K36me3. Different letters indicate statistically significant differences among all groups shown. (D) Venn diagram: Δash1 upregulated versus Ash1 targets (top); Δset2 downregulated versus Set2 targets (bottom). RF: Representation factor. (E,F) Gene Ontology (GO) enrichment of overlapping sets in D. (G) IGV tracks of H3K36me3 and RNA expression of LEU1 in PH-1, Δset2, and Δash1. (H) Colony morphology of strains on FGA (fructose gelatin agar) medium with/without 0.3 mM leucine after 3 days. (I) Mycelial dry weight of strain of incubation in liquid FGM with/without 0.3 mM leucine after 3 days (25°C, 180 rpm). Different letters indicate statistically significant differences within each treatment condition. (J) IGV tracks of H3K36me3 and RNA expression of STF in PH-1, Δset2, and Δash1. (K) Perithecium formation in mating cultures at 14 days postfertilization. Scale bar, 0.5 cm. (L) IGV tracks of H3K36me3 and RNA expression of NRPS7 in PH-1, Δset2, and Δash1. (M) Ultraperformance liquid chromatography-mass spectrometry (UPLC-MS) ion chromatograms of fusaristatin A in PH-1 (blue) and Δash1 (red). Peaks: m/z 659.43 ([M+H]+) and 681.41 ([M+Na]+). (N) IGV tracks of H3K36me3 and RNA expression of CHSA in PH-1, Δset2, and Δash1. (O) Colony morphologies on CM with Congo red (CR, 0.2 g/L) or calcofluor white (CFW) (100 mg/L) at 3 days. (P) Inhibition rates under indicated stress conditions. Different letters indicate statistically significant differences within each treatment condition. Data in I and P represent the mean ± s.d. of three independent experiments. For panels C, I, and P, statistical significance (P < 0.05) was determined by ANOVA followed by Tukey's multiple comparisons test.