
FocalSV enables target region–based structural variant assembly and refinement using single-molecule long-read sequencing data
- 1Department of Biomedical Engineering, Vanderbilt University, Nashville, Tennessee 37235, USA;
- 2Department of Computer Science, Vanderbilt University, Nashville, Tennessee 37235, USA
-
↵3 These authors contributed equally to this work.
Abstract
Structural variants (SVs) play a critical role in shaping the diversity of the human genome, and their detection holds significant potential for advancing precision medicine. Despite notable progress in single-molecule long-read sequencing technologies, accurately identifying SV breakpoints and resolving their sequence remains a major challenge. Current alignment-based tools often struggle with precise breakpoint detection and sequence characterization, whereas whole-genome assembly-based methods are computationally demanding and less practical for targeted analyses. Neither approach is ideally suited for scenarios where regions of interest are predefined and require precise SV characterization. To address this gap, we introduce FocalSV, a targeted SV detection framework that integrates both assembly- and alignment-based signals. By combining the precision of local assemblies with the efficiency of region-specific analysis, FocalSV enables more accurate SV detection. FocalSV supports user-defined target regions and can automatically identify and expand regions with potential structural variants to enable more comprehensive detection. FocalSV is evaluated on 10 germline data sets and two paired normal-tumor cancer data sets, demonstrating superior performance in both precision and efficiency.
Single nucleotide variants (SNVs) constitute the most abundant form of genetic variation in humans and can be efficiently detected using short-read sequencing technologies. Therefore, genome-wide association studies (GWASs) have primarily focused on SNVs to investigate the genetic basis of phenotypic traits. In contrast, structural variants (SVs)—larger genomic alterations of 50 base pairs (bp) or more, including insertions (INS), deletions (DEL), duplications (DUP), inversions (INV), and translocations (TRA)—represent a major source of genetic diversity but are more challenging to detect accurately with short-read sequencing (Alkan et al. 2011). Despite their considerable biomedical relevance (Weischenfeldt et al. 2013), short-read-based approaches fail to identify over half of the SVs within an individual genome (Chaisson et al. 2019), constraining our ability to fully delineate the genetic landscape associated with complex disease phenotypes.
In recent years, long-read sequencing technologies have significantly advanced SV detection by providing extended read lengths, making it possible to resolve complex genomic regions that were previously challenging to analyze (Rhoads and Au 2015; Jain et al. 2016). Technologies such as Pacific Biosciences’ (PacBio's) HiFi and Continuous Long Reads (CLR) and Oxford Nanopore Technologies (ONT) offer distinct advantages. PacBio's HiFi reads, for instance, achieve accuracy of up to 99.9% with read lengths up to 20 kb, making them particularly well-suited for capturing SVs in complex genomic contexts (Wang et al. 2025). ONT, on the other hand, can generate even longer reads—exceeding 1 megabase in some cases—although with slightly lower accuracy. These long-read technologies allow for more accurate genomic alignment and improved assembly, significantly enhancing confidence in SV detection and enabling a more comprehensive view of the genomic landscape (Logsdon et al. 2020). However, despite these advantages, long-read technologies come with notable limitations. High-quality long reads remain costly and require substantial computational resources for processing, particularly when performing whole-genome assembly. These challenges present significant barriers in large-scale studies, where analyzing SVs across entire genomes for hundreds to thousands of samples is computationally intensive and time-consuming. Consequently, there is increasing demand for more efficient approaches that leverage long-read capabilities without the high computational cost of whole-genome assembly.
Alternative approaches, based on alignment-based methods, detect SVs by mapping long reads directly to a reference genome and identifying breakpoints based on alignment discrepancies. These methods are generally less computationally intensive and are well-suited for large-scale data sets. However, they face challenges in accurately identifying SV breakpoints and sequences compared to assembly-based methods (Liu et al. 2024). Limitations of existing whole-genome assembly-based and alignment-based methods make them suboptimal for scenarios requiring precise SV characterization in predefined genomic regions.
To address this gap, we introduce FocalSV, a target region assembly-based SV detection tool that combines the precision of assembly-based methods with the efficiency of a region-specific approach. The region-specific design of FocalSV is particularly valuable for clinical and genomic research, enabling users to focus on medically relevant SVs in specific loci or regions with SVs of interest. FocalSV enables both user-defined target analysis and automatic identification of SV-enriched regions, supporting more comprehensive and accurate structural variant detection. We benchmarked FocalSV against several state-of-the-art alignment-based and assembly-based tools, demonstrating overall superior accuracy and robustness across a wide variety of long-read data sets. FocalSV provides a practical and scalable alternative to whole-genome assembly, making it suitable for analyzing regions of interest in both individual samples and large-scale population studies.
Results
FocalSV is an efficient, region-aware tool for structural variant detection, offering two complementary modes—auto and target—to address diverse analytical goals (Figs. 1A,B, 2A–C). In target mode, users can specify regions of interest for focused SV detection. In auto mode, FocalSV autonomously detects and refines SV-rich regions by integrating population-level SV patterns with read-level signals from individual long-read data. To demonstrate the superior performance of FocalSV, we benchmarked both modes against four state-of-the-art assembly-based and five alignment-based SV detection tools across multiple long-read sequencing data sets. The assembly-based tools evaluated include FocalSV (v1.0.0), PAV (freeze2) (Ebert et al. 2021), SVIM-asm (v1.0.2) (Heller and Vingron 2021), Dipcall (v0.3) (Li et al. 2018), and sawfish (v1.0.1) (Saunders et al. 2025), whereas the alignment-based tools comprise cuteSV (v1.0.11) (Jiang et al. 2020), SVIM (v1.4.2) (Heller and Vingron 2019), pbsv (v2.6.2) (https://github.com/PacificBiosciences/pbsv), Sniffles2 (v2.0.6) (Smolka et al. 2024), and SKSV (v1.0.2) (Liu et al. 2021).
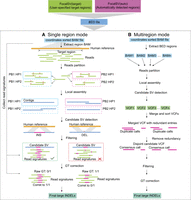
Schematic diagram of the FocalSV large indel detection pipeline. The workflow for large indel detection includes two modes: single region mode, and multiregion mode. (A) Single region mode: the input data include a high-quality reference genome and a BAM file containing aligned long reads. The reads extraction module isolates long reads aligned to the region of interest. The haplotyping module partitions these reads into distinct parental haplotypes. The local assembly module uses the phased reads to perform independent de novo local assemblies. Finally, the variant calling module identifies indel structural variants (SVs) by comparing the assembled contigs to the reference genome, followed by filtering and genotype (GT) correction in postprocessing steps. (B) Multiregion mode: the input data includes a high-quality reference genome and a BAM file containing aligned long reads. FocalSV retrieves region-specific BAM files and processes each region independently through reads partitioning, local assembly, and SV detection. The VCF files from all regions are merged into a single file, and redundant variants are removed using a clustering algorithm. SV filtering and genotype refinement are then applied to produce the final VCF file.
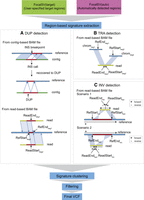
Schematic diagram of duplication, translocation, and inversion breakpoint signatures detected by FocalSV. (A) Duplication: duplications can be identified using both contig-based and read-based BAM files. In a contig-based BAM file, a duplication is detected when an insertion call shows the alternate allele mapped to the surrounding sequence of the insertion breakpoint. In a read-based BAM file, a duplication signature is identified when two adjacent segments of a read align to overlapping regions on the reference genome in the same orientation. (B) Translocation: translocations are inferred when two adjacent segments of a read align to different chromosomes. (C) Inversion: inversions are detected when two adjacent segments of a read align in opposite orientations. Additional details on detecting duplications, translocations, and inversions can be found in the Methods section.
The data sets include nine libraries derived from the well-characterized HG002 sample, sequenced with PacBio HiFi, CLR, and ONT technologies; one HiFi library from the Han Chinese male sample HG005; and two paired tumor-normal data sets (CLR and ONT) from the HCC1395 breast cancer cell line. Specifically, the HG002 datasets encompass three HiFi libraries (Hifi_L1, Hifi_L2, and Hifi_L3) with coverages ranging from 30× to 56×, three CLR libraries (CLR_L1, CLR_L2, and CLR_L3) with coverages between 29× and 89×, and three ONT libraries (ONT_L1, ONT_L2, and ONT_L3) with coverages between 47× and 57×. Further details on the tools and data sets are provided in Table 1.
Resource for different tools and long-read data sets
We assessed the performance of all tools based on key metrics, including breakpoint identification and SV sequence accuracy. As illustrated in Figures 1, A and B and 2, A through C, FocalSV's pipeline leverages region-based strategy to collect diverse SV signatures, enabling precise detection. A rigorous filtering process ensures that the final SV call sets are both comprehensive and accurate, highlighting FocalSV's ability to capture a wide spectrum of structural variants. The complete methodology and implementation details are described in the Methods section.
Evaluation of SV calls in FocalSV and comparisons with existing SV callers
To assess the performance of insertion and deletion SV detection, we evaluated five assembly-based tools (FocalSV, PAV, SVIM-asm, Dipcall, and sawfish) and five alignment-based tools (cuteSV, SVIM, pbsv, Sniffles2, and SKSV) using nine long-read sequencing libraries of the HG002 sample. For FocalSV, we evaluated two operational modes: FocalSV(target), which uses predefined regions, and FocalSV(auto), which automatically identifies and expands regions with potential SVs. SV calls were benchmarked against the Genome in a Bottle (GIAB) SV gold standard (Zook et al. 2014) using Truvari (v4.0.0) (English et al. 2022), a widely adopted structural variant evaluation tool. Truvari compares SV calls from any tool's call set against a gold standard call set, both provided in Variant Call Format (VCF) files, by analyzing key metrics: reference distance, reciprocal overlap, size similarity, and sequence similarity.
In this study, we applied a moderate-tolerance parameter set in Truvari for SV comparisons, with the following settings: p = 0.5, P = 0.5, r = 500, and O = 0.01. Specifically, the parameter p (pctstim), which ranges from 0 to 1.0, controls the minimum required sequence similarity for two SVs to be considered identical. P (pctsize), also ranging from 0 to 1.0, defines the minimum allowable allele size similarity. O (pctovl), ranging from 0 to 1.0, establishes the minimum reciprocal overlap ratio, a key measure for comparing deletions and evaluating their breakpoint alignment. Lastly, r (refdist), which can range from 0 to 1000 bp, sets the maximum allowable difference between the reference positions of two SVs, helping assess breakpoint shifts in insertion events.
We first evaluated the average performance across different PacBio Hifi, CLR, and ONT data sets (Tables 2–4). In the HiFi data sets (Table 2), FocalSV(target) demonstrated the third-highest average F1 score for deletions (93.99%) and the highest for insertions (91.93%). FocalSV(auto) attained the highest average F1 score for deletions (94.29%) and the second-highest for insertions (91.03%). In the CLR data sets (Table 3), FocalSV(target) outperformed the other tools with the highest average F1 scores for deletions (92.95%) and insertions (90.71%). FocalSV(auto) ranked second, with comparable performance for deletions (92.92%) and slightly lower performance for insertions (89.16%). In the ONT data sets (Table 4), FocalSV(target) achieved the highest average F1 score for deletions (92.94%), and ranked third for insertions (89.69%). FocalSV(auto) ranked second in average F1 score for deletions (92.50%), and achieved the highest F1 score for insertions (90.01%). These results highlight the robustness of both FocalSV modes across different sequencing platforms, with either FocalSV(target) or FocalSV(auto) consistently ranking first or second in average F1 scores for deletions and insertions across nearly all data sets. In terms of overall genotyping accuracy, cuteSV and FocalSV consistently performed best, with accuracies frequently in the 98%–99% range.
Large deletions (DELs) and insertions (INSs) (≥50 bp) calling performance across three HiFi data sets
Large deletions and insertions (≥50 bp) calling performance across three CLR data sets
Large deletions and insertions (≥50 bp) calling performance across three ONT data sets
When examining each data set individually (Tables 2–4; Supplemental Tables S1–S3), FocalSV outperformed all other tools, achieving the highest F1 scores for both deletions and insertions across all HiFi, CLR, and ONT libraries. In the context of three HiFi data sets (Table 2; Supplemental Table S1), FocalSV emerged as the top overall performer. For deletions, FocalSV(auto) outperformed all other tools on Hifi_L2 and Hifi_L3, exceeding the F1 score of the second-best tool, sawfish, by an average of 0.12%. On Hifi_L1, FocalSV(target) achieved the highest performance, closely followed by sawfish and FocalSV(auto). For insertions, both FocalSV(target) and FocalSV(auto) consistently outperformed all other tools across all three libraries, with FocalSV(target) achieving F1 score that surpassed the next-best tools by an average of 1.80%.
In the three CLR data sets (Table 3; Supplemental Table S2), FocalSV emerged as the top-performing tool in terms of F1 score and recall across nearly all libraries, demonstrating clear advantages. For deletions, FocalSV(auto) outperformed the second-ranked tools in F1 score on CLR_L2 and CLR_L3 by an average of 0.39%. On CLR_L1, FocalSV(target) exhibited the highest F1 score, closely followed by pbsv and FocalSV(auto). For deletion recall, FocalSV(target) ranked first, outperforming the second-ranked tools across all three libraries by an average of 1.48%. For insertions, both FocalSV(target) and FocalSV(auto) excelled across all libraries, with FocalSV(target) achieving an average F1 score 3.45% higher than the second-ranked tools. For insertion recall, FocalSV(target) exceeded the second-ranked tools on CLR_L1 and CLR_L2 by an average of 0.93%. On CLR_L3, FocalSV(auto) exhibited the second-highest recall, trailing the top by 0.23%.
In the three ONT data sets (Table 4; Supplemental Table S4), both FocalSV(target) and FocalSV(auto) maintained substantial leads. FocalSV(target) outperformed the second-ranked tool across ONT_L1, ONT_L2, and ONT_L3 by an average of 0.58% in deletion F1 score. For deletion recall, FocalSV(target) outperformed the second-ranked tools on ONT_L1 and ONT_L2 by an average of 0.58%. On ONT_L3, FocalSV(target) achieved the second-highest recall, trailing the top by 0.10%. For insertion F1, FocalSV(auto) achieved the highest F1 scores on ONT_L1, ONT_L2, and ONT_L3, outperforming the second-ranked tool, cuteSV, by an average of 0.30%. In terms of insertion recall, FocalSV(target) outperformed the second-ranked tool on ONT_L2 and ONT_L3 by an average of 0.51%. On ONT_L1, FocalSV(target) achieved the second-highest recall, trailing the top recall by 0.49%.
For these benchmarks, FocalSV(target) used regions of interest defined by SVs identified by GIAB. To avoid biased evaluation, we also measured false positive (FP) counts within regions lacking known SVs. Recognizing that some tools may report fewer SVs—leading to lower recall but artificially high precision—we further normalized FP counts by penalizing them according to each tool's average F1 score (https://www.researchgate.net/publication/268185911_The_truth_of_the_F-measure; Powers 2011; Christen et al. 2023), using the formula: normalized FP count = raw FP count × (1 − F1). To evaluate performance in SV-negative regions, we randomly selected 1000 regions without known SVs using the GIAB gold standard. All tools produced very few false positives. FocalSV(target) achieved the lowest FP counts across both raw (CLR_L1: 5; ONT_L1: 3) and normalized values (CLR_L1: 0.4; ONT_L1: 0.26). For HiFi data, it showed the second-lowest raw (Hifi_L1: 6) and lowest normalized FP value (Hifi_L1: 0.4) (Supplemental Fig. S1). These results demonstrate FocalSV(target)’s consistently high precision across both SV-rich and SV-negative regions.
In summary, FocalSV consistently outperformed other tools across nine HG002 data sets (HiFi, CLR, and ONT) based on average F1 scores and library-specific performance, demonstrating strong detection capabilities for both deletions and insertions. Although it occasionally ranked second or third in recall or precision, these variations were minor and did not diminish its overall effectiveness. In terms of genotyping accuracy, FocalSV consistently ranked first or second, with accuracy rates frequently reaching 98%–99%. These results highlight FocalSV as a reliable and high-performing tool for structural variant detection.
FocalSV demonstrates excellent resilience to different SV size ranges
So far, we evaluated SVs by averaging across all size ranges. However, we found that the tools we assessed showed varying levels of accuracy in detecting SVs of different sizes. To demonstrate the effect of SV size and compare the resilience of each tool, we plotted the F1 score against the range of SV sizes (Fig. 3; Supplemental Fig. S2). We utilized the same modest tolerance parameters in Truvari for benchmarking. FocalSV(auto) and FocalSV(target), along with all other tools, are visualized in Figure 3 and Supplemental Figure S2, respectively. Both modes of FocalSV exhibited comparable performance across all variant size ranges and libraries.
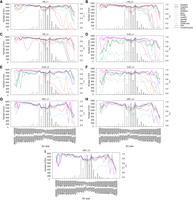
F1 accuracy of SV detection across various size ranges on nine long-read data sets. (A–C) F1 accuracy plot for three HiFi data sets. Negative ranges denote deletions and the positive ranges denote insertions. The bar plot illustrates the benchmark SV distribution across these size ranges. The line plot displays the F1 scores for four distinct detection methods. Dashed lines indicate alignment-based, whereas solid lines represent assembly-based methods. (D–F) F1 accuracy plot for three CLR data sets. (G–I) F1 accuracy plot for three ONT data sets.
Overall, assembly-based tools such as FocalSV(auto), FocalSV(target), PAV, SVIM-asm, Dipcall, and sawfish showed better resilience than alignment tools such as SKSV, Sniffles2, pbsv, SVIM, and cuteSV when processing HiFi data (Fig. 3A–C; Supplemental Fig. S2A–C). Most alignment-based tools had a significant drop in performance with large INSs in the range of 2 kb–50 kb, whereas most assembly-based tools typically encountered performance challenges only with large INSs in the range of 9 kb–50 kb. Among all assembly-based tools, FocalSV, in both modes, continued to distinguish itself with exceptional performance across nearly all size ranges, except for 8 kb- to 10 kb-deletions and 10 kb- to 50 kb-insertions.
On CLR data (Fig. 3D–F; Supplemental Fig. S2D–F), assembly-based tools except Dipcall still outperformed alignment-based tools in terms of resilience, especially for INSs. Across all size ranges, FocalSV, in both modes, maintained a top-tier performance. Notably, FocalSV's performance is much better than other tools on CLR_L3, where it had the highest F1 score across all size ranges except for INSs in the range of 9 kb–10 kb and showed the least fluctuation.
On ONT data (Fig. 3G–I; Supplemental Fig. S2G–I), the difference between alignment-based and assembly-based tools was less pronounced. Two alignment-based tools, cuteSV and Sniffles2, demonstrated resilience comparable to assembly-based tools. FocalSV, in both modes, emerged as a top-performing tool for small- to large-sized deletions (50 bp–8 kb) and insertions (50 bp–2 kb). For large deletions (8 kb–50 kb) and insertions (2 kb–50 kb), FocalSV, in both modes, remained within the range of the best tools.
FocalSV achieves robust SV detection across evaluation parameters
While assessing different SV callers against a gold standard, we recognized the potential impact of breakpoint shifts and sequence similarity issues on the evaluation. This acknowledgment arises from the fact that SVs often span substantial genomic regions. In previous evaluations, we selected a set of moderate-tolerance but fixed parameters to demonstrate the overall performance for each tool. However, the choice of parameters such as breakpoint shift tolerance and sequence similarity, for identifying a call as a true positive, varies subjectively. Therefore, to comprehensively evaluate the effectiveness and stability of SV callers, we adjusted key evaluation parameters (p, P, r, and O) using Truvari for benchmarking (English et al. 2022). Specifically, we systematically evaluated the impact of four key parameters by conducting two complementary experiments: (1) a univariate sensitivity analysis, where each parameter was varied individually to assess its effect on F1 scores while holding others constant; and (2) a grid-based benchmarking experiment, in which all pairwise parameter combinations were explored to evaluate tool performance across the full parameter space. Parameters p, P, and O were adjusted in increments of 0.1 from 0 to 1, and r was adjusted in 100-bp increments from 0 to 1000 bp. Our goal was to examine how different levels of stringency or leniency in these parameters might impact SV detection across the nine data sets. We expected FocalSV to demonstrate relatively consistent and stable performance, even under more stringent conditions.
We first systematically varied each parameter and plotted curves to illustrate the changes in F1 scores across all libraries. When varying one parameter, the remaining parameters were held at their default moderate values. For deletion and insertion detection on Hifi_L1 (Fig. 4A,B), increasing the stringency of the matching threshold by reducing r from 1000 bp to 0 bp led to a consistent decline in F1 scores for all tools, with insertions showing greater sensitivity to r than deletions. When varying O, P, or p from 0 to 1.0—corresponding to increasing stringency (Fig. 4C–H)—F1 scores of all tools decreased. Notably, for P and p, F1 scores for both deletions and insertions dropped sharply when the thresholds exceeded 0.8. Changes in O had an even stronger impact: both deletions and insertions exhibited a substantial decline in F1 performance when O increased, with insertions again being more sensitive than deletions. Across all parameter settings, FocalSV, in both modes, consistently achieved the highest F1 scores. Similar trends were observed across other libraries, with FocalSV maintaining top performance in nearly all scenarios (Supplemental Figs. S3–S10).
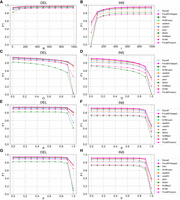
F1 accuracy by changing four different evaluation parameters on Hifi_L2. (A,B) F1 score curves for deletions (DEL) and insertions (INS) across all tools as r is varied. r is the maximum reference location distance between SV call and gold standard SV. r varies from 0 to 1000 bp with a 100-bp interval. (C,D) F1 score curves for deletions and insertions across all tools as O is varied. O is the minimum reciprocal overlap between SV call and gold standard SV. (E,F) F1 score curves for deletions and insertions across all tools as P is varied. P is the minimum allowable allele size similarity between SV call and gold standard SV. (G,H) F1 score curves for deletions and insertions across all tools as p is varied. p is the minimum percentage of allele sequence similarity between SV call and gold standard SV. O, P, and p vary from 0 to 1 with a 0.1 interval.
We next varied each parameter pair and plotted F1 heat maps to illustrate performance changes across all libraries. For deletion calls on Hifi_L1, the F1 heat maps for FocalSV(auto) and FocalSV(target) are shown in Figure 5, A through I and Supplemental Figure S11, respectively. Both modes demonstrated comparable performance across all libraries under varying evaluation parameters. Based on the comprehensive benchmarking study by Liu et al. (2024), which thoroughly examined the impact of various parameter combinations, such as p-O, P-r, O-r, p-P, p-r, and P-O, on deletion evaluation, we selected p and O as the representative parameter pair, as they had the most substantial influence on deletion performance. As shown in Figure 5,A through I and Supplemental Figure S11, increasing the values of p and O imposed stricter correspondence requirements between the SV call and the gold standard, leading to a decline in F1 scores. The heat map and gradient analysis of Liu et al. (2024) demonstrated distinct performance patterns among tools as more stringent thresholds were applied. They showed that all read alignment-based SV callers, except for pbsv, exhibited significant performance drops when p or O exceeded 0.7, with F1 scores falling below 5% when either parameter reached 1.0. In contrast, FocalSV, in both modes, and other assembly-based SV callers from the study of Liu et al. (2024), namely Dipcall, SVIM-asm, and PAV, along with pbsv, maintained stable performance across the parameter grid. Even under the strictest conditions (p = 1.0, O = 1.0), these tools achieved F1 scores >69%. Notably, under this strict exact-match criterion in terms of sequence similarity and reciprocal overlap ratio, FocalSV, in both modes, excelled with an exceptional F1 score above 74% (Fig. 5A; Supplemental Fig. S11A), outperforming other stable tools and demonstrating its robustness. Across nearly all parameter settings, FocalSV consistently achieved higher F1 scores compared to Dipcall, SVIM-asm, PAV, pbsv, and sawfish (Supplemental Figs. S12–S15A), demonstrating superior performance across the grid. The overall performance trends for these tools were consistent with those previously reported by Liu et al. (2024) (Supplemental Figs. S12–S20A).
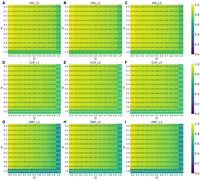
Deletion F1 accuracy of FocalSV(auto) by tuning different evaluation parameters (p and O). O is the minimum reciprocal overlap between SV call and gold standard SV. p is the minimum percentage of allele sequence similarity between SV call and gold standard SV. O and p vary from 0 to 1 with a 0.1 interval. (A–C) The F1 heat map for deletions by FocalSV(auto) on three HiFi data sets. Every cell in the heat map represents the F1 score under a specific pair of p and O evaluation. (D–F) The F1 heat map for deletions by FocalSV(auto) on three CLR data sets. (G–I) The F1 heat map for deletions by FocalSV(auto) on three ONT data sets.
For insertion evaluations on Hifi_L1 (Fig. 6A; Supplemental Figs. S21–S30A), the pair p and r were similarly selected as the most representative parameters based on the findings of Liu et al. (2024). Their study revealed that insertion detection was generally more sensitive to parameter variations compared to deletions. Combining their results and our experiment, we found that most tools, including FocalSV, experienced a decline in F1 scores when p exceeded 0.8 (i.e., when the required allele sequence similarity between the called SV and the benchmark exceeded 80%) (Fig. 6A; Supplemental Figs. S21–S30A). Additionally, F1 scores decreased when r was reduced. Once r dropped to 200 bp or less, indicating a more stringent reference distance threshold, performance deteriorated significantly across all tools. Similar to the trends observed for deletions, FocalSV, other assembly-based tools, and pbsv displayed greater robustness to stringent parameters compared to read alignment-based tools. Among all robust performing tools, FocalSV, in both modes, consistently achieved higher F1 scores than Dipcall, SVIM-asm, PAV, and pbsv, showing outstanding performance over the grid (Fig. 6A; Supplemental Figs. S21–S25A). We have also observed similar patterns on grid searches for FocalSV on other libraries (Figs. 5B–I, 6B–I: Supplemental Figs. S12–S30).
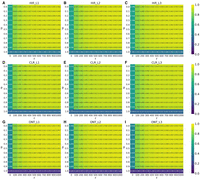
Insertion F1 accuracy of FocalSV(auto) by tuning different evaluation parameters (p and r). r is the maximum reference location distance between SV call and gold standard SV. p is the minimum percentage of allele sequence similarity between SV call and gold standard SV. p vary from 0 to 1 with a 0.1 interval. r varies from 0 to 1000 bp with a 100 bp interval. (A–C) The F1 heat map for insertions by FocalSV(auto) on three HiFi data sets. Every cell in the heat map represents the F1 score under a specific pair of p and r evaluation. (D–F) The F1 heat map for insertions by FocalSV(auto) on three CLR data sets. (G–I) The F1 heat map for insertions by FocalSV(auto) on three ONT data sets.
The robustness of assembly-based tools to evaluation parameters may indicate their capacity to accurately detect SV breakpoints and alternative allele sequences, as highlighted by Liu et al. (2024). To address this, we analyzed the distribution of SV breakpoint shift and alternate allele sequence similarity for FocalSV. Breakpoint shifts were defined as the maximum reference location difference between two compared SV calls, calculated as the greatest start/end location difference between true positive SVs and their corresponding benchmark SVs. Sequence similarity was quantified using the edit distance between compared SV calls, directly extracted from Truvari. Our results revealed that FocalSV achieved a near-zero breakpoint shift and near 100% SV sequence similarity with the benchmark callset (Supplemental Figs. S31–S34). In line with previous findings, our results confirm that FocalSV, like other assembly-based tools, demonstrates strong resilience across various parameter settings, underscoring its capacity to accurately capture both SV breakpoints and alternative alleles. Notably, FocalSV consistently outperformed other assembly-based tools, including Dipcall, SVIM-asm, and PAV, across all parameter configurations, further emphasizing its superior accuracy and reliability.
FocalSV exhibits reliable SV detection on HG005, validated by multitool consensus benchmarking
To further assess the robustness and generalizability of FocalSV, we extended our evaluation to the Chinese male sample HG005. As the GIAB consortium has not provided a gold standard SV callset for this sample, we developed a consensus-based evaluation framework leveraging agreement across multiple established SV callers. We first applied all benchmarked tools to the HG005 HiFi data set (Table 1) and collected their respective callsets based on the GRCh38 reference genome. From each, we extracted indel SVs (≥50 bp) marked as “PASS” in the VCF filter field and located within the high-confidence regions defined by GIAB. Although originally curated for HG002, this BED file encompasses regions with consistent support across sequencing platforms and excludes problematic areas such as segmental duplications and low-mappability areas. Given its stringent design, we applied it to HG005 to enable fair and broadly comparable evaluations. Following filtering, we merged and sorted the resulting VCF files, then applied distance-based clustering to group SVs of the same type within a 500-bp window. These clusters served as proxy gold standard sets for HG005, with each cluster annotated by the number of supporting tools. By adjusting the minimum support threshold, we generated benchmark sets at varying confidence levels. SV callers were evaluated by comparing their predictions to these clusters: a call was considered a true positive if it overlapped a benchmark cluster and matched the majority genotype. SVs without matching clusters were treated as false positives. We computed recall, precision, and F1 scores across multiple confidence thresholds to quantify performance.
Overall, FocalSV(auto) demonstrated the leading performance in deletion detection across a wide range of confidence thresholds. As shown in Supplemental Figure S35, FocalSV consistently achieved the highest F1 scores when the minimum number of supporting tools ranged from two to seven. For instance, at the stringent threshold of seven supporting tools, FocalSV reached an F1 score of 97.66% (Supplemental Table S4), outperforming the second-best tool, Sniffles2, by 0.19%. At thresholds above seven, cuteSV ranked highest, with FocalSV following closely in second place. The number of benchmark deletions ranged from 3985 to 4710 (Supplemental Fig. S35D; Supplemental Table S4), closely matching the 4116 Tier 1 deletions reported for HG002 in the high-confidence BED file. This consistency supports the reliability of our filtering and evaluation framework.
For insertion calls, FocalSV maintained strong performance, ranking first or second in F1 score across most confidence thresholds. As shown in Supplemental Figure S36 and Supplemental Table S5, FocalSV achieved the highest F1 scores when the number of supporting tools was two or three. At thresholds between four and eight, FocalSV consistently ranked second, closely following PAV, with an average F1 difference of 0.3%. When the threshold increased to nine supporting tools, FocalSV ranked third, trailing the top performer by 0.7%. At the 10-tool threshold, F1 scores dropped substantially for most tools, except pbsv, which reported significantly fewer insertions than others. This suggests the benchmark set at this threshold may be incomplete. As a result, recall becomes a more informative metric under such stringent criteria, and FocalSV achieved the highest recall among all tools. The number of benchmark insertions ranged from 4231 to 6238 as the support threshold increased from two to 10, closely aligning with the 5281 Tier 1 insertions reported in the HG002 high-confidence BED file, further validating the soundness of our evaluation framework.
In summary, FocalSV achieved the highest overall performance in deletion detection and consistently ranked among the top performers for insertion detection on the HG005 data set, highlighting its robustness, reliability, and broad applicability across diverse genomic contexts.
FocalSV maintains strong SV detection performance regardless of variations in phasing quality
FocalSV utilizes Longshot for phasing and read partitioning into two haplotypes prior to indel SV assembly; therefore, phasing quality can directly influence downstream SV detection accuracy. We assessed phasing accuracy using SNP-based switch error metrics (https://github.com/ywchoi/phasing) and PhaseQ scores derived from Strand-seq data, as detailed in the Supplemental Methods and Supplemental Figure S37. Across HiFi, CLR, and ONT data sets, we observed low switch error rates (median: 0%; mean: 2.2%–2.4%) and high proportions of correctly phased heterozygous variants (median: 97.8%–100%; mean: 93.3%–95.6%), with 68% of regions achieving 0% SER (Supplemental Fig. S38). Strand-seq analysis further confirmed robust phasing, with over 80% of phase blocks showing PhaseQ values >0.8 (Supplemental Fig. S39). Additional results are provided in the Supplemental Results.
To evaluate phasing quality, we further examined the distribution of phased read percentages across all target regions. Both HiFi and ONT data sets exhibited high phasing rates (Hifi_L1: mean 83%–87%, median 97%–98% across both modes; ONT_L1: mean 82%–88%, median 84%–90%) (Supplemental Fig. S40), whereas the CLR data set displayed lower phasing rates (mean 49%–52%, median 57%–58%) (Supplemental Fig. S40). To assess the effect of phasing on SV detection, we ranked all target regions by phased read percentage and divided them into high and low phasing groups. SV detection performance was then compared between these groups. Regions with higher phasing percentages showed moderately improved F1 scores across HiFi, CLR, and ONT data sets, particularly for deletions. For instance, deletion F1 scores for high versus low phasing regions were 95.1% versus 93.4% (Hifi_L1), 93.3% versus 91.8% (CLR_L1), and 94.5% versus 91.5% (ONT_L1) (Supplemental Table S6). In contrast, insertion detection was less affected, with F1 scores of 91.2% versus 91.2% (Hifi_L1), 90.1% versus 89.1% (CLR_L1), and 92.3% versus 90.2% (ONT_L1) (Supplemental Table S6). Overall, FocalSV demonstrated high phasing accuracy for both SNP phasing and local assemblies, while maintaining robust structural variant detection performance even in regions with lower proportions of phasing-informative reads.
FocalSV achieves superior performance in complex somatic SV detection in cancer data
To extend the evaluation to include SV detection beyond deletions and insertions, we analyzed additional SV types involving complex DNA rearrangements, such as translocations, inversions, and duplications. FocalSV and other relevant tools were applied to detect somatic SVs in two publicly available cancer libraries (Fang et al. 2021). Dipcall was excluded from this analysis, as it was not designed to detect these three types of SVs. Although PAV is designed to detect inversions, it failed to detect any inversions in the cancer data and was therefore also excluded from this analysis.
We conducted a comparative analysis by applying the selected tools to two publicly available tumor-normal paired libraries (PacBio CLR and ONT), as provided by Talsania et al. (2022). These libraries, along with the high-confidence HCC1395 somatic SV callset serving as the benchmark gold standard, formed the basis for evaluating the detection of three classes of somatic SVs. Each benchmarked tool was first applied independently to each library, generating VCF files. These VCFs were then processed using SURVIVOR (Jeffares et al. 2017) to identify somatic variants by comparing paired normal-tumor VCFs. The detailed method to detect somatic SVs is provided in the Supplemental Methods section. The identified somatic SVs were subsequently compared to the gold standard, which contained 137 translocations, 133 inversions, and 230 duplications.
FocalSV(auto) outperformed other tools (SVIM-asm, cuteSV, SVIM, pbsv, and Sniffles2) in terms of F1 score across nearly all sequencing libraries and SV types, except for inversions in ONT data (Table 5). Specifically, on PacBio CLR data, FocalSV(auto) outperformed the second-best tools in F1 score by 4.7%, 1.2%, and 7.6% for translocations, inversions, and duplications, respectively. On ONT data, FocalSV(auto) exceeded the second-best tools by 29.6% and 6.3% for translocations and duplications, respectively. For inversions, Sniffle2 achieved the highest F1 score (30.4%), followed by FocalSV(auto) (20.2%). We also applied FocalSV(target) to directly detect the high-confidence somatic SV callset based on predefined target regions. As expected, it achieved the highest F1 scores across all scenarios, followed by FocalSV(auto).
Somatic SV detection performance on paired normal-tumor HCC1395 breast cancer data using PacBio and ONT sequencing
Computation cost of FocalSV
Finally, we evaluated FocalSV's memory requirement and runtime performance. For a relatively large SV—an insertion of 12.6 kb on Chromosome 21—FocalSV finished execution in 32 sec of elapsed time and 5 min and 20 sec of CPU time, using a maximum 5.6 MB of memory when run with eight threads. In comparison, detecting the smallest SV—a deletion of 50 bp on Chromosome 21—took a similar elapsed time of 33 sec and required 5 min and 30 sec ofCPU time, with a higher memory usage of 0.76 GB. On average, the CPU time was ∼5.5 min for one target region, reflecting consistent computational effort regardless of SV size.
Based on this estimate, detecting 20,000 SVs would require approximately 1800 total CPU hours—comparable to the runtime for FocalSV(auto) to assemble a single library. As such, assembling all SVs across an entire genome using FocalSV can still be more computationally demanding than alignment-based methods. Importantly, we did not compare FocalSV's runtime to existing SV callers, as its time efficiency is specifically optimized for targeted analyses involving a limited number of regions rather than whole-genome discovery. Whereas assembly-based SV detection is generally resource-intensive, FocalSV's region-based design enables efficient and rapid analysis when users focus on selected loci of interest.
FocalSV is designed to support multilevel parallelization, allowing tasks to be efficiently distributed across multiple servers, with each server assigned to distinct genomic regions. Within each region, FocalSV utilizes multithreading to manage assembly and variant detection tasks, maximizing CPU core utilization.
Discussion
FocalSV is a high-performance, region-aware tool for structural variant detection. It supports two complementary operational modes—auto and target—designed to accommodate distinct analytical scenarios. The auto mode autonomously identifies and refines SV-enriched regions by integrating population-scale patterns with individual read-level signals. This makes it particularly suitable for discovery-driven analyses where no prior SV information is available, offering a scalable alternative to whole-genome assembly. In contrast, the target mode is optimized for hypothesis-driven studies, allowing users to input specific regions of interest, such as those derived from existing SV annotations or clinically relevant loci. By combining the accuracy of assembly-based methods with the efficiency of region-specific processing, FocalSV delivers robust and scalable performance across diverse sequencing technologies and SV types. Together, these modes establish FocalSV as a flexible and effective solution for both exploratory and targeted structural variant analyses.
Across nine HG002 long-read data sets, FocalSV demonstrated consistently strong and reliable performance in detecting large indel SVs. Both auto and target modes ranked among the top two tools in F1 score across PacBio HiFi, CLR, and ONT platforms, while maintaining high genotyping accuracy (>98%) across nearly all data sets. FocalSV also showed robust performance across a broad range of SV sizes and evaluation criteria, highlighting its versatility for structural variant analysis in long-read sequencing. Furthermore, its strong performance on the HG005 sample underscores the tool's robustness and generalizability across different individuals.
FocalSV also showed strong capabilities in detecting translocations, inversions, and duplications in tumor-normal paired cancer data sets. Across multiple sequencing platforms, both modes outperformed existing tools. The target mode, guided by known SV regions, achieved the highest accuracy across all variant types, whereas the auto mode performed robustly without prior region knowledge. It is worth noting that FocalSV is designed to rely primarily on read alignment-based signals rather than contig-based assemblies for detecting translocations and inversions. This decision is motivated by the practical challenge of assembling these SV types, even when sufficient supporting reads are present. We recover most duplications indirectly, through assembled insertions. Our recent benchmark study (Liu et al. 2024) further supports this strategy, showing that most assembly-based tools are not optimized for translocations, inversions, and duplications, whereas alignment-based approaches often yield better sensitivity and precision. These findings support our choice to prioritize alignment-based evidence for these SV classes.
Methods
We present FocalSV, a targeted SV detection framework that integrates assembly- and alignment-based signals through region-specific analysis, enabling accurate detection and characterization across all SV types: insertions, deletions, duplications, translocations, and inversions. FocalSV operates in two modes: target and auto. In target mode (referred to as FocalSV[target]), it uses user-defined regions of interest, whereas in auto mode (FocalSV[auto]), it automatically identifies and expands regions likely to contain SVs.
Large INS and DEL assembly
FocalSV takes the whole-genome aligned reads BAM file along with either user-specified target regions or automatically detected candidate regions to perform assembly and refinement of large indel SVs (≥50 bp) (Fig. 1). FocalSV(auto) employs a customized algorithm to detect potential SV regions, with details provided in the following section. These candidate regions are saved in a BED file. Once target regions are defined—either automatically or manually—they are used for a target region-based workflow.
This workflow for identifying a single target SV consists of the following steps: (1) Extraction of region-specific BAM file; (2) partitioning of reads; (3) haplotype-aware local assembly; (4) detection of candidate SV; and (5) filtering of indel SVs and refinement of genotypes.
Automatic identification of regions with potential SVs
To identify genomic regions likely to harbor SVs, we integrated two complementary sources of evidence: (1) read-level SV breakpoint signatures extracted from individual long-read alignments; and (2) population-scale SV breakpoints obtained from pangenome-based multisample SV catalogs. Each source was independently processed to capture both sample-specific and recurrent population variation, and their results were subsequently merged through distance-based clustering to generate a comprehensive, high-confidence set of candidate SV intervals as input for FocalSV(auto).
Read-based SV signature clustering
For each sequencing library, we first extracted candidate SV signatures from the read-to-reference alignment (BAM) file. To comprehensively detect insertions and deletions from long-read alignments, we integrated both intra- and interalignment signatures. Intra-alignment signatures were derived directly from the primary alignment's CIGAR string, where insertions were identified from “I” operations and deletions from “D” operations, each exceeding a user-defined minimum length threshold (default: 30 bp). Insertions were represented as triplets (P, L, S), where P is the aligned reference position, L is the inserted sequence length, and S is the inserted sequence retrieved from the read. Deletions were recorded as pairs (P, L), where P indicates the reference start position and L the deletion length. To mitigate redundancy caused by alignment fragmentation, adjacent intra-alignment signals within the same read were merged if their positions were within a user-defined proximity threshold. In contrast, interalignment signatures were extracted from split-read mappings by utilizing supplementary alignment (SA) tags to identify reads with multiple alignment segments. For each pair of consecutive segments mapped to the same chromosome and strand, we calculated the differences between the read and reference coordinates. A large gap in the read combined with a small gap in the reference indicated a deletion, whereas a large gap in the reference with minimal read gap signified an insertion. These interalignment signatures enabled detection of SVs that span multiple alignment blocks, large insertions or deletions, or complex breakpoints often fragmented by long-read alignment algorithms. By integrating both intra- and interalignment signals, the method improves sensitivity for detecting large and alignment-fragmented SVs.
Subsequently, for each large indel SV type, SV signatures were initially clustered based on genomic proximity using a fine-scale
distance threshold (dtfine, default: 500 bp) to group nearby events. Clusters supported by fewer than a minimum number of individual signatures ( , default: 0.2 × average coverage) were discarded. Each retained cluster was represented as a genomic interval spanning the
first to last breakpoint in the group. To address potential redundancy and positional uncertainty, a second, coarser round
of clustering was performed using a broader threshold (dtcoarse, default: 15 kb), yielding a refined set of candidate SV regions derived from read-level evidence.
, default: 0.2 × average coverage) were discarded. Each retained cluster was represented as a genomic interval spanning the
first to last breakpoint in the group. To address potential redundancy and positional uncertainty, a second, coarser round
of clustering was performed using a broader threshold (dtcoarse, default: 15 kb), yielding a refined set of candidate SV regions derived from read-level evidence.
Pangenome-based SV clustering
Inspired by recent advances in pangenome graph-based SV genotyping for short-read data (Ebler et al. 2022), we leveraged population-scale variation data by incorporating breakpoint positions from a multisample VCF file to supplement individual-level SV signals. This same VCF also provides the variant catalog used for pangenome graph construction in Pangenie (Ebler et al. 2022), enabling improved sensitivity and consistency in genotyping across diverse individuals. All nonheader records were parsed to extract SV breakpoints, which were grouped by chromosome and sorted by genomic position. A clustering procedure, similar to read-based breakpoint clustering, was applied using the same coarse distance threshold (dtcoarse, default: 15 kb). Specifically, SV breakpoints located within the specified threshold were merged into clusters, producing a population-informed set of candidate SV regions.
To avoid bias in our evaluation, samples HG002 and HG005 were excluded from the multisample VCF input. The VCF was constructed using haplotype-resolved assemblies from nine individuals (HG01109, HG01243, HG02055, HG02080, HG02109, HG02145, HG02723, HG03098, and HG03492). SVs were identified from the assemblies and merged using the Pangenie vcf-merging pipeline (Ebler et al. 2022). This multisample VCF serves as the default population reference for FocalSV(auto), although users may substitute any population-scale, pangenome graph-based SV catalog suitable for their specific study population. As additional high-quality HiFi assemblies become available, FocalSV(auto) can leverage increasingly comprehensive population variation, improving sensitivity for recurrent, low-frequency, or difficult-to-resolve SVs that may be missed in single-sample analyses.
Integration of candidate SV regions from read-level and pangenome-based evidence
The final set of SV candidate regions was generated by merging the refined intervals from both sources: read-level signatures
extracted from individual BAM files and population-based SV calls. For each chromosome, intervals from both sources were combined
and reclustered using the same coarse distance threshold (dtcoarse) to consolidate overlapping or proximal regions. To accommodate breakpoint uncertainty inherent to long-read alignments and
SV merging, each resulting interval was symmetrically extended by  (default: 7 kb). This integration strategy ensures that both individual-specific and population-informed variation contribute
to a comprehensive set of candidate SV regions. The merged intervals were output in BED format and used as input for the subsequent
target region-based workflow.
(default: 7 kb). This integration strategy ensures that both individual-specific and population-informed variation contribute
to a comprehensive set of candidate SV regions. The merged intervals were output in BED format and used as input for the subsequent
target region-based workflow.
Extraction of region-specific BAM file
FocalSV(target) is designed for scenarios where regions suspected to contain SVs have been identified, but the precise details of the SVs within that region have yet to be determined. FocalSV(target) assists in more accurately inferring SV breakpoint and sequence based on prior knowledge. To use FocalSV(target), users must provide suspected SV-containing regions, which serve as input. FocalSV(target) then extracts region-specific BAM files for subsequent reads partitioning, SV assembly, and refinement. In our experiments, to validate the accuracy of SV calling for FocalSV(target), we adopted the benchmark VCF file of the sample HG002 from Genome in a Bottle as prior knowledge.
Specifically, for INSs, the start and end positions of the target regions we utilized are defined as follows: (1)
where the breakpoint refers to the insertion breakpoint on the reference genome, and the flanking size we used is 50 kb by
default.
(1)
where the breakpoint refers to the insertion breakpoint on the reference genome, and the flanking size we used is 50 kb by
default.
In terms of DELs, the target regions we utilized are defined as follows: (2)
where the startDEL and endDEL refer to the starting and ending positions of a target DEL on the reference genome and the flanking size we used is 50 kb.
When the breakpoints of INSs and DELs are unknown, users can estimate breakpoints to define the target regions and adjust
the flanking regions to ensure regions are sufficiently large to encompass the potential SV.
(2)
where the startDEL and endDEL refer to the starting and ending positions of a target DEL on the reference genome and the flanking size we used is 50 kb.
When the breakpoints of INSs and DELs are unknown, users can estimate breakpoints to define the target regions and adjust
the flanking regions to ensure regions are sufficiently large to encompass the potential SV.
In contrast, FocalSV(auto) automatically scans the aligned BAM file to detect regions suspected of harboring SVs using a custom detection method introduced earlier. It then extracts region-specific BAM files for subsequent reads partitioning, SV assembly, and refinement.
Partitioning of reads
The FocalSV pipeline integrates Longshot (Edge and Bansal 2019), a haplotype estimation tool, to perform phasing. Longshot builds on the read-based haplotype phasing algorithm, HapCUT2 (Edge et al. 2017) and employs a pair-Hidden Markov Model (pair-HMM) to mitigate uncertainties in local alignment. This approach enables the estimation of precise base quality values, which are crucial for genotype likelihood calculations. However, because Longshot is specifically designed to detect and phase single nucleotide variants and only ∼75% of the reads can be partitioned into two distinct haplotypes, we assume the remaining 25% of reads correspond to highly homogeneous regions. As a result, FocalSV assigns the remaining reads directly to both haplotypes of the nearest phase block.
Haplotype-aware local assembly
After reads partitioning, every read within the region BAM file is assigned to a certain phase block and haplotype. FocalSV then performs local assembly based on these phase blocks and haplotypes. For PacBio HiFi reads, FocalSV adopts hifiasm (v0.14) (Cheng et al. 2021) for local assembly, whereas for PacBio CLR and Nanopore (ONT) reads, Flye (v2.9.1) (Kolmogorov et al. 2019) is utilized. Haplotype-resolved contigs are generated at the end of this procedure.
In rare cases where the target region is either too small or highly homogeneous, Longshot may fail to produce a phased BAM file. To address this limitation, we adopted a dual-assembly strategy. For HiFi data, we used hifiasm (v0.16) in dual-haplotype mode to generate haplotype-resolved assemblies. For CLR and ONT data, we employed a combination of Flye and HapDup to construct dual assemblies.
Detection of candidate indel SVs
The haplotype-resolved contigs are then aligned to the human reference genome using minimap2 (Li 2018) and SAMtools (Danecek et al. 2021) in FocalSV. For HG002, we used hg19 reference genome to evaluate SVs because the GIAB gold standard SV callset is available only for hg19. The example command is as follows:
minimap2 -a -x asm5 ‐‐cs -r2k -t 30 \
<ref_genome> \
<contigs_fasta> \
| samtools sort > contigs.bam
samtools index contigs.bam
Notably, the contigs-to-reference BAM file shares similar features with the reads-to-reference BAM file, as both files contain intra- and interalignments inferred by CIGAR operations, which indicate potential SVs. However, two key differences exist in terms of coverage and length: the reads-to-reference BAM file typically exhibits much higher coverage, whereas the contigs are generally much longer than individual reads. To reliably collect SV-related signatures from contig-to-reference BAM file, we adapt the contig-based signature collection methodology from VolcanoSV (Luo et al. 2024), which refines and optimizes the conventional reads-based SV signature collection methods.
The contig-based signature collection method can be intuitively explained. When an INS is present in the individual's genome, the contig can be conceptualized as a structure of “reference sequence A + INS sequence + reference sequence B.” If the INS sequence is short, it is typically supported by an intra-alignment, which can be directly extracted from the CIGAR operation. However, longer INS sequences are supported by an interalignment (split alignments), where reference sequences A and B align independently to the human reference, whereas the INS sequence remains unaligned. Similarly, for a DEL in the individual's genome, the human reference genome can be viewed as having a structure of “sequence A + sequence B + sequence C,” whereas the corresponding contig can be considered approximately as “sequence A + sequence C,” with sequence B deleted. This deletion can be directly identified from the CIGAR operation. DELs can also be inferred from split alignments, where sequences A and C (adjacent on the contig) are aligned independently to two distant regions on the reference genome.
An INS signature, inferred from a pair of split-alignment events, is collected as follows: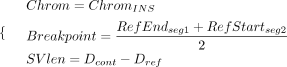 (3)
when
(3)
when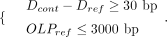 (4)
A DEL signature is collected as follows:
(4)
A DEL signature is collected as follows: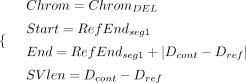 (5)
when
(5)
when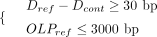 (6)
where RefStartsegi and RefEndsegi denote the start and end coordinates of ith aligned sequence segment relative to the human reference (i ∈ [1, 2]). The segment with the smaller start coordinate on the reference genome is designated as the first aligned segment.
Dcont and Dref represent the distance between two segments relative to the contig and the human reference, respectively. OLPref refers to the overlap size between two segments on the human reference.
(6)
where RefStartsegi and RefEndsegi denote the start and end coordinates of ith aligned sequence segment relative to the human reference (i ∈ [1, 2]). The segment with the smaller start coordinate on the reference genome is designated as the first aligned segment.
Dcont and Dref represent the distance between two segments relative to the contig and the human reference, respectively. OLPref refers to the overlap size between two segments on the human reference.
We then incorporated the clustering pipeline from VolcanoSV (Luo et al. 2024) to organize the collected signatures by SV type and generate a candidate SV pool. The pipeline involves three steps. Firstly, a chaining clustering algorithm groups signatures from the same haplotype, using SV size similarity and breakpoint distance as clustering criteria. Next, a pairing algorithm matches signatures from different haplotypes for genotyping. Finally, a stringent one-to-K clustering algorithm is applied to reduce the redundancy in the callset.
Filtering of indel SVs and refinement of genotypes
To further refine SV calls, FocalSV employs VolcanoSV's reads-based signature support algorithm (Luo et al. 2024) to filter out false positive SVs and enhance genotyping precision.
For false positive control, the process begins by gathering read-based SV signatures near the potential SV breakpoints. A similarity score is then calculated between the read-based signature and the candidate SV. Signatures exceeding the similarity threshold are considered supporting signatures. A candidate INS is retained if it has at least one supporting signature, whereas a candidate DEL must meet the supporting coverage threshold (calculated as the ratio of supporting signatures to local read coverage) to be considered valid.
For genotype refinement, a genotype decision tree model (Luo et al. 2024) is employed to correct the genotype of indel SVs. This model considers five key parameters: contig-based genotype (heterozygous or homozygous); SV size (small or large indel); SV type (insertion or deletion); sequencing technology (HiFi, CLR, or ONT); and a supporting read-based signature ratio (number of supporting read-based signatures/local read depth). With all combinations of the first four parameters, the decision tree consists of 24 leaf nodes. Each leaf node is associated with an empirically determined threshold for the supporting signature ratio. This ratio, ideally reflecting the genotype, is then utilized to predict the final genotype of the SV.
Multiple-region mode
FocalSV is also designed to detect SVs across multiple regions. When provided with multiple target regions either automatically or manually, FocalSV first retrieves region-specific BAM files and applies the same steps for each region: reads partitioning; local assembly; and candidate SV detection. This process is parallelized in FocalSV for greater efficiency. Afterward, FocalSV merges all VCF files from each region into a single VCF file. A clustering algorithm is then applied to the merged VCF file to eliminate redundant variants. Finally, the SV filtering and genotype refinement are performed to produce the final VCF file.
Detection, recovery, and breakend refinement of duplications, translocations, and inversions in the target mode
Duplication detection and recovery
For duplication detection in the target mode, FocalSV integrates information from both contigs and read-based BAM files. The user provides the approximate start and end positions of the target duplication as prior knowledge. Using this input, contigs are generated through a region-based assembly pipeline, the same approach used for large indel detection. These contigs are subsequently aligned to a human reference genome to produce a contig-based BAM file. Simultaneously, a read-based BAM file is generated by extracting reads from the user-defined target duplication region along with an extended flanking region (default: 25 kb). In the alignment-based information derived from the contig-based BAM file, duplication can be regarded as a special instance of insertion, particularly when the inserted sequence closely resembles a reference segment near the insertion breakpoint. As a result, if two adjacent segments on the contig align to the same region on the reference genome, a duplication can be directly inferred. However, in practice, due to the limitation of existing aligners, only one of the duplicated segments may be correctly aligned to the reference, whereas the other segment is “skipped,” leading to it being incorrectly labeled as an INS in the BAM file. To address this, we designed a dedicated duplication recovery pipeline from insertion calls. Specifically, FocalSV extracts the alternate alleles from all insertion calls and realigns them to the reference genome. If an alternate allele aligns close to its corresponding insertion breakpoint, it indicates the presence of a duplication (Fig. 2A). The duplication's start and end coordinates are defined by the alignment coordinates of the alternate allele.
This recovery procedure can recover a considerable amount of DUPs missed by the aligner. However, in cases where the contigs
are collapsed (i.e., do not contain the duplicated segments) due to misassembly, we designed an additional reads alignment-based
approach to recover those DUPs. In this approach, FocalSV identifies events in the target region where a read aligns more
than once on the same strand, generating an alignment records pool for each mutialigned read (MAR). For each MAR, the positional
relationship between any two alignment records is evaluated to determine whether they suggest a duplication. A DUP signature
is inferred when the pair of read segment alignment records meet the below conditions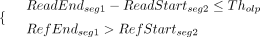 (7)
where ReadStartsegi, ReadEndsegi, RefStartsegi, and RefEndsegi represent the start and end coordinates of the ith segment relative to read and reference, respectively (Fig. 2A). Tholp denotes the maximum allowed overlap between two segments (500 bp by default). The segments are ordered such that ReadStartseg1 < ReadStartseg1.
(7)
where ReadStartsegi, ReadEndsegi, RefStartsegi, and RefEndsegi represent the start and end coordinates of the ith segment relative to read and reference, respectively (Fig. 2A). Tholp denotes the maximum allowed overlap between two segments (500 bp by default). The segments are ordered such that ReadStartseg1 < ReadStartseg1.
Next, FocalSV applies a distance-based clustering algorithm to group DUP signatures. Two DUP signatures are clustered together if their breakpoint shift is less than a specified distance threshold (1000 bp by default). The average start and end positions within each cluster are selected as the final breakpoints of the DUP. It is important to note that this reads-based approach is only used for DUPs estimated to be smaller than 5 Mb, as split-alignments with gaps larger than 5 Mb on the reference are likely misalignments and unreliable. Finally, FocalSV merges the result from both the contig-based and read-based BAM files to generate the final set of DUP calls.
Translocation detection
The format for a typical translocation (TRA) is (8)
To accurately detect breakends (BNDs) of TRAs in the target mode, FocalSV requires prior knowledge of the approximate regions
for both BNDs, PosA and PosB
(8)
To accurately detect breakends (BNDs) of TRAs in the target mode, FocalSV requires prior knowledge of the approximate regions
for both BNDs, PosA and PosB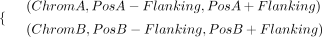 (9)
To achieve the detection and refinement, FocalSV identifies TRA signatures from read-based BAM files and calculates the optimal
BND. Specifically, TRAs are inferred when two adjacent segments on the read align to different chromosomes. FocalSV first
collects reads aligned to both BND regions using Equation 9. It then calculates the segment distance between two alignment records of each read. A TRA event is inferred if the two alignment
records satisfy the below conditions:
(9)
To achieve the detection and refinement, FocalSV identifies TRA signatures from read-based BAM files and calculates the optimal
BND. Specifically, TRAs are inferred when two adjacent segments on the read align to different chromosomes. FocalSV first
collects reads aligned to both BND regions using Equation 9. It then calculates the segment distance between two alignment records of each read. A TRA event is inferred if the two alignment
records satisfy the below conditions: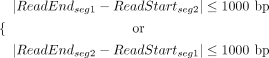 (10)
where ReadStartseg1, ReadEndseg1, ReadStartseg2, and ReadEndseg2 represent the start and end positions of each aligned segment on the read, respectively. A TRA signature is represented as
follows:
(10)
where ReadStartseg1, ReadEndseg1, ReadStartseg2, and ReadEndseg2 represent the start and end positions of each aligned segment on the read, respectively. A TRA signature is represented as
follows: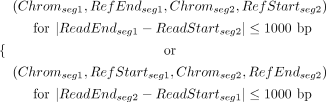 (11)
where RefStartseg1, RefEndseg1, RefStartseg2, and RefEndseg2 denote the start and end positions of each aligned segment on the reference genome, respectively (Fig. 2B). A clustering algorithm is then employed to merge TRA signatures. Any two TRA signatures are grouped into a single cluster
if they meet the following criteria:
(11)
where RefStartseg1, RefEndseg1, RefStartseg2, and RefEndseg2 denote the start and end positions of each aligned segment on the reference genome, respectively (Fig. 2B). A clustering algorithm is then employed to merge TRA signatures. Any two TRA signatures are grouped into a single cluster
if they meet the following criteria: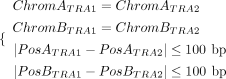 (12)
The average coordinate for each BND is selected as the cluster center, serving as the final TRA call.
(12)
The average coordinate for each BND is selected as the cluster center, serving as the final TRA call.
Inversion detection
The format for a typical inversion is (13)
Similar to TRA, the target region in the target mode for INV is defined as follows:
(13)
Similar to TRA, the target region in the target mode for INV is defined as follows: (14)
FocalSV then identifies INV signatures from the read-based BAM file. Specifically, INV events are identified when two adjacent
segments of a read align to two distant locations on the reference in reverse orientations. The criteria for inferring an
INV and its corresponding signature are outlined below:
(14)
FocalSV then identifies INV signatures from the read-based BAM file. Specifically, INV events are identified when two adjacent
segments of a read align to two distant locations on the reference in reverse orientations. The criteria for inferring an
INV and its corresponding signature are outlined below: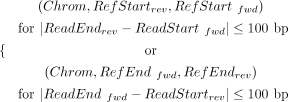 (15)
where ReadStartfwd, ReadEndfwd, ReadStartrev, and ReadEndrev denote the start and end positions of the forward- and reverse-aligned segment on the read, whereas RefStartfwd, RefEndfwd, RefStartrev, and RefEndrev represent the start and end positions on the reference (Fig. 2C). A clustering algorithm is then applied to merge INV signatures. Two INV signatures are grouped into a single cluster if
they meet the following criteria:
(15)
where ReadStartfwd, ReadEndfwd, ReadStartrev, and ReadEndrev denote the start and end positions of the forward- and reverse-aligned segment on the read, whereas RefStartfwd, RefEndfwd, RefStartrev, and RefEndrev represent the start and end positions on the reference (Fig. 2C). A clustering algorithm is then applied to merge INV signatures. Two INV signatures are grouped into a single cluster if
they meet the following criteria: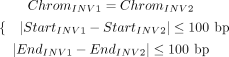 (16)
The average position for each BND is selected as the cluster center, serving as the final INV call.
(16)
The average position for each BND is selected as the cluster center, serving as the final INV call.
Automatic detection and refinement of duplications, translocations, and inversions
When target regions are not provided or available, the auto mode of FocalSV can be used to detect duplications, translocations, and inversions. Its SV detection workflow consists of three modules: (1) signature extraction; (2) signature clustering; and (3) postprocessing.
Signature extraction
In auto mode, to localize potential signals of duplications, translocations, and inversions across the genome, FocalSV first divides each chromosome into contiguous, nonoverlapping 1-Mb windows. Within each window, all long reads aligned to that region are examined for evidence of split alignments. Intuitively, a split alignment indicates that a single read maps to two distinct genomic loci, potentially reflecting an underlying SV such as an inversion, duplication, or translocation.
Within each 1-Mb window, FocalSV identifies reads carrying a supplementary alignment tag and meeting a minimum mapping quality threshold (MAPQ ≥ 10). SA tags indicate additional alignments of the same read, commonly arising from SVs that cause discontinuous or ambiguous mappings. Compared to the primary alignment, the supplementary alignment may reside on the same chromosome—indicating a potential inversion or duplication—or on a different chromosome—suggesting a possible translocation. By scanning all windows in parallel, FocalSV accumulates three sets of candidate reads per window:
-
Inversion candidates: Reads with supplementary alignment on the same chromosome but in the opposite orientation relative to the primary alignment.
-
Duplication candidates: Reads with supplementary alignment on the same strand and in the same orientation as the primary alignment.
-
Translocation candidates: Reads with supplementary alignment mapping to a different chromosome.
Each candidate read is annotated with mapping the start and end position on both the reference genome and the read, along with strand orientation and mapping quality for primary and supplementary alignments. After processing all windows on a given chromosome, candidate reads are aggregated into chromosome; wide collections by SV type, serving as input for downstream signature inference. To detect SV signatures corresponding to duplications, translocations, and inversions, FocalSV applies type-specific pairing rules based on reference and read-level coordinates, as defined in Equations 7, 11, and 15. Specifically, a duplication signature is inferred when two same-strand segments align to the same chromosome in order, with minimal separation on the read and substantial overlap on the reference (Eq. 7). A translocation signature is inferred when a single read maps to two distinct chromosomes, with the segments located within 1000 bp on the read (Eq. 11). An inversion signature is inferred when two segments align to opposite strands of the same chromosome, with no more than 100 bp separation on the read and close proximity on the reference (Eq. 15).
Signature clustering
To consolidate redundant signatures and minimize noise, FocalSV applies a distance-based clustering algorithm to the inferred duplications, translocations, and inversions signatures. For each SV type, the signatures are grouped into clusters if their genomic coordinates lay within a fixed distance threshold (default: 100 bp), ensuring that nearby signatures likely originating from the same event are merged (Eqs. 12, 16). Each resulting cluster is treated as a candidate SV call. Within each cluster, summary statistics are computed, including the mean start and end coordinates (or breakend positions), the number of supporting reads, average mapping quality, and the standard deviation of breakpoint positions across supporting alignments. These features are then used for downstream filtering and prioritization of high-confidence SVs.
Postprocessing
To refine duplication candidates, FocalSV employs a structured postprocessing pipeline that integrates read-level evidence with both local and global coverage statistics. First, the genome-wide average read depth (globalRD) is estimated from the corresponding BAM file to enable subsequent feature adjustment. For each duplication event, a minimum number of supporting reads is required—by default, at least 0.1 × globalRD—carrying valid SA tags and sufficient mapping quality (default ≥50). Coverage is then extracted from the candidate duplication region (COVDUP) as well as from fixed 1-kb flanking windows on the left (COVleft) and right (COVright) sides. Three coverage-based features are computed: (1) Coverage shift: defined as 2 × COVDUP/(COVleft + COVright), this metric captures the expected local increase in coverage due to duplication. (2) Relative duplication coverage: calculated as COVDUP/globalRD, providing a normalized estimate of local copy gain. (3) Breakpoint variability: measured as the standard deviation of the left and right breakpoints within the original DUP cluster, used to detect irregular mapping patterns indicative of potential artifacts. Duplication candidates that do not meet empirically optimized thresholds for any of these features are filtered out. This multifeature framework ensures that only high-confidence duplication calls—with strong read support and consistent coverage profiles—are retained.
Filtering of translocation and inversion candidates is based on two criteria: a minimum number of supporting reads and a minimum mapping quality threshold. Specifically, each candidate is required to have at least r × globalRD supporting split reads, each with mapping quality greater than or equal to a platform-specific threshold. The values of r and the minimum mapping quality vary depending on the sequencing platform and are empirically optimized to account for their distinct error profiles. For example, for INV calls, r and the minimum mapping quality are set to 0.25 and 60 on HiFi data, 0.3 and 58 on CLR data, and 0.35 and 58 on ONT data.
Sequencing data
PacBio CLR, HiFi, and ONT sequencing reads for HG002 are available at GIAB and NCBI. PacBio HiFi sequencing reads for HG005 are available at NCBI. The high-confidence HCC1395 somatic SV callset and the PacBio and ONT tumor-normal paired libraries of HCC1395 are publicly accessible at NCBI. Table 1 lists hyperlinks for all 14 previously mentioned real data sets. The Tier 1 benchmark SV callset and high-confidence HG002 region were obtained from https://ftp-trace.ncbi.nlm.nih.gov/ReferenceSamples/giab/data/AshkenazimTrio/analysis/NIST_SVs_Integration_v0.6/. The haplotype-resolved assemblies for the nine samples used in constructing the multisample VCF are publicly available at https://s3-us-west-2.amazonaws.com/human-pangenomics/index.html?prefix=working/HPRC_PLUS/. These assemblies can be found within the assemblies/year1_freeze_assembly_v2 subdirectory corresponding to each sample. T2T HG002 assembly was obtained from https://s3-us-west-2.amazonaws.com/human-pangenomics/T2T/HG002/assemblies/hg002v1.1.fasta.gz. Strand-seq data for HG002 involved in the phasing quality evaluation are publicly available at https://s3-us-west-2.amazonaws.com/human-pangenomics/index.html?prefix=NHGRI_UCSC_panel/HG002/hpp_HG002_NA24385_son_v1/Strand_seq/. All VCF files that support the findings of this study are available from Zenodo (https://doi.org/10.5281/zenodo.15740572).
Software availability
FocalSV is available freely at GitHub (https://github.com/maiziezhoulab/FocalSV). All scripts necessary to reproduce this study are available as Supplemental Code and are also available at GitHub (https://github.com/maiziezhoulab/FocalSV/tree/main/evaluation).
Competing interest statement
The authors declare no competing interests.
Acknowledgments
This work was supported by the National Institutes of Health, National Institute of General Medical Sciences Maximizing Investigators’ Research Award (MIRA) R35 GM146960.
Author contributions: X.M.Z. conceived and led this work. C.L., Z.J.Z., and X.M.Z. designed the framework. C.L. and Z.J.Z. implemented the framework. C.L., Z.J.Z., and Y.H.L. performed all analyses. C.L., Z.J.Z., and X.M.Z. wrote the manuscript. All authors reviewed the manuscript.
Footnotes
-
[Supplemental material is available for this article.]
-
Article published online before print. Article, supplemental material, and publication date are at https://www.genome.org/cgi/doi/10.1101/gr.280282.124.
-
Freely available online through the Genome Research Open Access option.
- Received November 26, 2024.
- Accepted August 7, 2025.
This article, published in Genome Research, is available under a Creative Commons License (Attribution-NonCommercial 4.0 International), as described at http://creativecommons.org/licenses/by-nc/4.0/.


