
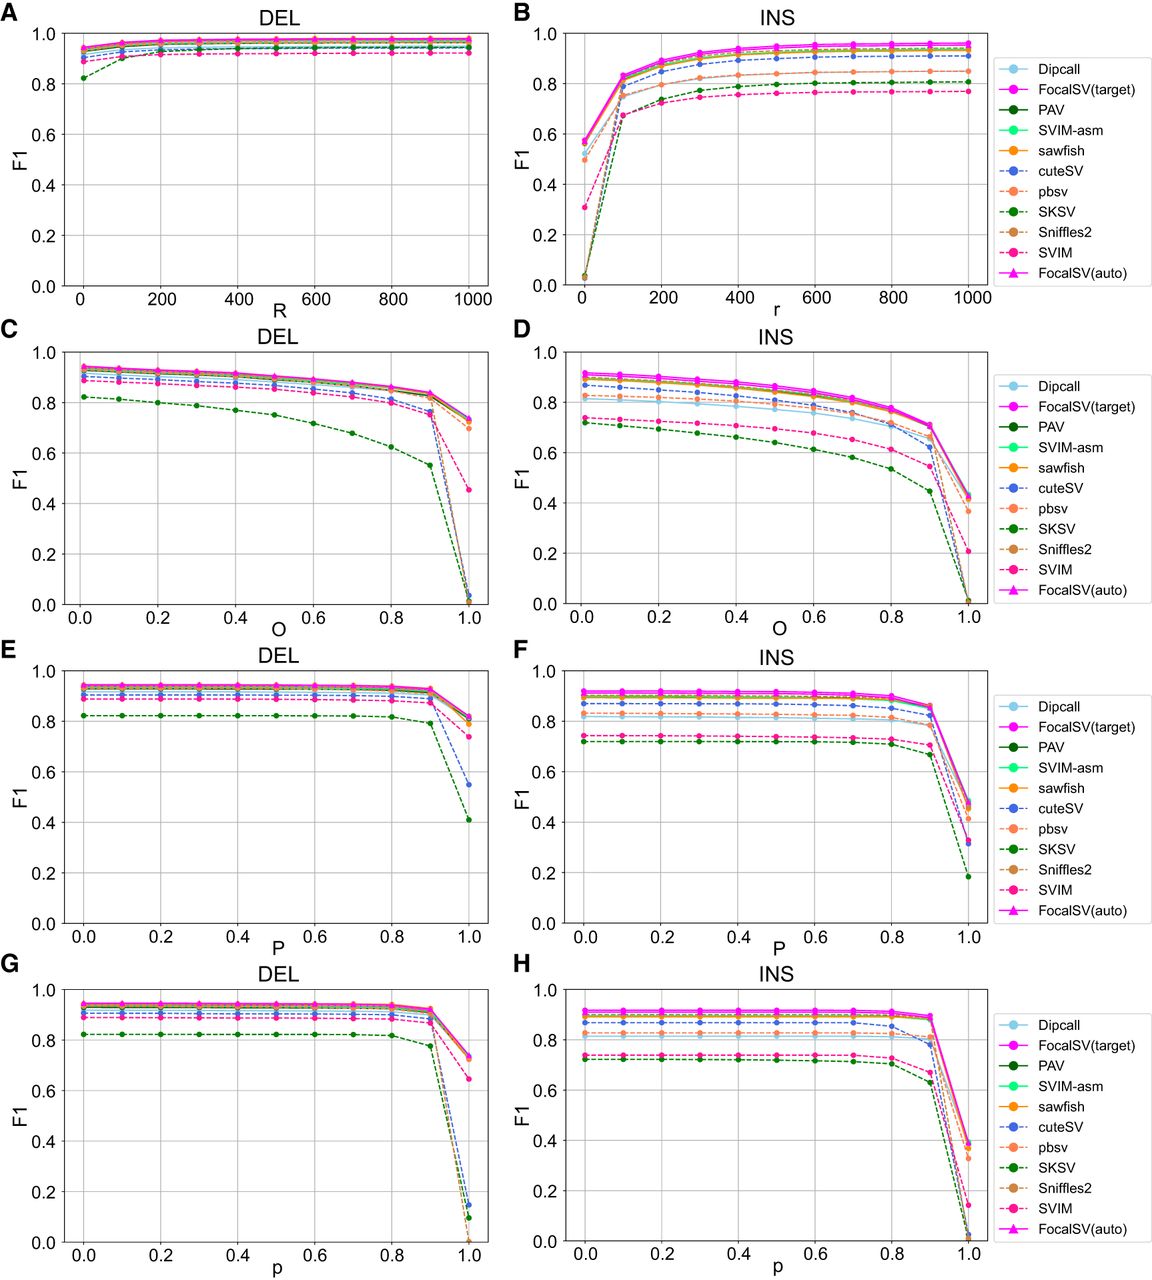
F1 accuracy by changing four different evaluation parameters on Hifi_L2. (A,B) F1 score curves for deletions (DEL) and insertions (INS) across all tools as r is varied. r is the maximum reference location distance between SV call and gold standard SV. r varies from 0 to 1000 bp with a 100-bp interval. (C,D) F1 score curves for deletions and insertions across all tools as O is varied. O is the minimum reciprocal overlap between SV call and gold standard SV. (E,F) F1 score curves for deletions and insertions across all tools as P is varied. P is the minimum allowable allele size similarity between SV call and gold standard SV. (G,H) F1 score curves for deletions and insertions across all tools as p is varied. p is the minimum percentage of allele sequence similarity between SV call and gold standard SV. O, P, and p vary from 0 to 1 with a 0.1 interval.


