
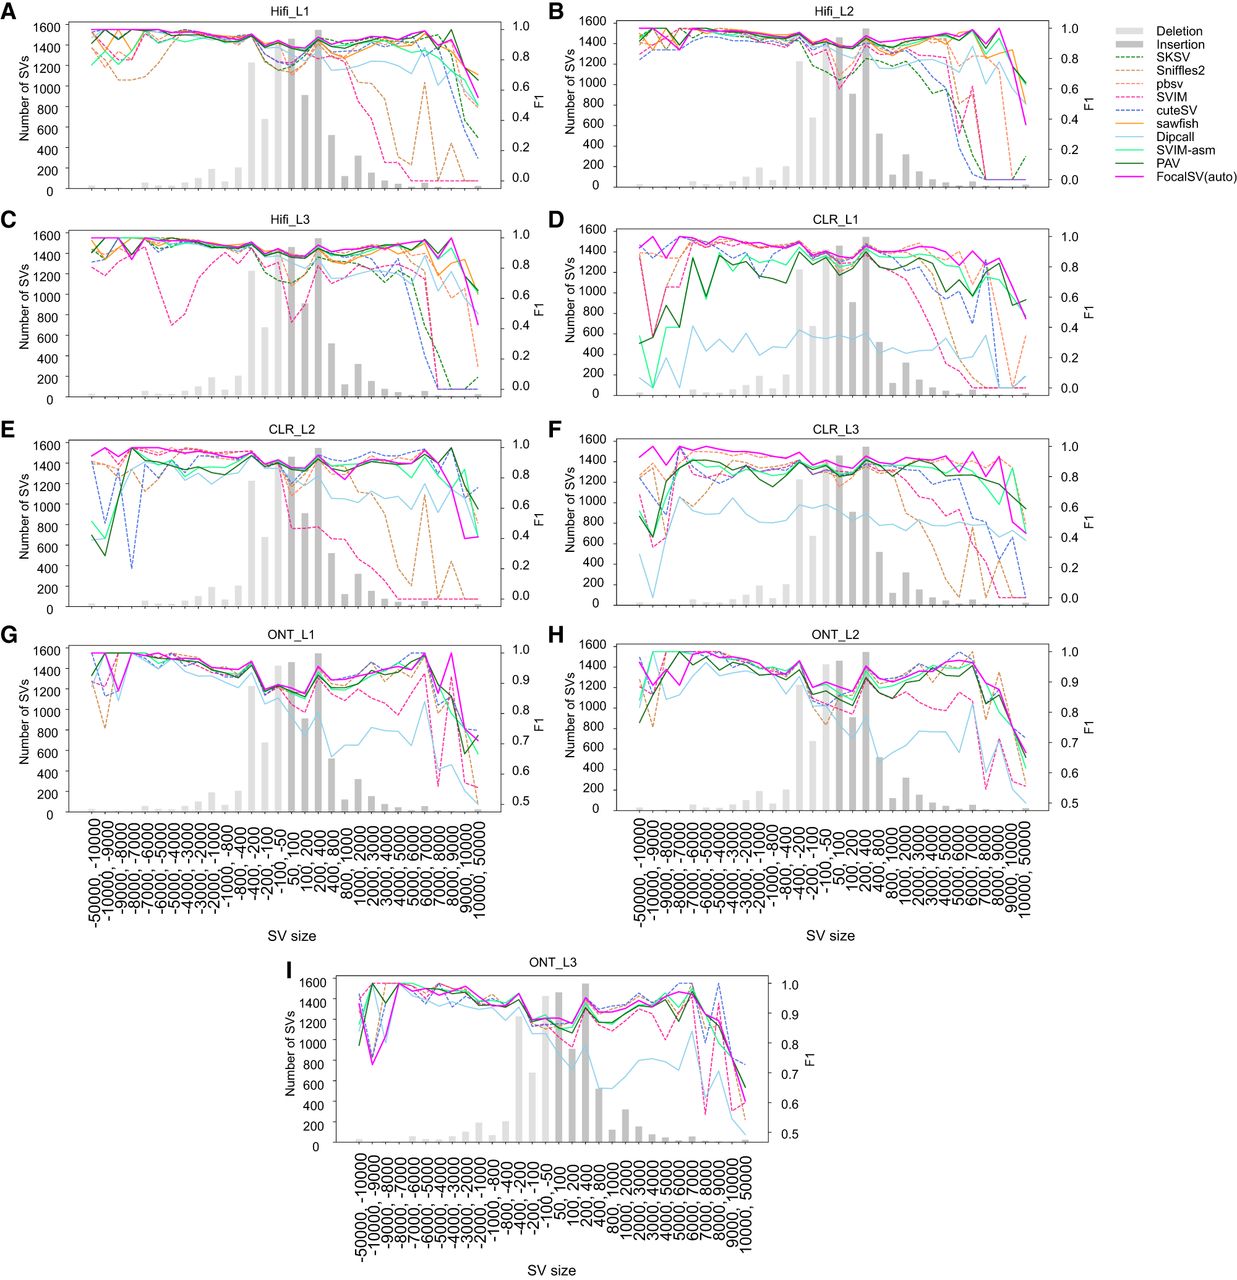
Figure 3.
F1 accuracy of SV detection across various size ranges on nine long-read data sets. (A–C) F1 accuracy plot for three HiFi data sets. Negative ranges denote deletions and the positive ranges denote insertions. The bar plot illustrates the benchmark SV distribution across these size ranges. The line plot displays the F1 scores for four distinct detection methods. Dashed lines indicate alignment-based, whereas solid lines represent assembly-based methods. (D–F) F1 accuracy plot for three CLR data sets. (G–I) F1 accuracy plot for three ONT data sets.


