
Characterizing and controlling intrinsic biases of lambda exonuclease in nascent strand sequencing reveals phasing between nucleosomes and G-quadruplex motifs around a subset of human replication origins
- Brown University Division of Biology and Medicine, Department of Molecular Biology, Cell Biology and Biochemistry, Providence, Rhode Island 02912, USA
- Corresponding author: Susan_Gerbi{at}Brown.edu
-
↵1 These authors contributed equally to this work.
Abstract
Nascent strand sequencing (NS-seq) is used to discover DNA replication origins genome-wide, allowing identification of features for their specification. NS-seq depends on the ability of lambda exonuclease (λ-exo) to efficiently digest parental DNA while leaving RNA-primer protected nascent strands intact. We used genomics and biochemical approaches to determine if λ-exo digests all parental DNA sequences equally. We report that λ-exo does not efficiently digest G-quadruplex (G4) structures in a plasmid. Moreover, λ-exo digestion of nonreplicating genomic DNA (LexoG0) enriches GC-rich DNA and G4 motifs genome-wide. We used LexoG0 data to control for nascent strand–independent λ-exo biases in NS-seq and validated this approach at the rDNA locus. The λ-exo–controlled NS-seq peaks are not GC-rich, and only 35.5% overlap with 6.8% of all G4s, suggesting that G4s are not general determinants for origin specification but may play a role for a subset. Interestingly, we observed a periodic spacing of G4 motifs and nucleosomes around the peak summits, suggesting that G4s may position nucleosomes at this subset of origins. Finally, we demonstrate that use of Na+ instead of K+ in the λ-exo digestion buffer reduced the effect of G4s on λ-exo digestion and discuss ways to increase both the sensitivity and specificity of NS-seq.
DNA replication is a highly regulated event whereby the genome is duplicated precisely once per cell cycle. In eukaryotes, nuclear DNA replication initiates at numerous origins of replication along linear chromosomes. What defines origins in metazoans remains unclear. Origins are AT-rich in bacteria and yeast (Méchali 2010; Leonard and Méchali 2013) with a few exceptions (Xu et al. 2012; Liachko et al. 2014). Similarly, many origins in metazoans have AT-rich elements (Aladjem and Fanning 2004). Thus, an attribute shared by most origins studied across the tree of life is the occurrence of AT-rich features. However, recent genome-wide studies have suggested that origins in multicellular eukaryotes may be GC-rich and correlated with motifs for G-quadruplex (G4) structures (Cayrou et al. 2011, 2012; Besnard et al. 2012; Picard et al. 2014). Intrastrand G4 structures are highly stable DNA secondary structures that can form at physiological conditions in vitro when a DNA strand has four or more adjacent poly-G tracts typically defined as being separated by loops of 1–7 nucleotides (nt) (Huppert 2010; Bochman et al. 2012).
Current insight into what defines metazoan origins suffers most from a small sample size of well-characterized origins. The search for sequence motifs, epigenetic marks, and other unifying features that specify metazoan replication origins has been ongoing for many years. Recently, several genome-wide approaches have been taken (for review, see Gilbert 2010; Urban et al. 2015) to increase the sample size of origins in an effort to finally resolve this issue. A popular method used to study metazoan origins, both genome-wide and in other applications, involves the enrichment of nascent strands by lambda exonuclease (λ-exo). λ-exo is a 5′ to 3′ DNA exonuclease that is used to deplete parental DNA, while nascent strands with 5′ RNA primers are protected (Radding 1966; Little 1967) and become effectively enriched over the depleted parental DNA background. The λ-exo enrichment technique was originally developed to map the transition point from leading to lagging strand synthesis with single-nucleotide resolution in known origins (Gerbi and Bielinsky 1997; Bielinsky and Gerbi 1998) and has since been adopted to identify origins in metazoan genomes by pairing with microarrays (NS-chip) (Cadoret et al. 2008; Sequeira-Mendes et al. 2009; Karnani et al. 2010; Cayrou et al. 2011, 2012; Valenzuela et al. 2011) and deep sequencing (NS-seq) (Martin et al. 2011; Besnard et al. 2012; Mukhopadhyay et al. 2014; Picard et al. 2014). There are a few variations of nascent strand enrichment protocols that employ λ-exo, but the heart of each multistep procedure is the λ-exo enrichment step after taking care to maintain high molecular weight DNA with RNA primers on the nascent strands.
Due to the strong association of putative origins identified in NS-seq studies with predicted G4 motifs, it was proposed that G4s might have a function at origins (Cayrou et al. 2011, 2012; Besnard et al. 2012; Picard et al. 2014; Valton et al. 2014). However, this interpretation of NS-seq data depends on the purity of the nascent strand preparation and the ability of λ-exo to efficiently digest G4 sequences in the contaminating parental DNA. Notably, single-molecule studies on λ-exo have shown that its digestion rate is dependent on base composition (Perkins et al. 2003; van Oijen et al. 2003; Conroy et al. 2010). In particular, λ-exo was shown to digest GC-rich DNA less efficiently and to pause at GC-rich motifs. Moreover, another exonuclease, Exo1, inefficiently digests G4s and is used as a diagnostic to detect G4s in vitro (Yao et al. 2007). We hypothesized that λ-exo also inefficiently digests G4 structures that form under the conditions used to prepare nascent strands, leading to significant enrichment of G4-protected DNA, which may largely explain the association of putative origins from NS-seq studies with predicted G4 motifs. Moreover, we hypothesized that the inefficiency of λ-exo digestion of GC-rich DNA is generally responsible for the recent λ-exo–based observations that metazoan origins are GC-rich. We present (1) biochemical and genome-wide evidence supporting these hypotheses, (2) a new way to control λ-exo biases in NS-seq, and (3) a potential role of G4s near a subset of origins.
Results
G-quadruplexes are resistant to λ-exo digestion
We tested the ability of λ-exo to efficiently digest G4 structures by digesting a plasmid derived from the human MYC locus (Malott and Leffak 1999) that contains a well-characterized G4 motif (Fig. 1A, see Pu27; Brooks and Hurley 2010). Another putative G4 sequence (Pu30) was identified nearby on the opposite strand (Fig. 1A), using the QGRS mapper (Kikin et al. 2006). The BglII linearized plasmid was 3′ end-labeled, kept double-stranded (dsDNA) or made single-stranded (ssDNA), and digested overnight with λ-exo at pH 9.4, the optimal pH for the enzyme (Radding 1966). After λ-exo digestion of ssDNA, two prominent bands were observed (Fig. 1B) that correspond to the predicted size of fragments resulting from Pu27 (3260 bp) and Pu30 (4591 bp), impeding λ-exo digestion. These bands were also weakly detected after λ-exo digestion of dsDNA. Digesting plasmids from which Pu27 or Pu30 had been deleted confirmed that the two major bands were the result of the inability of λ-exo to digest these G4-containing sequences (Fig. 1C, cf. lanes 3, 8, and 13). When plasmids were digested at pH 8.8 (75%–80% λ-exo activity), the Pu27 band was faint in the wild-type plasmid and disappeared when Pu27 was deleted, while the Pu30 band was absent for all constructs (Fig. 1C, cf. lanes 2, 7, and 12). These data suggest that Pu27 forms a more stable G4 than Pu30 and that both G4s are less stable at the lower pH. Consequently, λ-exo digests these G4 sequences more efficiently at pH 8.8 despite having somewhat lower enzymatic activity (Fig. 1C, cf. lanes 2, 3).
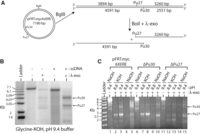
The MYC G-quadruplex (G4) impedes λ-exo digestion. (A) Diagram of the plasmid digestion experiment. The predicted sizes of single-stranded fragments resulting from the inability of λ-exo to digest through the G4 motifs are shown. (B) Digestion of 3′-labeled BglII linearized pFRT.myc6xERE in glycine-KOH (pH 9.4). Double-stranded and single-stranded DNA were used as indicated. (C) Digestion of single-stranded DNA from pFRT.myc6xERE and deletion mutants of Pu30 and Pu27 in four different buffers. The pH of the buffer and the base used to titrate the pH are indicated.
Characterizing biases in λ-exo digestion genome-wide
Genome-wide biases of λ-exo were profiled by sequencing the DNA remaining after λ-exo digestion (pH 9.4) of sonicated genomic DNA (gDNA) from nonreplicating G0 MCF7 cells (LexoG0). We mapped 115.1, 174.6, and 153.7 million reads to the human genome from three biological replicates, resulting in a pooled total of 443.4 million mapped reads (Supplemental Table S1). In addition, we sequenced undigested gDNA from nonreplicating G0 MCF7 cells (G0gDNA), which had 181.9 million mappable reads (Supplemental Table S1). We identified regions of the genome enriched by λ-exo digestion of nonreplicating DNA by calling LexoG0 peaks relative to the G0gDNA control. The LexoG0 replicates were highly reproducible, and the 196,851 peaks derived from the pooled reads significantly encompassed the replicate peak sets (Supplemental Fig. S1A; Supplemental Tables S1–S3). The LexoG0 peak set from the pooled reads is referred to as LexoG0G0gDNA (following a “treatmentcontrol” format) to distinguish it from the mappable reads prior to peak calling (LexoG0).
Nonreplicating genomic DNA digested with λ-exo (LexoG0) is enriched in GC-rich sequences and depleted for AT-rich sequences
If λ-exo uniformly digests gDNA, then the distribution of GC content over the mappable reads should be similar with and without λ-exo digestion. However, relative to undigested G0gDNA, AT-rich reads were depleted and GC-rich reads were enriched in all three LexoG0 replicates (Fig. 2A). Among the replicates, the median enrichment of GC-rich reads reached 14.2-fold and the median depletion of AT-rich reads reached 310.6-fold. These results indicate that λ-exo digests AT-rich sequences more efficiently than GC-rich sequences.
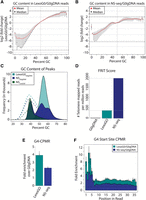
λ-exo digestion enriches GC-rich and G4-containing sequences. (A) Log2 (fold change) of the distribution of GC content in LexoG0 reads relative to that of G0gDNA reads. Over each GC%, the minimum to maximum (line segment), median (black dot), and mean (red triangle) for the replicates are shown. The dotted lines at the top and bottom represent the absolute maximum enrichment and depletion values found among the replicates. (B) Log2 (fold change) of the distribution of GC content in NS-seq reads relative to that of G0gDNA reads. Other details as in panel A. (C) GC content of peaks for LexoG0G0gDNA, NSG0gDNA, and NSLexoG0. (Dashed lines) Distribution of GC content in randomly shuffled peaks. (D) Fraction of reads in telomeres (FRiT) scores. (E) G4-CPMR fold enrichment of the NS-seq and LexoG0 replicates over G0gDNA. The median (bar height), the minimum to maximum values (vertical line), and mean (black dot) for the replicates are shown. (F) Fold enrichment of G4-start-site-CPMR over positions 1–36 in 50-bp reads. Over each position, the minimum to maximum (vertical line), median (bar height), and mean (black triangle) of the replicates are shown.
The LexoG0G0gDNA peak sequences were GC-rich with a single mode centered at 55% GC, while a mode centered at 39% GC is expected when the peaks are shuffled around the genome at random (Fig. 2C, cyan). There is a high correlation of LexoG0G0gDNA peak and CpG island densities in 1-Mb bins (Pearson's product-moment correlation coefficient, Pearson's r = 0.646; Spearman's rank-order correlation, Spearman's ρ = 0.746) (Supplemental Table S6A), and 12% of LexoG0G0gDNA peaks overlap 92% of all CpG islands (Supplemental Table S5). Strikingly, the −log10 (P-value) signal from the LexoG0G0gDNA data set mimics the periodicity of 16 CpG island repeats over a 48-kb region of Chromosome 19 (Fig. 3A). Overall, the effect of base composition on λ-exo digestion rate results in enriching GC-rich regions of the genome.
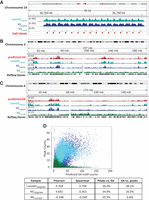
Correlation with predicted G4 motifs and CpG islands. (A) The −log10 (P-value) signal for LexoG0G0gDNA, NSG0gDNA, and NSLexoG0 for a 48-kb region on the q arm of Chromosome 19 containing a repeated array of CpG islands. (B,C) Density of G4 motifs and LexoG0G0gDNA, NSG0gDNA, and NSLexoG0 peaks on Chromosome 3 (B) and Chromosome 6 (C). (D) Scatterplot of genome-wide densities (counts in 100-kb bins) of LexoG0G0gDNA, NSG0gDNA, and NSLexoG0 peaks and predicted G4 motifs. Pearson's r and Spearman's ρ for the densities of the indicated sample and G4 motifs are displayed in the box, along with the percentage of overlap of peaks with predicted G4 motifs (peaks vs. G4) or vice versa (G4 vs. peaks) for each data set. For all panels, cyan, LexoG0G0gDNA; blue, NSG0gDNA; and green, NSLexoG0.
Nonreplicating genomic DNA digested with λ-exo is enriched with telomere repeats and G4 sequences
The G4 counts per million reads (G4-CPMR) was calculated for the LexoG0 replicates and the G0gDNA control (Fig. 2E). The G4-CPMR for the G0gDNA reads was 2343, whereas the LexoG0 replicates ranged from 8928–10,421 (3.8- to 4.5-fold enriched). Moreover, 36.9% of LexoG0G0gDNA peaks (15.5% expected at random) directly overlap with 48.5% of predicted G4 motifs (“G4s”; 8.6% expected at random) (Fig. 3D; Supplemental Table S5). The average LexoG0G0gDNA fold enrichment signal was highly correlated with G4 density in 100-kb bins (Pearson's r = 0.862, Spearman's ρ = 0.776) (Supplemental Table S6B), as were the densities of peaks and G4 motifs (Pearson's r = 0.704, Spearman's ρ = 0.704) (Fig. 3; Supplemental Table S6A), as seen in whole chromosomes (Fig. 3B,C). Additionally, G4s are increasingly enriched with proximity to LexoG0 peak summits, suggesting that G4 structures are enriched by λ-exo (Fig. 4A).
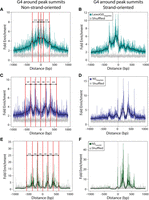
Distribution of G4 motifs around peak summits. (Left) The distributions of G4 motifs (non-strand-oriented) around LexoG0G0gDNA (A), NSG0gDNA (C), and NSLexoG0 (E) peak summits. The red lines indicate the positions of wave crests; labeled arrows, the distance between adjacent crests. (Right) The distributions of G4 motifs (strand oriented 5′-3′ left to right) around LexoG0G0gDNA (B), NSG0gDNA (D), and NSLexoG0 (F) peak summits.
To discount the possibility that G4 motifs were enriched simply due to the GC-rich nature of DNA after λ-exo digestion, we performed the following analyses. Human telomeres are composed of a repeat sequence (TTAGGG) that strongly favors formation of G4 structures in vitro (Huppert 2010). The number of mappable reads per million reads that remapped to a 6-kb telomere repeat sequence, the fraction of reads in telomeres (FRiT), was calculated. Undigested G0gDNA contained relatively few telomere reads, with a FRiT score of 30.62 (Fig. 2D). Conversely, the LexoG0 FRiT score of 375.67 was over 12-fold higher (Fig. 2D). This large enrichment cannot be explained by the telomeric GC content of 50%, which is associated with a near neutral λ-exo enrichment (Fig. 2A), leaving the propensity of telomeres to fold into G4 structures in vitro as a likely contributor to this effect.
In the LexoG0 preparation, the distribution of 5′ DNA ends initially corresponds to where 5′ to 3′ λ-exo digestion stopped. Subsequently, after fragmentation for library construction, there is a mixture of λ-exo–digested 5′ ends, as well as 5′ ends from breaks. Since fragment ends are sequenced from 5′ to 3′, this mixture is directly reflected in the Illumina read sequences. In the undigested G0gDNA control, the 5′ end sequences correspond only to breaks from fragmentation. If λ-exo is impeded by G4 structures during digestion, then it would be detectable as an enrichment of G4 motif start sites concentrated at the 5′ end of LexoG0 reads compared with undigested G0gDNA reads. Thus, we calculated the G4-start-site counts per million reads (G4-start-site-CPMR) over each position from 1 to 36, where position 36 is the last position in a 50-bp read that a G4 motif (G3+N1-7G3+N1-7G3+N1-7G3+) (Huppert and Balasubramanian 2005) can start. Relative to the G0gDNA control, the first 5 bp of the read profiles in all three LexoG0 replicates are much more enriched in G4 start sites than the remaining 3′ end, which exhibits a uniform enrichment pattern (Fig. 2F).
Since λ-exo is a 5′ to 3′ directed exonuclease and digested fragments of 500–1500 bp were size-selected, the following would hold true if G4 structures impede λ-exo: (1) G4-protected DNA would extend 500–1500 bp 3′ to the G4-protected 5′ end; (2) the highest sequencing coverage would be within the first 500 bp 3′ of the genomic location of each protective G4; and (3) G4 motifs would be enriched within 500 bp 5′ of peak summits in an aggregate analysis of all λ-exo–enriched peaks. To test this, LexoG0G0gDNA peaks were aligned by their summits, and the distribution of predicted G4 motifs around the summits was plotted while preserving the strand information of whether a G4 motif was 5′ or 3′ to the peak summit. Figure 4B shows that G4s mapped preferentially within 500 bp 5′ to LexoG0G0gDNA peak summits compared with randomly shuffled G4 motifs. Taken together, the results of the plasmid experiments, the enrichment of telomere repeats in LexoG0 reads, the enrichment of G4s at the 5′ ends of LexoG0 reads, and the enrichment of G4s 5′ to LexoG0G0gDNA peak summits strongly support the conclusion that λ-exo is impeded by G4 structures in vitro, in addition to inefficiently digesting GC-rich DNA.
Regions of the genome enriched by λ-exo in replicating DNA (NS-seq) are many of the same regions enriched in nonreplicating DNA but also include a distinct set of AT-rich regions
Three biological replicates of NS-seq were prepared from replicating MCF7 cells. BND cellulose-enriched replicative intermediate DNA was λ-exo–digested at pH 8.8 to ensure the preservation of RNA primers (Li and Breaker 1999) and to decrease the stability of G4s (Fig. 1). Peaks were called relative to the undigested G0gDNA control. The replicates were highly reproducible and the 162,098 peaks obtained by using the pooled set of reads (Supplemental Table S1) were highly representative of the three replicates as measured by correlation and overlap (Supplemental Tables S2, S4). Thus, the peak set from pooled reads (named NSG0gDNA to distinguish it from the NS-seq reads) was used for subsequent analyses. Although more than half of the peaks were unique to NSG0gDNA, a substantial subset (47%) (Supplemental Table S5) overlapped with LexoG0G0gDNA peaks, indicating that a large proportion may arise from nascent strand–independent λ-exo enrichment.
Characteristics of the NS-seq data that distinguish it from the LexoG0 data could be attributed to the presence of λ-exo–resistant DNA unique to the replicating cell population such as RNA-protected nascent strands. AT-rich reads were depleted and GC-rich reads were enriched in NS-seq compared to undigested G0gDNA, but each to a lesser extent than in LexoG0 reads (Fig. 2B). The GC content of the NSG0gDNA peaks (Fig. 2C, blue) displayed a bimodal distribution with one GC-rich mode (∼53%–60% GC), similar to LexoG0G0gDNA peaks, and one AT-rich mode (∼40% GC) not present in LexoG0G0gDNA peaks. Given the strong depletion of AT-rich reads after λ-exo digestion in both LexoG0 and NS-seq (Fig. 2A,B), it was surprising to find λ-exo–enriched AT-rich peaks in NSG0gDNA, indicating that λ-exo–resistant DNA emanates from a subset of AT-rich regions in the genome only in the replicating cell population, consistent with the behavior of RNA-protected nascent strands.
There is a moderate to high correlation between NSG0gDNA peak and CpG island densities (1-Mb bins; Pearson's r = 0.802, Spearman's ρ = 0.490) (Supplemental Table S6A) and the NSG0gDNA profile mimics the CpG island repeats on Chromosome 19 (Fig. 3A). Direct overlap analysis showed enrichment of CpG islands with 8.3% of NSG0gDNA peaks (2.0% expected at random) overlapping 44.2% of all CpG islands (11.2% expected at random) (Supplemental Table S5). In addition, there was a moderate correlation between average NSG0gDNA fold enrichment and G4 density (100 kb bins, Pearson's r = 0.692, Spearman's ρ = 0.564) (Supplemental Table S6B) as well as between NSG0gDNA peak and G4 densities (100 kb bins, Pearson's r = 0.692, Spearman's ρ = 0.363) (Fig. 3B–D; Supplemental Table S6A). 34.9% of NSG0gDNA peaks (15.6% expected at random) overlapped with 26.0% of G4 motifs (7.0% expected at random) (Fig. 3D; Supplemental Table S5).
NS-seq reads were highly enriched for telomere repeat sequences with a FRiT score of 1924.85 (Fig. 2D), over 63-fold higher than the undigested G0gDNA FRiT and about fivefold higher than LexoG0. This additional enrichment is G4 independent as the G4-CPMR for NS-seq reads is depleted relative to LexoG0 (Fig. 2E) and may be due to the enrichment of nascent DNA from origins in telomeres (Drosopoulos et al. 2012 and references therein). G4 motifs were enriched in NS-seq reads compared with G0gDNA both in G4-CPMR (Fig. 2E) and in G4-start-site-CPMR (Fig. 2F) but were less enriched than in LexoG0 reads. Similarly, G4s were enriched within 500 bp 5′ to NSG0gDNA peak summits when oriented by strand, but less so than near LexoG0G0gDNA summits (Fig. 4, cf. D and B). Interestingly, G4 motifs were enriched 3′ of the NSG0gDNA peak summits (Fig. 4D). Mapping the G4s without correcting for strandedness revealed a periodicity of 171–224 bp both upstream of and downstream from NSG0gDNA peak summits (Fig. 4C). These results support the conclusion that NS-seq enriches genomic regions that result from both nascent strands and nascent strand–independent biases of λ-exo digestion.
Controlling λ-exo biases increases the specificity of NS-seq
Due to the inability of λ-exo to uniformly digest DNA, NSG0gDNA peaks are of three types: (1) peaks resulting solely from nascent strands (true positives), (2) peaks resulting solely from nascent strand–independent λ-exo biases (systematic false positives), and (3) peaks resulting from some combination of both (true positives within λ-exo–biased regions). To deal with peak type 2, one could simply discard all the NSG0gDNA peaks that overlap LexoG0G0gDNA peaks to obtain a higher fidelity but incomplete set of origins due to the elimination of true positives in λ-exo–biased regions (peak type 3). A better approach would be to call nascent strand enrichments relative to a λ-exo–digested gDNA background, such as LexoG0, to account for nascent strand–independent λ-exo biases. Ideally, this approach controls against peak type 2 regions, because these regions are similarly enriched in both NS-seq and LexoG0, while not eliminating peak type 3 regions due to the additional nascent strand signal enriched over the LexoG0 background.
We tested this approach first on the human rDNA sequence, where the origin locations are known to be within the intergenic spacer (Supplemental Fig. S2A; Supplemental Table S9). Figure 5A shows the signal per million reads (SPMR) over the rDNA for G0gDNA (black), LexoG0 (cyan), and NS-seq (blue), demonstrating that the G0gDNA background does not adequately represent all biases present in NS-seq. The G0gDNA SPMR is lower in magnitude compared with both the LexoG0 and NS-seq SPMRs, which both similarly respond to the presence of G4s (red and blue dots) and GC-richness (red line). The NS-seq SPMR closely tracks the LexoG0 SPMR due to the λ-exo–enriched parental DNA background but rises above the LexoG0 SPMR only in the intergenic spacer. Figure 5B plots the NS-seq fold enrichment across the rDNA locus over the two different controls (NS/G0gDNA, blue-gray; NS/LexoG0, green). The entire locus is enriched when G0gDNA is used as the control, but when LexoG0 is used, only regions in the intergenic spacer are enriched greater than onefold, and the only enrichments greater than twofold correspond to known origin sites mapped by λ-exo–independent techniques (Supplemental Fig. S2A). Thus, analyzing NS-seq data relative to LexoG0 rather than G0gDNA increases the specificity of NS-seq. We then applied this approach genome-wide.
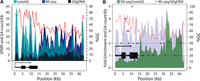
Controlling for λ-exo biases in NS-seq. (A) The signal per million reads (SPMR) is shown for G0gDNA (black), LexoG0 (cyan), and NS-seq (blue) reads mapped to the ribosomal DNA (rDNA) sequence. The cyan and black are slightly transparent to allow visualization of the signals behind them. The lighter cyan is the LexoG0 signal alone, while the darker cyan indicates where the LexoG0 signal overlaps the blue NS-seq signal behind it. Non-zero G4 counts in 1-kb bins across the rDNA locus are shown for the plus strand (blue dots) and the minus strand (red dots). The percentage of GC across the locus is indicated by the red line. The rRNA transcription unit is shown below. (B) The NS-seq SPMR fold enrichment over G0gDNA (light blue-gray) or LexoG0 (green) controls. The rRNA transcription unit is shown (black). G4 counts in 1-kb bins and percentage of GC are displayed as in A. Dashed lines indicate onefold and twofold enrichment levels.
Genomic regions that are significantly enriched by λ-exo in replicating DNA compared with λ-exo–digested nonreplicating DNA, hereafter referred to as NSLexoG0 peaks, were identified by setting the pooled NS-seq reads as the treatment and the pooled LexoG0 reads as the control. There were 66,831 NSLexoG0 peaks (Supplemental Table S1), 93.3% of which overlapped NSG0gDNA peaks (Supplemental Table S5). That NSLexoG0 is almost entirely a subset of NSG0gDNA reflects the increased specificity seen in the rDNA analysis. The GC content in the NSLexoG0 peaks displayed a single AT-rich mode (∼40% GC) in contrast to the two modes seen in NSG0gDNA (Fig. 2C). In general, AT-rich reads were enriched and GC-rich reads were depleted in NS-seq relative to LexoG0 (Supplemental Fig. S2B). The NSLexoG0 and LexoG0G0gDNA fold enrichment signals were weakly correlated with each other (Pearson's r = 0.171) (Supplemental Table S2), demonstrating that most of the correlation with nascent strand–independent λ-exo biases was broken as intended. Nonetheless, 20.2% of the NSLexoG0 peaks overlapped LexoG0G0gDNA peaks (Supplemental Table S5), showing that using LexoG0 as the control gives higher sensitivity to detect origins in regions that overlap with λ-exo biases (peak type 3) than simply removing all NSG0gDNA peaks that overlap LexoG0G0gDNA peaks. This is also demonstrated at the well-characterized MYC locus (Supplemental Fig. S2C).
Genome-wide, NSLexoG0 peak density in 1-Mb bins had a weak, negative correlation with CpG islands (Pearson's r = −0.364; Spearman's ρ = −0.472) (Supplemental Table S6A), and the NSLexoG0 −log10 (P-value) profile did not mimic the periodicity of 16 CpG islands on Chromosome 19 (Fig. 3A, green). Similarly, as visualized at the chromosomal level (Fig. 3B,C), the positive correlation with G4 motifs found when not controlling for λ-exo biases (NSG0gDNA) was broken when accounting for them in NSLexoG0, where correlations of G4 motif density with NSLexoG0 peak density (Pearson's r = −0.248, Spearman's ρ = −0.260) (Fig. 3D; Supplemental Table S6A) and with NSLexoG0 average fold enrichment (Pearson's r = −0.124, Spearman's ρ = −0.004) (Supplemental Table S6B) in 100-kb bins were weakly negative. Nonetheless, although the majority of NSLexoG0 peaks did not overlap with G4 motifs, 35.5% did overlap (20.7% expected at random) (Fig. 3; Supplemental Table S5) with 6.8% of total G4 motifs (3.8% expected at random) (Supplemental Table S5). However, G4 motifs were no longer enriched 5′ to the peak summits when oriented by strand (Fig. 4F), and the fold enrichment of G4s mapping 3′ to NSLexoG0 peak summits increased (Fig. 4D). When not strand-oriented, the wave-like G4 fold enrichment signal around NSLexoG0 summits displayed similar periodicity (185–210 bp) as that seen for NSG0gDNA.
Phasing of nucleosomes and G4 motifs around the G4-proximal subset of NS-seq peak summits is enhanced after controlling for λ-exo biases
Both NSG0gDNA and NSLexoG0 have wave-like G4 enrichment signals around their aligned peak summits (Fig. 4C,E), but the wave crests appear more prominent and phased in NSLexoG0. To quantify this, we defined the “prominence” as the difference between the mean fold enrichments of the crests and troughs (prominence = crestmean-troughmean) and used the crest-to-trough ratio (CTR = crestmean/troughmean) as a measure of how phased (or concentrated at the crests) the signal was. While the prominence of the crests around NSLexoG0 summits was 3.12 (Supplemental Fig. S3A), it was only 0.95 for NSG0gDNA (Supplemental Fig. S3B). Similarly, the CTR for NSLexoG0 (4.09) was higher than that for NSG0gDNA (1.35). The lower prominence and phasing of G4 motif enrichment around NSG0gDNA summits may be due to a higher incidence of systematic false positives from nascent strand–independent λ-exo biases, which add a noisy, non-wave-like enrichment pattern that dampens the crest-to-trough ratio. Partitioning NSG0gDNA summits into those that are and are not represented in NSLexoG0 decomposed the signal into a stronger wave-like component (Supplemental Fig. S3C) and a roughly uniform component, respectively (Supplemental Fig. S3D). The prominence (5.4) and CTR (3.69) for the subset of NSG0gDNA summits found in NSLexoG0 both rose (Supplemental Fig. S3C) and dropped (0.39 and 1.15, respectively) for the NSG0gDNA summits not represented in NSLexoG0 (Supplemental Fig. S3D). This analysis is consistent with the conclusions that the NSG0gDNA summits not represented in NSLexoG0 are largely a product of nascent strand–independent λ-exo enrichments, that G4s in the vicinity of true nascent strand enrichments are nonrandomly located with respect to peak summits forming prominently phased waves when viewed in aggregate, and that controlling for λ-exo biases increases the specificity of NS-seq.
The periodicity of G4 motif enrichment around NSG0gDNA and NSLexoG0 peak summits was highly reminiscent of nucleosome spacing. In contrast, the enrichment of G4s around LexoG0G0gDNA peaks (Fig. 4A) appeared to be a function of proximity, with most G4s occurring near the peak summits, though with traces of nucleosomal periodicity. To test whether G4s had a relationship with nucleosomes, the nucleosome signal from K562 and GM12878 cells (Kundaje et al. 2012) was plotted around the subsets of the LexoG0G0gDNA, NSG0gDNA, and NSLexoG0 peak summits that contained one or more G4s within 1 kb (46.1%, 43.7%, and 34.8%, respectively) (Fig. 6; Supplemental Fig. S4A–C; Supplemental Table S7). Importantly, 91.6% of the G4-proximal peak summits in NSLexoG0 had only a single G4 within 1 kb (Supplemental Table S7). The G4-proximal summits in each data set were in regions of the genome with average and lower-than-average nucleosome enrichment. Nonetheless, the summits were flanked by nucleosomes, from which the nucleosome signal spread out in a wave-like fashion with crest-to-crest distances typical of nucleosome spacing. The wave-like characteristic was most pronounced around NSLexoG0 summits (Fig. 6C). As determined by the lowest “divergence” (sum of squared deviations from the mean signal) and highest correlation of K562 and GM12878 cell line signals, nucleosome positioning was most consistent around NSLexoG0 summits (divergence = 1.44; Pearson's r = 0.95; Spearman's ρ = 0.97) (Supplemental Table S8) compared with LexoG0G0gDNA (divergence = 28.87; Pearson's r = 0.19; Spearman's ρ = 0.34) (Supplemental Table S8) and NSG0gDNA (divergence = 17.95; Pearson's r = 0.31; Spearman's ρ = 0.36) (Supplemental Table S8). Moreover, partitioning the NSG0gDNA summits into those that are and are not represented in NSLexoG0 decomposed the nucleosome signal around the NSG0gDNA summits into a stronger wave-like component with more consistent nucleosome positioning (divergence = 1.43; Pearson's r = 0.91; Spearman's ρ = 0.93) (Supplemental Fig. S4D; Supplemental Table S8) and a component that looked similar to and shared a nearly identical divergence (28.85) (Supplemental Fig. S4E; Supplemental Table S8) with the nucleosome signal around the LexoG0G0gDNA summits. Overall, controlling for nascent strand–independent λ-exo biases eliminates a significant noise component in the nucleosome signal. Interestingly, plotting the distribution of both G4s and nucleosomes together revealed that G4 enrichment crests (Fig. 6, gray lines; Supplemental Fig. S4A–C) were offset relative to nucleosome crests in all three data sets, raising the possibility that a role of G4s near the G4-proximal subset of origins is in nucleosome positioning.
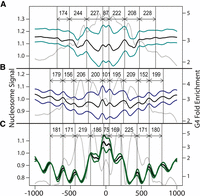
Distribution of nucleosomes around peak summits. In each panel, the nucleosome signal was plotted around the peak summits for (A) LexoG0G0gDNA, (B) NSG0gDNA, and (C) NSLexoG0. The colored lines show the nucleosome signal for K562 and GM12878 cells (Kundaje et al. 2012). The black line is the mean of the two cell lines. The vertical lines indicate the crest positions of the wave-like nucleosome signal, and the labeled arrows indicate the intercrest distances. The gray lines show the distribution of non-strand-oriented G4 motifs (log-transformed versions of Fig. 4A,C,E, respectively).
Limiting the effects of G-quadruplexes in λ-exo digestions by destabilization in glycine-NaOH buffer
The traditional λ-exo buffer, used initially by Radding (1966) and in the nascent strand experiments reported to date (including our own) contains 67 mM glycine that is titrated to the desired pH with KOH (glycine-KOH). G4 structures are most stable in the presence of K+ but are much less so in the presence of Na+ (Kankia and Marky 2001; Shim et al. 2009), suggesting that λ-exo digestion may be impeded less in buffers containing Na+ rather than K+. In MYC plasmid digestion experiments, titration of KCl (pH 8.8) resulted in stronger bands, suggesting higher stability of G4s (Supplemental Fig. S5), while NaCl titration had no effect (Supplemental Fig. S5). Therefore, NaOH was substituted for KOH to titrate the desired pH of the reaction buffer (glycine-NaOH). The MYC plasmid was more efficiently digested in glycine-NaOH than in glycine-KOH (Fig. 1C) at both pH 8.8 (complete digestion) and pH 9.4 (partial digestion). In both glycine-NaOH and glycine-KOH, the G4s posed a greater obstacle to λ-exo digestion at the higher pH, which can be explained by their higher stability with increased concentration of monovalent cations (0.65 mM at pH 8.8 and 1.95 mM at pH 9.4).
Discussion
NS-seq is a method to map origins genome-wide that employs λ-exo to enrich nascent strands, which are protected from digestion by the RNA primer at their 5′ end. However, we show here that λ-exo does not digest the parental DNA background uniformly. We report that λ-exo more efficiently digests AT-rich DNA than GC-rich DNA, extending genome-wide the observations of single-molecule studies (Perkins et al. 2003; van Oijen et al. 2003; Conroy et al. 2010), which results in enrichments of GC-rich regions of the genome. Moreover, we show that λ-exo digestion is obstructed when it encounters G4s. Therefore, λ-exo–enriched DNA in NS-seq will contain not only RNA-protected nascent strands but also GC-rich and G4-protected DNA, which is problematic when attempting genome-wide origin discovery. This problem may also explain the apparent discrepancy between a landmark Okazaki fragment sequencing study (Smith and Whitehouse 2012) and a more recent study that used a λ-exo–based approach (Yang and Li 2013) for enriching Okazaki fragments for sequencing.
One way to account for nascent strand–independent λ-exo biases in NS-seq is to use λ-exo–digested DNA from nonreplicating cells (LexoG0) as a control. Our analysis on the rDNA locus shows that this approach increases the specificity of NS-seq. Another indication of increased specificity is that the wave-like pattern of G4 enrichment around the NSLexoG0 summits is more pronounced and phased than around the summits of NSG0gDNA and LexoG0G0gDNA. Similarly, the phased nucleosomal signal around NSLexoG0 summits is more pronounced and consistently positioned across cell lines, showing that controlling λ-exo biases improves this recognizable biological signature that is also seen at yeast origins (Lipford and Bell 2001; Eaton et al. 2010). Nucleosome phasing around tens of thousands of sites in the genome is extremely unlikely to occur at random. Moreover, using the LexoG0 control in NS-seq has the advantage of higher sensitivity to true positives in strongly λ-exo–biased regions than the alternative procedure of eliminating all NSG0gDNA peaks that overlap LexoG0G0gDNA peaks. Genome-wide, 20.2% of NSLexoG0 peaks overlap LexoG0G0gDNA peaks. Nonetheless, the NSLexoG0 approach used here may not be fully sensitive to weak origins in strongly λ-exo–biased regions due to the difference in pH between LexoG0 and NS-seq. This may explain the lack of CpG island overlap in NSLexoG0 despite previous evidence from λ-exo–independent techniques that some origins occur near CpG islands (Delgado et al. 1998 and references therein). Moreover, we cannot exclude the possibility that digestion of replicating DNA at pH 8.8 introduces other biases that are not accounted for by the LexoG0 control digested at the higher pH. However, the results at the rDNA locus suggest that our approach is both sensitive and specific. Moving forward, important advances for NS-seq will be to (1) optimize λ-exo digestion conditions in the presence of Na+ instead of K+ and (2) utilize pH 8.8 for both the NS-seq sample and the LexoG0 control, both of which destabilize G4 structures, thereby minimizing the problem of G4s impeding λ-exo digestion.
In light of the biases inherent in λ-exo digestion, recent reports suggesting that G4s are hallmarks of mammalian replication origins may have had inflated estimates of the association of G4 motifs and origins: 73.9% of putative mouse origins localized with G4s (Cayrou et al. 2012), and 67% and 91.4% of putative human origins overlapped with G4 sequences with loops of 1–7 and 1–15 nt, respectively (Besnard et al. 2012). These estimates may be inflated by the presence of nascent strand–independent λ-exo enrichments and by preferentially enriching origins in λ-exo–biased regions. It is possible that the higher enzyme-to-DNA ratio used in previous studies lessened the impact of nascent strand–independent λ-exo biases, but it is striking that similar regions of the genome were enriched in those data sets as in our LexoG0 peaks (e.g., CpG islands, G4s, and GC-rich DNA). Furthermore, our plasmid experiments demonstrate that λ-exo digestion of G4 structures is more efficient at pH 8.8 than at pH 9.4 (the pH used in some previous studies; Cayrou et al. 2011), which suggests that the higher pH may require higher enzyme-to-DNA ratios to achieve the same efficiency of G4 digestion. Indeed, even before controlling for λ-exo biases, our NSG0gDNA peak set (pH 8.8) is not as strongly correlated with G4s as peak sets of previous studies (Cayrou et al. 2012) that used pH 9.4. Moreover, in our 3′ labeled plasmid experiments, we used a high ratio of 50 units of λ-exo per microgram of DNA. Still, we saw that G4s are stabilized and not efficiently digested at pH 9.4. There is also a concern that too high an enzyme-to-DNA ratio may sacrifice some of the enzyme's specificity against RNA digestion (Yang and Li 2013). Finally, the prediction that G4s should be enriched 5′ of peak summits after λ-exo digestion was borne out in our studies and those of others (Cayrou et al. 2012). This prediction also gives rise to an alternate interpretation of the observation that when a G4 is experimentally inverted to shift it from one strand to the other, the region attributed to have origin activity (after λ-exo enrichment) also shifted so that it remained 3′ to the G4 that had been moved (Valton et al. 2014), although an alternate interpretation is presented by the authors. Moreover, the 5′ G4-start-site-CPMR enrichment in LexoG0 and NS-seq reads is diagnostic of the inability of λ-exo to digest G4-protected DNA, and one would not expect nascent strands alone to produce this effect.
Though G4s are correlated with NS-seq peaks when controlling with undigested G0gDNA (NSG0gDNA), the positive correlation is broken when controlling for nascent strand–independent λ-exo biases (NSLexoG0). Only 6.8% of G4s with loops of 1–7 nt in the genome overlapped with NSLexoG0 peaks, suggesting that the vast majority of G4 motifs are not general determinants of the location of origins of replication. Similarly, it has recently been reported that only one out of seven G4s in the human genome are associated with BrdU NS peaks (Mukhopadhyay et al. 2014) and that only ∼5.2% of G4 motifs are associated with nascent strand peaks from a new λ-exo–independent method called “nascent strand capture and release” (NSCR) (Kunnev et al. 2015). Therefore, G4s do not appear to be sufficient for origin specification as most G4 motifs are not associated with origin activity. Moreover, most of our NS-seq peaks are not near G4 motifs, suggesting that G4s are not necessary for specification of all origins. Likewise, <6% of NSCR peaks had an orientation-specific relationship with G4s (Kunnev et al. 2015), and using the orthogonal origin mapping technique of bubble-seq, Mesner et al. (2013) found that the majority of bubble-containing fragments lacked G4 motifs. In regions of discordance between bubble-containing DNA and NS-seq peaks mapped by Besnard et al. (2012), G4 motifs are enriched in the NS-seq peaks but are relatively depleted in bubble-containing fragments. Mesner et al. (2013) concluded that the discordance in mapping replication origins may reflect methodological problems, such as G4s impeding λ-exo activity. Our data support this hypothesis.
Despite the lack of a general correlation with G4s, a subset of the NSLexoG0 peaks overlapped with G4 motifs. What might be the role, if any, of G4s at this subset of origins? G4s are enriched in promoters (Huppert 2010) and may play a role in transcriptional regulation. Since replication origins are often found in gene promoters and ORC is preferentially found in nucleosome-free regions (MacAlpine et al. 2010), it remains to be seen if G4s play an active role in the initiation of DNA replication, or if it is simply a correlation with the potential role of G4s in transcription. Mutagenesis studies (Valton et al. 2014) will have to discern if early activation of origins in S phase is just a secondary effect of G4s influencing transcription and opening chromatin structure. ORC preferentially binds to G4s in single-stranded DNA and RNA in vitro (Hoshina et al. 2013), suggesting that ORC might bind G4s in vivo. However, G4 binding of ORC was based on gel shift competition and was comparable to AT-rich dsDNA as a competitor. ORC has also been shown to preferentially bind negatively supercoiled DNA (Remus et al. 2004). Therefore, ORC may bind DNA with any of these characteristics in vivo.
Intriguingly, we found that in the subset of origins associated with G4s, the G4s were positioned in a phased manner reminiscent of nucleosome spacing. Moreover, nucleosomes are phased around the NSLexoG0 peak summits that have G4s within 1 kb, exhibiting crests of nucleosome enrichment that are offset from the crests of G4 enrichment. G4s and G-rich sequences have been suggested to be nucleosome exclusion signals in budding yeast, Caenorhabditis elegans, and human cells (Iyer and Struhl 1995; Halder et al. 2009; Wong and Huppert 2009) and shown to be enriched in long nucleosome-free regions (Schwarzbauer et al. 2012). Furthermore, G4s are predicted to form more easily in nucleosome-free regions (Hershman et al. 2008), and G4s associated with origins are in open chromatin as detected by DNase I hypersensitivity (Mukhopadhyay et al. 2014). Similarly, origins of replication preferentially localize to nucleosome-free regions in yeast (Simpson 1990; Lipford and Bell 2001; Berbenetz et al. 2010; Eaton et al. 2010), and ORC localizes to nucleosome-free regions in Drosophila (MacAlpine et al. 2010). In budding yeast, the ARS sequence establishes a nucleosome-free region, where ORC binds and then positions the flanking nucleosomes (Lipford and Bell 2001; Eaton et al. 2010). Given these findings, G4s may influence the positioning of nucleosomes flanking one-third of human replication origins, thus taking on some of the role played solely by ORC in budding yeast. Alternatively, as G4s are nucleosome exclusion signals, they may establish nucleosome-free regions that are then bound by ORC, which in turn positions the nucleosomes as seen in yeast. Overall, the role of G4s near a subset of metazoan origins may be involved in nucleosome positioning that results in consistently available sites for opportunistic ORC binding, giving rise to apparent specificity in origin localization.
Methods
Plasmid experiments
The plasmid pFRT.myc6xERE contains a 2.4-kb fragment from the human MYC promoter (Malott and Leffak 1999) that carries two sequences shown to form G4s: Pu27 (Brooks and Hurley 2010) and Pu30. Plasmids were linearized with BglII (New England Biolabs [NEB]), 3′ end-labeled with terminal transferase (NEB) and α32P-CTP, and made single-stranded (if needed) by boiling and transferring to ice. Labeled plasmids (200 ng) were digested overnight with 10 units of λ-exo (Fermentas) in λ-exo buffer (glycine-KOH at pH 9.4, 2.5 mM MgCl2, 50 µg/mL bovine serum albumin). Unlabeled plasmid (700 ng) was digested with 20 units of λ-exo in the glycine-KOH or glycine-NaOH buffer indicated. Deletion mutants were constructed with the Q5 site-directed mutagenesis kit (NEB) following the manufacturer's directions. For more details on the plasmid experiments, see Supplemental Methods.
Cell culture
MCF7 breast cancer cells were obtained from ATCC and grown in Dulbecco's modified eagle medium with 10% fetal calf serum supplemented with 100 U/mL penicillin and 100 μg/mL streptomycin. For NS-seq, asynchronous cultures were grown to 70%–80% confluency. For G0gDNA and LexoG0, cells were synchronized in G0 by plating at 50% confluency and serum-starving for 24 h. The proportion of cells in S phase was determined by FACS analysis (BD FACSCalibur).
LexoG0 and NS-seq library construction and sequencing
gDNA was harvested from serum-starved (LexoG0) or asynchronous (NS-seq) MCF7 cells using DNAzol (Invitrogen). One hundred fifty micrograms of LexoG0 gDNA (9.6% S phase) was lightly sonicated to a size range of 200 bp to 10 kb, made single-stranded, phosphorylated at the 5′ ends with T4 polynucleotide kinase (NEB), and then digested with 100 units of λ-exo in glycine-KOH (pH 9.4) buffer. For NS-seq, nascent strands were prepared from 150 μg of asynchronous gDNA (35%–40% S phase) following the protocol of Bielinsky and Gerbi (1998). Replicative intermediate DNA was enriched with BND-cellulose (Sigma), made single-stranded, phosphorylated, and then digested with 100 units of λ-exo in glycine-KOH pH 8.8 buffer. After λ-exo digestion for both LexoG0 and NS-seq, 500– to 1500-nt fragments were purified from ultrapure LMP agarose (Invitrogen), made double-stranded with random hexamers and Klenow (NEB), and sonicated to a size range of 100–600 bp. The G0gDNA control was prepared by sonicating gDNA from serum-starved MCF7 cells (6.8% S phase) to a size range of 100–600 bp. For all the samples described above, Illumina libraries were prepared using the NEBNext kit (NEB) following the manufacturer's directions, and library fragments of 200–500 bp were purified from 2% NuSieve agarose (Lonza) gels. All libraries were sequenced on the Illumina HiSeq platform. For more details on nascent strand preparation and library construction, see Supplemental Methods.
Analyses of reads and peaks
For each data set, reads were mapped with Bowtie 2 (Langmead and Salzberg 2012) to hg19. Peaks were called with MACS2 (Zhang et al. 2008) with “--nomodel” specified and using one data set as the treatment and the other as a control following the TreatmentControl format. Peak and peak summit coordinates were obtained from MACS2 output files. MACS2 was used to generate bedGraphs of fold enrichment and −log10 (P-value) signals for visualization in the integrative genomics viewer (IGV) (Thorvaldsdóttir et al. 2013). Overlap analyses were performed with BEDTools (Quinlan and Hall 2010), and significance was calculated using a binomial model in R (R Core Team 2013). BEDTools was used to calculate the “percent GC” inside peak coordinates. GC content in mappable reads was obtained using Python and then analyzed and visualized in R. FRiT scores were calculated by counting the number of mappable reads per million reads that remapped to the human telomere sequence. G4-CPMR was obtained by counting the G4 motifs in reads per million reads, and G4-start-site-CPMR was obtained by counting where the motifs started in the reads. For rDNA analyses, reads were mapped to a version of hg19 that contained an rDNA repeat as an extra “chromosome.” SPMR was calculated by counting the number of reads per million reads over each base with BEDTools. BEDTools was used to partition the genome into specified bin sizes (e.g., 100 kb) and to count the number of features inside each bin. G4 motifs were identified by implementing the quadparser approach in Python. CpG islands were downloaded from the UCSC Table Browser (Karolchik et al. 2004). Counts and/or mean values of various features inside identical bins were used in correlation tests and for visualization in IGV. Pearson product-moment and Spearman's rank correlation coefficients were calculated in R. Scatterplots of bin counts were made in R. G4 counts around peak summits were obtained with the help of BEDTools; correcting for the strand-specificity of the G4 motif, as well as visualization, was done in R. Nucleosome signals around peak summits were obtained with the help of BEDTools and visualized in R. Genomic features, such as peak coordinates, were shuffled around the genome using BEDTools. For more detailed descriptions of the bioinformatics analyses, see Supplemental Methods.
Data access
The raw sequencing reads for NS-seq, LexoG0, and G0gDNA have been submitted to the NCBI Sequence Read Archive (SRA; http://www.ncbi.nlm.nih.gov/sra) under accession number SRP045284.
Acknowledgments
Illumina DNA sequencing was performed at the Brown University Genomics Core Facility supported by NIH COBRE grant P30GM103410, and we thank Christoph Schorl for support. We thank the Center for Computation and Visualization for access to computational resources and Lingsheng Dong and Mark Howison for resource support. We thank Alex Brodsky for use of tissue culture facilities and Ben Raphael for helpful discussions. We received support from DOD W81XWH-10-1-0463 research grant to S.A.G., postdoctoral fellowship DOD W81XWH-11-1-0599 to C.C., and predoctoral fellowships from NSF GRFP (DGE-1058262), NSF EPSCoR (1004057), and NIH predoctoral traineeship (5-T32-GM 07601) to J.U. This paper is dedicated to Ellen Fanning (1946–2013), who contributed so much to the field of DNA replication.
Footnotes
-
[Supplemental material is available for this article.]
-
Article published online before print. Article, supplemental material, and publication date are at http://www.genome.org/cgi/doi/10.1101/gr.183848.114.
- Received September 1, 2014.
- Accepted February 18, 2015.
This article is distributed exclusively by Cold Spring Harbor Laboratory Press for the first six months after the full-issue publication date (see http://genome.cshlp.org/site/misc/terms.xhtml). After six months, it is available under a Creative Commons License (Attribution-NonCommercial 4.0 International), as described at http://creativecommons.org/licenses/by-nc/4.0/.


