
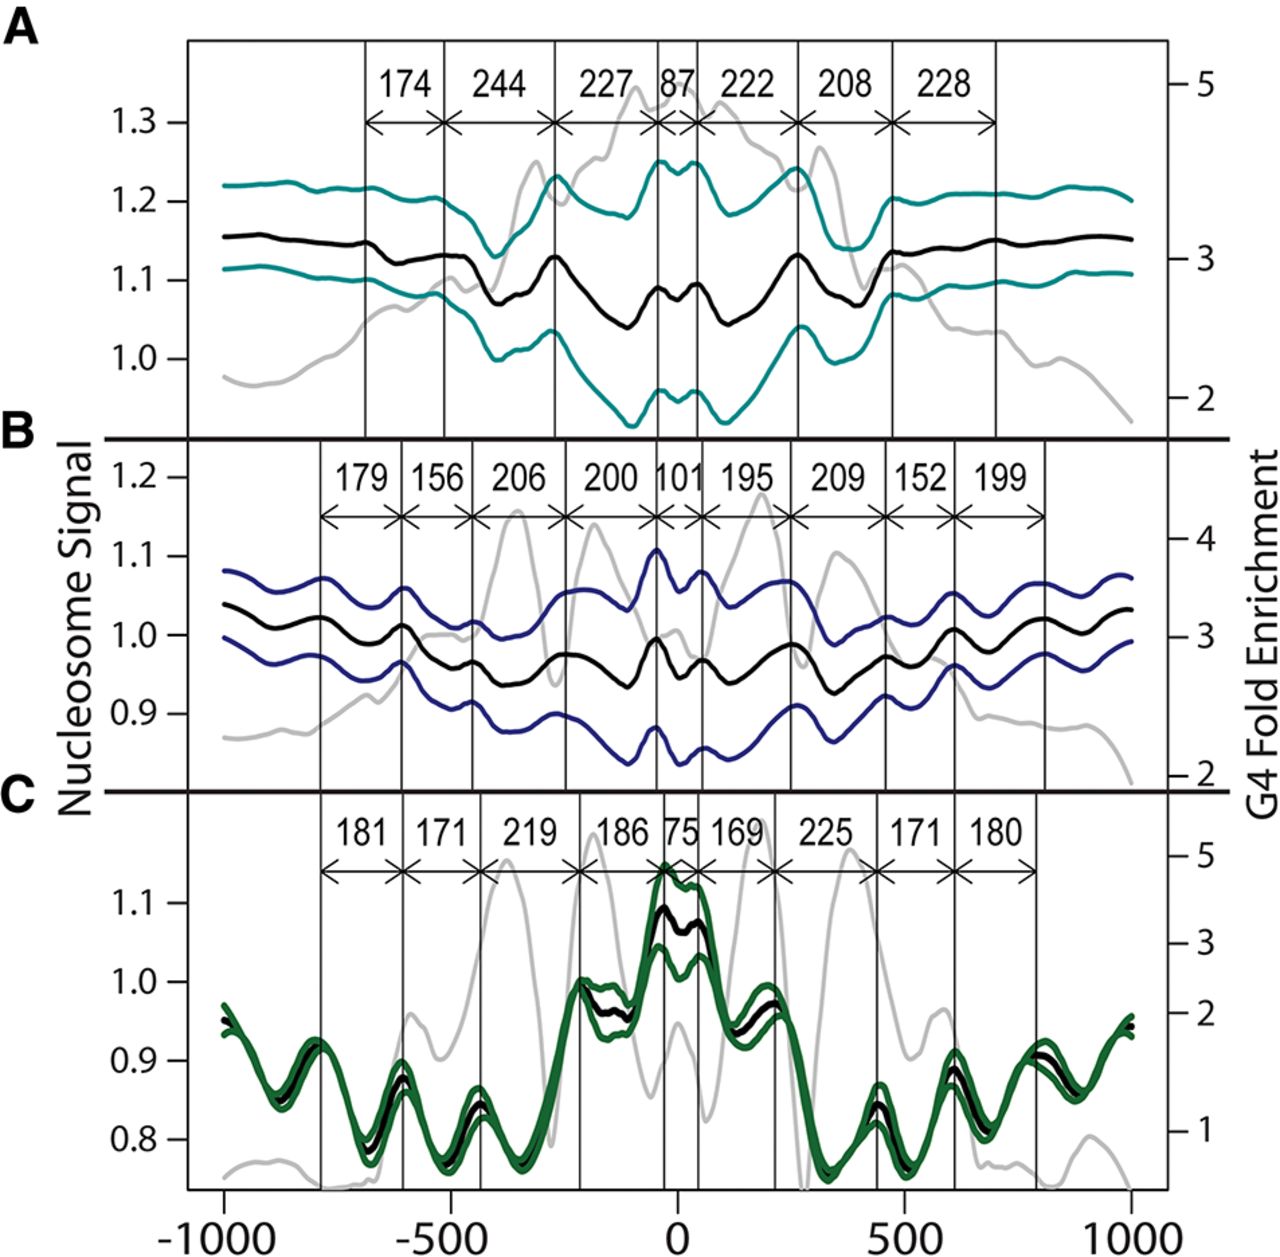
Figure 6.
Distribution of nucleosomes around peak summits. In each panel, the nucleosome signal was plotted around the peak summits for (A) LexoG0G0gDNA, (B) NSG0gDNA, and (C) NSLexoG0. The colored lines show the nucleosome signal for K562 and GM12878 cells (Kundaje et al. 2012). The black line is the mean of the two cell lines. The vertical lines indicate the crest positions of the wave-like nucleosome signal, and the labeled arrows indicate the intercrest distances. The gray lines show the distribution of non-strand-oriented G4 motifs (log-transformed versions of Fig. 4A,C,E, respectively).


