
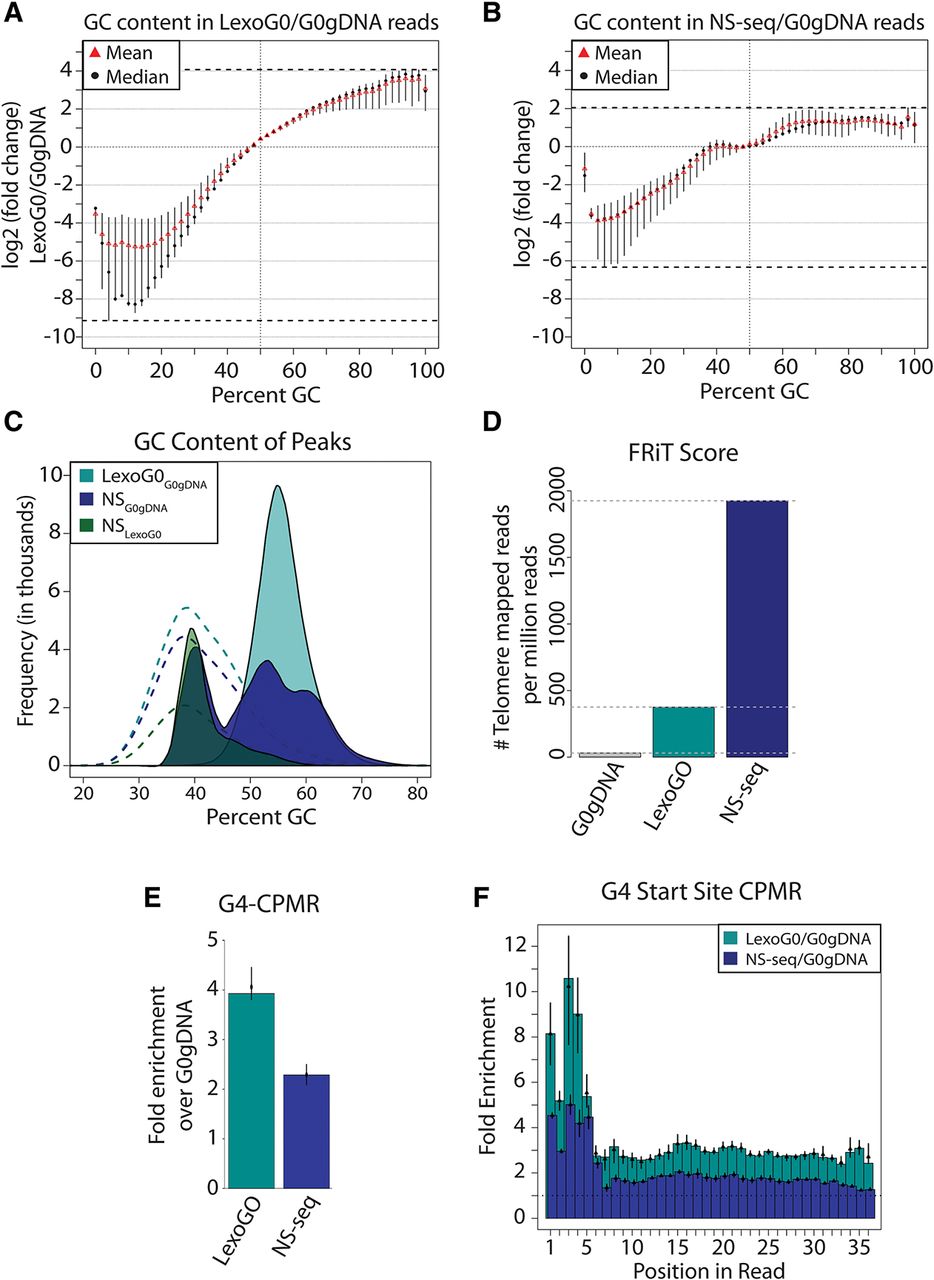
λ-exo digestion enriches GC-rich and G4-containing sequences. (A) Log2 (fold change) of the distribution of GC content in LexoG0 reads relative to that of G0gDNA reads. Over each GC%, the minimum to maximum (line segment), median (black dot), and mean (red triangle) for the replicates are shown. The dotted lines at the top and bottom represent the absolute maximum enrichment and depletion values found among the replicates. (B) Log2 (fold change) of the distribution of GC content in NS-seq reads relative to that of G0gDNA reads. Other details as in panel A. (C) GC content of peaks for LexoG0G0gDNA, NSG0gDNA, and NSLexoG0. (Dashed lines) Distribution of GC content in randomly shuffled peaks. (D) Fraction of reads in telomeres (FRiT) scores. (E) G4-CPMR fold enrichment of the NS-seq and LexoG0 replicates over G0gDNA. The median (bar height), the minimum to maximum values (vertical line), and mean (black dot) for the replicates are shown. (F) Fold enrichment of G4-start-site-CPMR over positions 1–36 in 50-bp reads. Over each position, the minimum to maximum (vertical line), median (bar height), and mean (black triangle) of the replicates are shown.


