
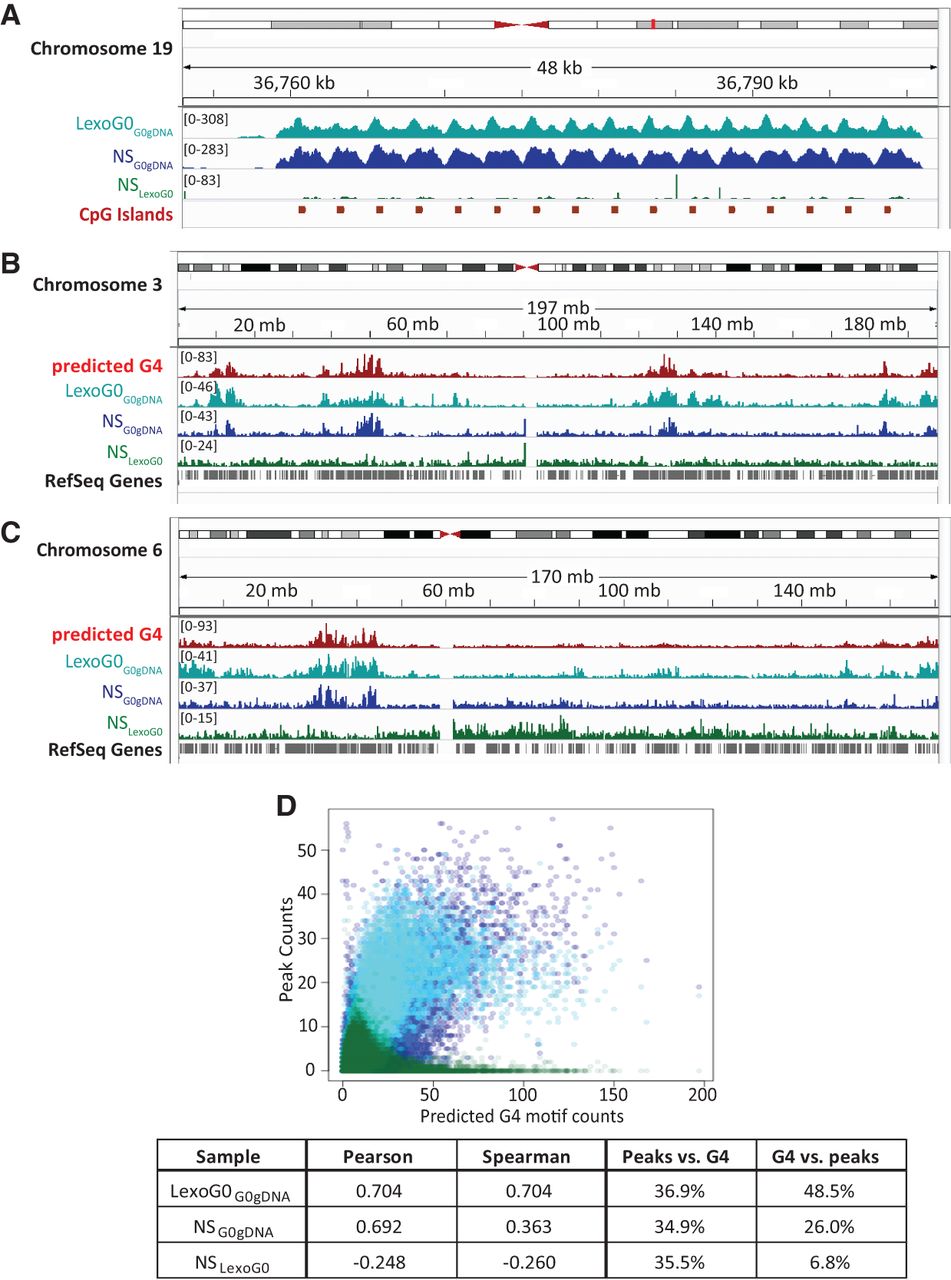
Correlation with predicted G4 motifs and CpG islands. (A) The −log10 (P-value) signal for LexoG0G0gDNA, NSG0gDNA, and NSLexoG0 for a 48-kb region on the q arm of Chromosome 19 containing a repeated array of CpG islands. (B,C) Density of G4 motifs and LexoG0G0gDNA, NSG0gDNA, and NSLexoG0 peaks on Chromosome 3 (B) and Chromosome 6 (C). (D) Scatterplot of genome-wide densities (counts in 100-kb bins) of LexoG0G0gDNA, NSG0gDNA, and NSLexoG0 peaks and predicted G4 motifs. Pearson's r and Spearman's ρ for the densities of the indicated sample and G4 motifs are displayed in the box, along with the percentage of overlap of peaks with predicted G4 motifs (peaks vs. G4) or vice versa (G4 vs. peaks) for each data set. For all panels, cyan, LexoG0G0gDNA; blue, NSG0gDNA; and green, NSLexoG0.


