
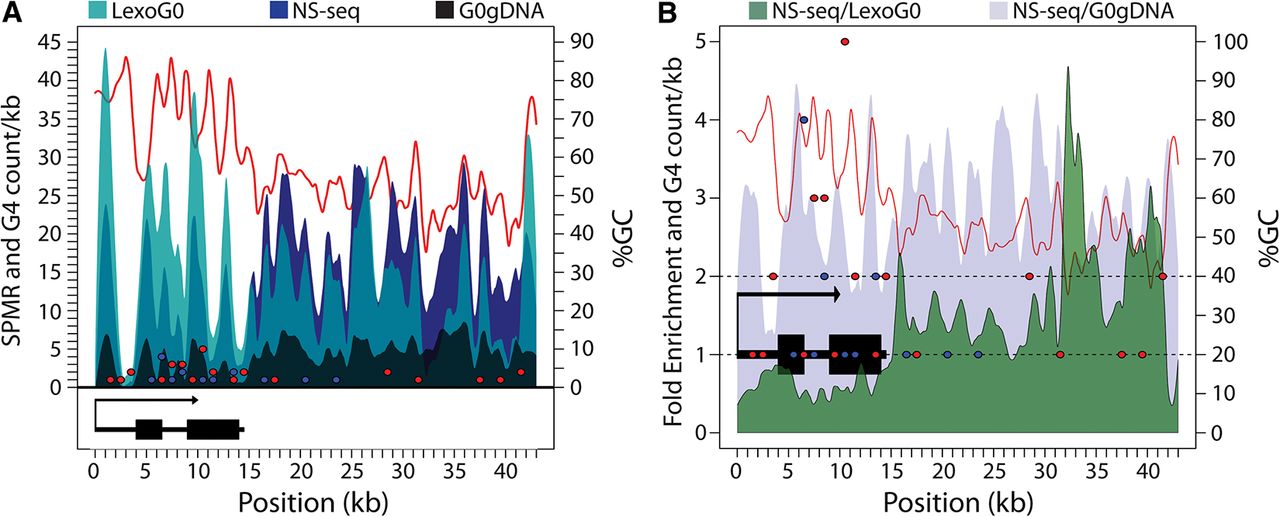
Controlling for λ-exo biases in NS-seq. (A) The signal per million reads (SPMR) is shown for G0gDNA (black), LexoG0 (cyan), and NS-seq (blue) reads mapped to the ribosomal DNA (rDNA) sequence. The cyan and black are slightly transparent to allow visualization of the signals behind them. The lighter cyan is the LexoG0 signal alone, while the darker cyan indicates where the LexoG0 signal overlaps the blue NS-seq signal behind it. Non-zero G4 counts in 1-kb bins across the rDNA locus are shown for the plus strand (blue dots) and the minus strand (red dots). The percentage of GC across the locus is indicated by the red line. The rRNA transcription unit is shown below. (B) The NS-seq SPMR fold enrichment over G0gDNA (light blue-gray) or LexoG0 (green) controls. The rRNA transcription unit is shown (black). G4 counts in 1-kb bins and percentage of GC are displayed as in A. Dashed lines indicate onefold and twofold enrichment levels.


