Abstract
Hepatitis B virus (HBV) integration is a key driver of hepatocellular carcinoma (HCC) occurrence and progression; however, its oncogenic mechanisms remain incompletely understood because of limitations in detection methods and sample availability. In this study, we employ Oxford Nanopore Technologies (ONT) whole-genome sequencing and full-length transcriptome sequencing to characterize HBV integration events at the genomic and transcriptomic levels, along with their regulatory effects on structural variations (SVs) and gene expression. Functional validation is performed using dual-luciferase assays and cell-based experiments. Our findings reveal that integrated HBV sequences form long concatemers, mediating inter- and intrachromosomal recombination in the human genome. Notably, integrated HBV enhancer I (HBV-Enh I) is detected in six of seven tumor tissues and is associated with aberrant gene expression. HBV integration induces oncogenic SVs, such as focal MYC amplification and NAV2 deletion, and directly modulates gene expression. Additionally, ectopic overexpression of MYOCD, driven by HBV-Enh I integration, promotes HCC cell migration and invasion. In summary, HBV integration acts as a major driver of large-scale genomic SVs and transcriptomic dysregulation, through either direct alterations in genome dosage or cis-regulatory mechanisms. HBV-Enh I is frequently integrated in HCC and might play a pivotal role in abnormal gene expression, highlighting its potential as a therapeutic target.
Primary liver cancer (PLC) is a leading cause of cancer-related mortality in more than 136 countries, and its incidence is projected to increase (Rumgay et al. 2022). Hepatocellular carcinoma (HCC) is the most common PLC, accounting for >80% of cases (Llovet et al. 2021). China is among the areas associated with the highest risk of developing HCC, accounting for 42.5% of the global incidence of liver cancer (Bray et al. 2024; Miao et al. 2024). Notably, ∼90% of HCC cases in China are hepatitis B virus (HBV)–related, and 140,000 people die of HCC annually (Seto et al. 2018; Zhou et al. 2025). Understanding the mechanistic links between chronic HBV infection and HCC pathogenesis is thus critical for improving prevention and treatment strategies.
HBV is a small DNA virus with an average length of 3.2 kb. The integration of viral sequences into the tumor genome is known as a key oncogenic mechanism and is detectable in ∼90% of HBV-related liver cancers (Levrero and Zucman-Rossi 2016; Chen et al. 2019; Ren et al. 2023). Characterization of HBV integrations has relied primarily on inverse nested PCR or high-throughput sequencing (HTS), which may introduce bias and is restricted to detecting junctions between HBV and host genomes. Recently, the advancement of long-read sequencing has improved our understanding of HBV integration and its role in HCC development. HBV can integrate into the human genome in multiple and complex patterns, with integrated segments ranging from <1 kb to >3 kb in length (Li et al. 2022). These integrated segments were fragmented in different orientations, rarely with a complete genome (Zhuo et al. 2021). Moreover, except for the entire integration, the extended long reads sufficiently cover the adjacent human sequences, revealing the human chromosomal abnormalities associated with HBV integration, such as interchromosomal translocations, dicentric chromosomes, and megabase-size telomeric deletions.
Currently, the median age at diagnosis for this disease is 52 years (Zhang et al. 2018), but ∼12% of patients with HBV-related HCC are first diagnosed under 40 years of age (early onset) (Sun et al. 2013; Yan et al. 2015). Patients with early-onset HBV-related HCC more often display distinct clinical characteristics, such as a lower occurrence rate of cirrhosis at the time of diagnosis of HCC, larger tumors, portal vein invasion, and more advanced stages of disease (Wan et al. 2011). However, owing to the limited sample sizes and detection techniques, the underlying mechanism for early-onset HCC remains unknown. Long-read sequencing revealed that HBV-mediated rearrangements are significantly correlated with young age (Qian et al. 2024).
Therefore, to understand the role of HBV integration in the development of early-onset HCC, we utilized the Oxford Nanopore Technologies (ONT) sequencing platform to analyze the genomes and transcriptomes of early-onset HBV-related HCC samples in this study. HBV–human chimeric reads with full-length integrated HBV sequences and related human genome SVs were identified and characterized. Based on these full-length integrated HBV sequences and the related human genome SVs, we provide new insights into HBV integration and its role in hepatocellular carcinogenesis.
Results
Overall characteristics of human genome HBV integration
ONT long-read whole-genome sequencing (30× coverage) was conducted on seven tumor tissues and the paired nontumor tissues from four male and three female patients ≤30 years old (Supplemental Table S1) to investigate the comprehensive features of HBV integration in human genomes. HBV–human chimeric reads were extracted using minimap2 and subsequently mapped more precisely through NCBI BLAST (https://blast.ncbi.nlm.nih.gov/Blast.cgi) and UCSC BLAT (https://genome.ucsc.edu/cgi-bin/hgBlat).
The breakpoints of HBV integration in the human genome were termed HBV integration breakpoints. For clusters of these breakpoints, the median breakpoint of integration breakpoints located within 10,000 bp was designated the HBV integration locus (Fig. 1A,B). The data produced by ONT sequencing are shown in Figure 1B and revealed the following: (1) a greater number of HBV integration loci in tumor tissues and (2) a greater abundance of supporting reads per integration locus. The number of chimeric reads and the quantity of integration loci are listed in Supplemental Table S1. The PCR validation results for the HBV–human chimeric reads are shown in Supplemental Table S3 and Supplemental Figure S1. Overall, HBV integration was detected in both tumor and paired nontumor tissues; however, tumor tissues presented significantly greater numbers of HBV–human chimeric reads (Supplemental Table S1). Among the seven patients, five were infected with HBV subtype C, and two were infected with subtype B, as shown in Supplemental Table S1. Notably, compared with male patients, patients 5–7 (all female) had fewer chimeric reads, which is consistent with prior reports of elevated HBV integration frequencies in male-derived tumors (Zhao et al. 2016).
Characteristics of HBV integration in the human genome. (A) Distribution of human genome breakpoints with respect to HBV integration. (T) Tumor sample (filled circle); (N) paired nontumor sample (filled triangle). To clarify breakpoint localization, adjacent breakpoints within 10,000 bp were clustered, and median breakpoints are displayed. (TERT and MYC gene loci are indicated on the ideograms with green and purple bars, respectively.) (B) Frequency of HBV–human chimeric reads per breakpoint in tumor and nontumor samples. (C) Chromosomal distribution of HBV–human chimeric reads. Dark gold rectangles denote integrated HBV sequences; pentagons represent human genomic regions with HBV integration (colors indicate distinct chromosomes). The arrows mark the 3′-end. (D) Proportion of integration loci classified into the five categories depicted in panel C.
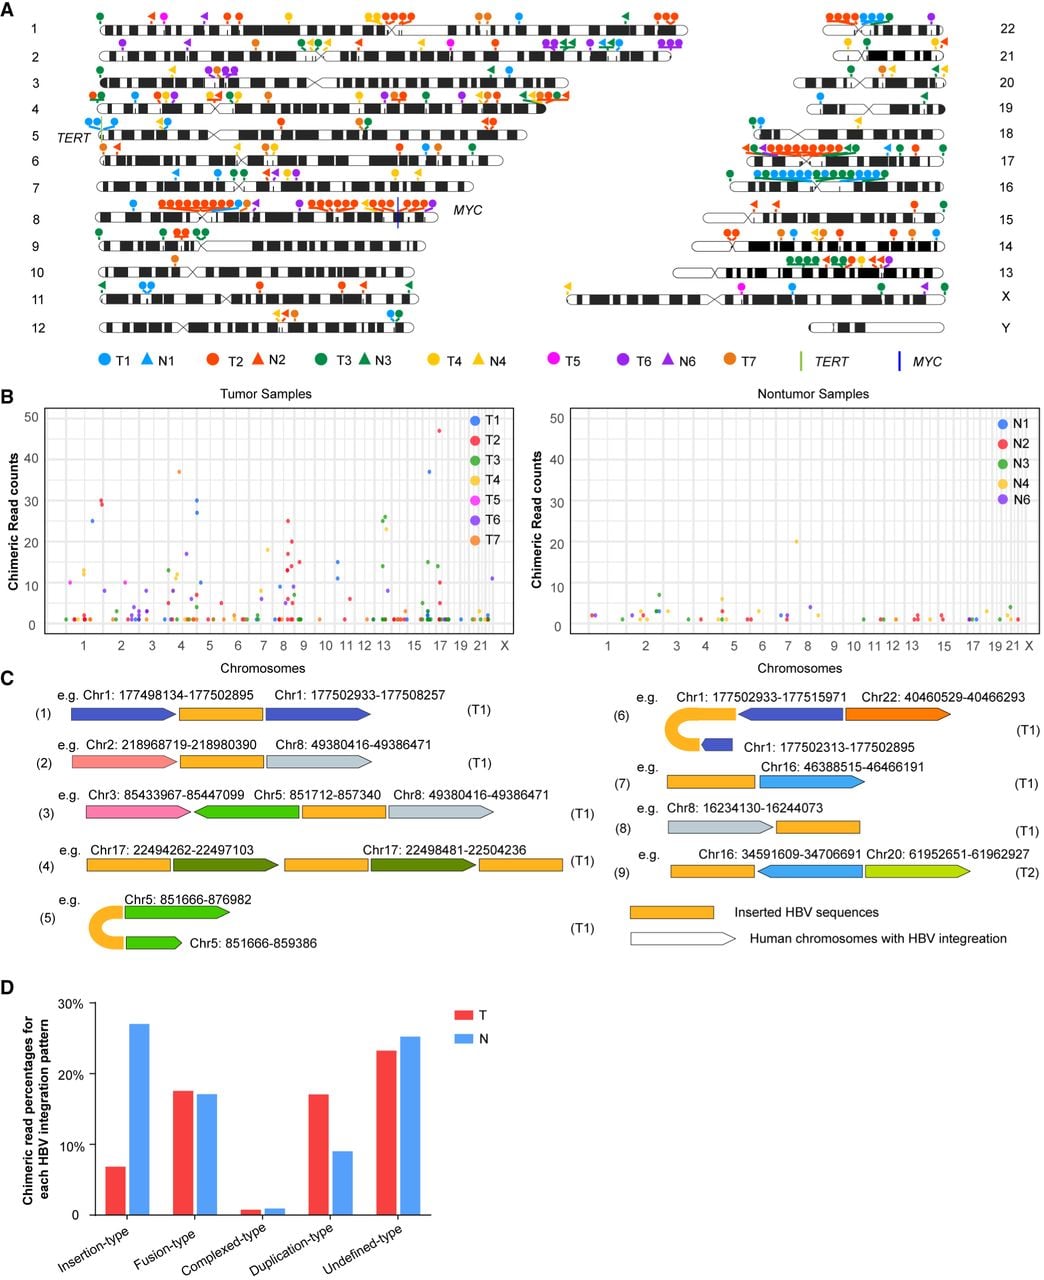
Based on the mapping results of the chimeric reads, several patterns of HBV integration within the human genome were identified, including insertion-type, fusion-type, duplication-type, complex-type, and undefined-type patterns (Supplemental Table S2). With respect to the insertion-type pattern, HBV integration occurred without disrupting the sequence order or structure of the human genome (Fig. 1C, 1). In the fusion-type pattern, HBV integration mediated chromosomal translocations or fusions between different chromosomes, resulting in significant genomic rearrangements (Fig. 1C, 2 and 3). HBV bridges the plus and minus strands of the same chromosome, mediating “fold-back” (head-to-end) connections. (Fig. 1C, 5 and 6). In the complex-type pattern, a single read contained multiple HBV integration segments involving one or more chromosomes (Fig. 1C, 4). In the undefined-type pattern, HBV integration occurred at chromosomal termini, either beginning or ending with HBV sequences (Fig. 1C, 7–9). Owing to the presence of only a single integration breakpoint in these reads, determining whether they represented complete integration events was impossible; thus, these cases were classified as undefined. The proportions of each integration pattern are summarized in Figure 1D.
For the duplication-type pattern, we illustrated an extreme case in which both upstream and downstream HBV integration breakpoints mapped to the same genomic coordinate, termed “shared breakpoints” (Fig. 1C, 5). Representative reads of shared breakpoints in tumor samples are illustrated in Supplemental Figure S2. Notably, in some reads with shared breakpoints, the inserted HBV sequences varied, but the human genomic sequences adjacent to the breakpoints were nearly identical (Supplemental Fig. S3). Collectively, the identification of these diverse HBV integration patterns enhances our understanding of the molecular mechanisms underlying HBV-induced genomic alterations and their potential role in the development and progression of HCC.
The human genome breakpoints associated with HBV integration were more concentrated in tumor samples, several of which were supported by a substantially large number of chimeric reads, especially near the oncogene TERT in the telomere region on Chromosome 5 of sample T1 and near the oncogene MYC in the 8q23–8q24 region on Chromosome 8 of sample T2 (Fig. 1A,B). Combined with the “shared breakpoints” phenomenon (Fig. 1C, 5; Supplemental Fig. S2, Supplemental Fig. S3), these findings suggest that HBV integration, as the major mutation in HBV-related HCC tissues, occurs in the early stages of the disease. Once integrated into the human genome, HBV sequences may connect with other HBV sequences, leading to the expansion of dominant clones through positive selection during tumor development.
Characteristics of integrated HBV sequences
Utilizing ultralong ONT sequencing, we detected full-length integrated HBV sequences along with human genome fragments spanning the breakpoints. In tumor samples, the lengths of inserted HBV sequences ranged from <100 bp to >30,000 bp, whereas in paired nontumor samples, they ranged from 500–10,000 bp (Fig. 2A,B). A map of the HBV genome is shown in Figure 2C. Details regarding the host CNVs at the integration loci, integrated HBV copy number, and integrated HBV elements are listed in Supplemental Table S2. These results suggest that some chimeric reads contain multiple HBV sequences, indicating potential self-ligation events between HBV genomes. Moreover, we compared the identified integration sites with the fragile sites in the HumCFS database (http://webs.iiitd.edu.in/raghava/humcfs/) and listed the information for the common fragile sites (CFSs) within the identified integration loci in Supplemental Table S2. Approximately 18.85% (36/191) of the integration loci in tumor samples were located within the CFS regions, and ∼58.33% (21/36) of these integration loci were within host CNV regions. In the paired nontumor samples, ∼21.15% (11/52) of the integration sites were located within CFS regions, and 9.1% (1/11) of these CFS-associated integration sites were within host CNV regions.
Characteristics of the integrated HBV sequences. (A,B) Lengths of the integrated HBV sequences in the tumor and paired nontumor samples. (C) HBV genome map. (D) Distribution of the HBV integration breakpoints in the HBV genome. (E) Sequencing depth of the integrated HBV bases. The x-axis represents the genomic position of the mapped bases in the HBV genome; the y-axis represents the sequencing depth for each HBV base. (F,G) Counts (F) and percentages (G) of the structural variations of the integrated HBV sequences in the HBV–human chimeric reads of tumor (T) and nontumor (N). (H) Counts of the chimeric reads with HBV enhancers inserted. (I) The proportion of the chimeric read counts with HBV enhancers integration compared with the total chimeric read counts in each sample. (J,K) The number of detected enhancers at each integration locus, with colors representing different samples, solid circles indicating HBV-Enh I, and solid triangles indicating HBV-Enh II.
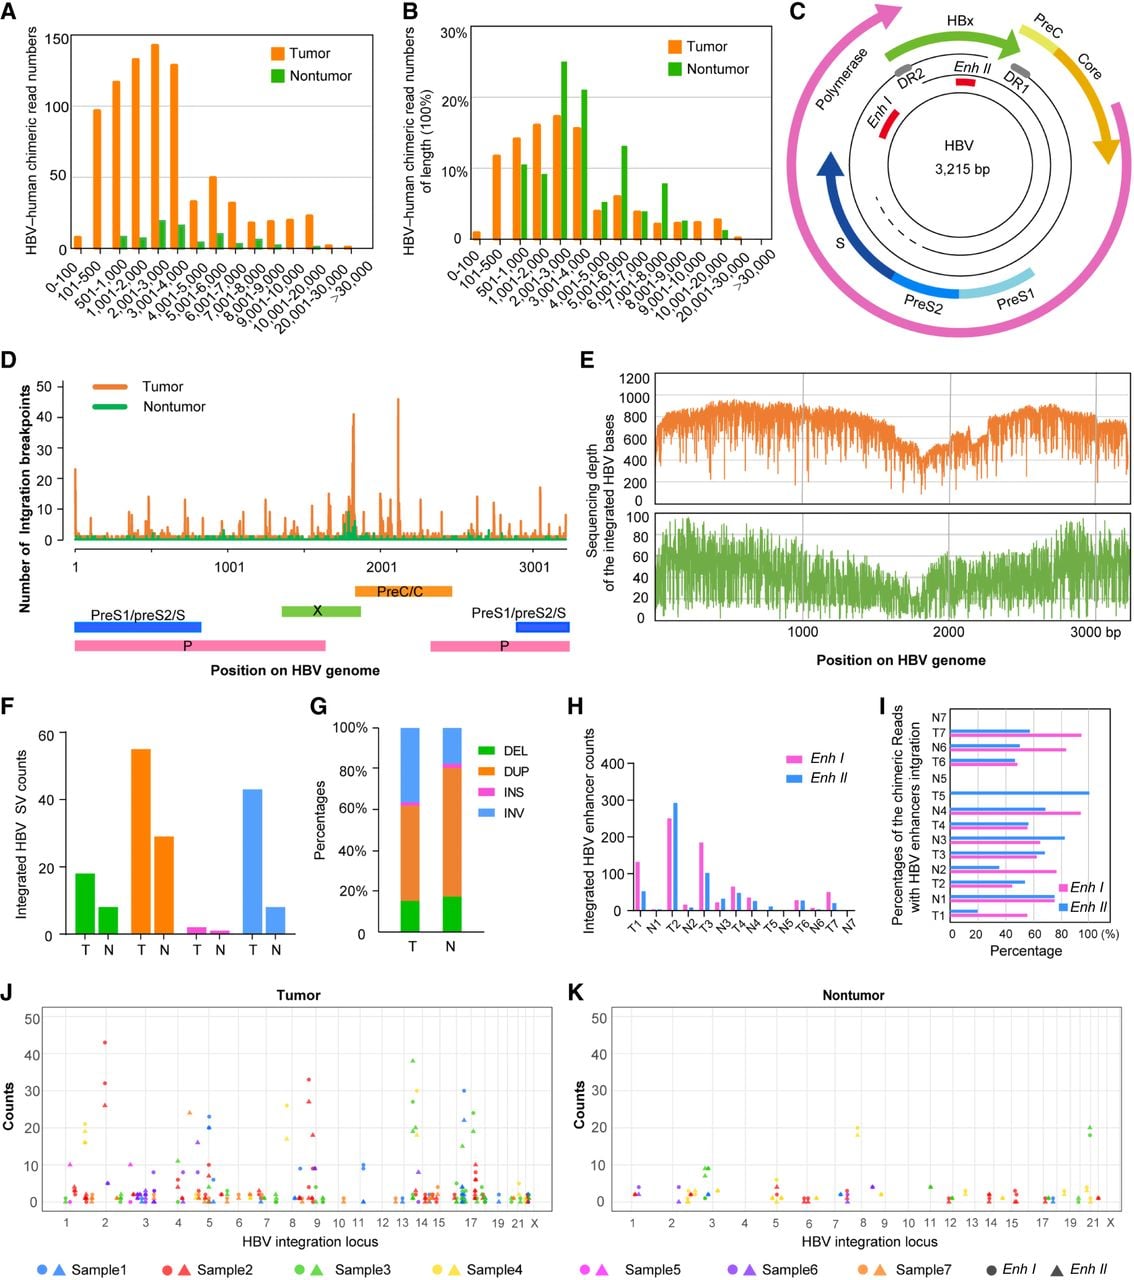
The most frequent breakpoints in HBV–human sequences occurred at positions 1825 bp and 2117 bp in the HBV genome, corresponding to junction regions between (1) the 3′-end of the HBV X gene and the 5′-end of the C gene and (2) the 5′-end of the P gene and the 3′-end of the C gene (Fig. 2D). These findings are consistent with those of previous reports (Jiang et al. 2012; Sung et al. 2012; Chen et al. 2024).
Quantification of integrated HBV bases revealed high integration abundance throughout the HBV genome in both tumor and paired nontumor tissues. However, the 1700–1900 bp region showed relatively low integration abundance, with distinct valleys observed at 1817 bp (tumor) and 1801 bp (nontumor) (Fig. 2E). Notably, these valley positions closely corresponded to the peak breakpoint locations, suggesting a reduced integration frequency at the 3′-end of HBx.
The integrated HBV sequences were fragmented and mapped to the P, X, S, and C genes, and complete HBV sequences were rarely detected in these seven sample pairs (Zhuo et al. 2021). Importantly, these HBV integration events, along with their human genome breakpoints, likely play significant roles in hepatocarcinogenesis and warrant further investigation.
Structural variation (SV) analysis was performed on the inserted HBV sequences and revealed inversions, duplications, insertions, and deletions compared with HBV reference sequences, with these variations present in both tumor and nontumor samples. Notably, the SV counts were significantly greater in tumor tissues than in paired nontumor tissues (Fig. 2F). With respect to the distribution of the SV types, duplications and inversions predominated in tumor samples, whereas duplications accounted for the greatest proportion in nontumor tissues (Fig. 2G). The SV types for each of the viral ORFs were also included (Supplemental Fig. S4). To compare the number of SVs within the integrated HBV genome with the host CNVs within the host genome at sites of viral integration, we classified the integration loci in tumor samples into two categories based on the number of supporting chimeric reads: one category with fewer than five supporting chimeric reads, and the other with five or more supporting chimeric reads. We found that among the integration loci supported by five or more chimeric reads, 12.07% were associated with host CNV loss and 46.55% were associated with host CNV gain. Among the sites supported by fewer than five chimeric reads, the corresponding host CNV frequencies were as follows: amplification (3.79%), deletion (16.67%), gain (9.85%), and loss (19.70%). Therefore, the number of chimeric reads at integration loci is not positively associated with host CNV alterations.
HBV enhancer I (HBV-Enh I), a highly conserved element, was previously shown to be active in Hep3B and PLC/PRF/5 cell lines, suggesting its potential role in hepatocellular carcinogenesis (Shamay et al. 2001). In our study, HBV-Enh I was detected in the chimeric reads from the tumor tissues of patients 1–4, 6, and 7, whereas HBV enhancer II (HBV-Enh II) was present in every tumor sample (Fig. 2H,I). Moreover, the proportion of integration sites with more than 10 enhancer integrations was significantly greater in tumor tissues (10.5%) than in nontumor tissues (3.8%) (Fig. 2J,K). These results indicate that integrated HBV enhancers may extensively regulate human gene expression and promote hepatocellular carcinogenesis.
HBV integration drives human genome rearrangement
Chromosomal rearrangements and SVs play vital roles in HCC development and progression (Wong et al. 2000; Midorikawa et al. 2006; Álvarez et al. 2021). To investigate the genetic basis of chromosomal instability in HCC, we examined the relationship between HBV integration and human genome rearrangements in HCC samples, along with potential oncogenic mechanisms. Junction breakpoints were frequently observed near copy number variation (CNV) boundaries in the human genome, with ∼70% located within ±100 kb of these boundaries (Fig. 3A). CNV detection was performed using QDNA-seq software; the genome was divided into 1000 bins; and the alpha value of the circular binary segmentation of the DNA copy package was less than 0.05 to accept the changed point. Chimeric reads were quantified when breakpoints coincided with CNV regions. In sample T1, T2, T4, T5, and T7, >80% of the chimeric reads mapped to CNV regions, whereas paired nontumor tissues showed no such association, except for 35.3% (6/17) and 16.67% (1/6) of the reads in N2 and N6, respectively (Fig. 3B,C). These results indicate a strong link between HBV integration and chromosomal instability.
Relationships between HBV integration and structural variations (SVs) in HCC tumor and paired nontumor samples. (A) Distances between HBV–human breakpoints and CNV boundaries. The y-axis indicates the distances (in basepairs) from breakpoints to CNV edges, and the x-axis represents their genomic locations. The breakpoints were classified as follows: (1) if either breakpoint of an HBV–human chimeric read fell within a CNV region, the read was considered CNV-associated, and the breakpoint closest to the CNV boundary was used for distance calculation; (2) if both breakpoints resided within CNVs, the one closer to the edge was selected; and (3) if neither breakpoint overlapped a CNV, the distance was assigned a negative value. (B) Counts of HBV–human chimeric reads inside versus outside CNV regions. (C) Proportions of HBV–human chimeric reads within or outside CNV regions. (D,E) Bootstrap analysis of the nearest distances between SVs and HBV integration sites, along with comparisons of the SV frequencies inside and outside of 10 Mb regions (Fisher's exact test, P = 0.0019).
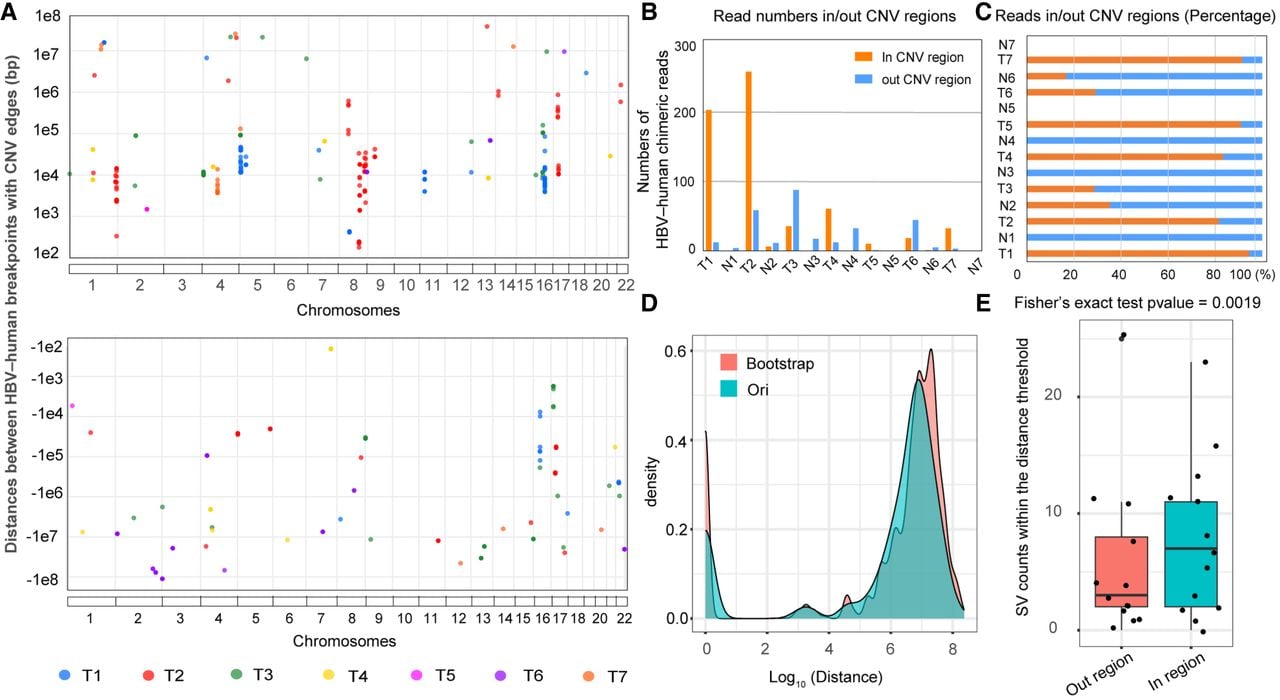
Furthermore, bootstrap analysis was used to determine the nearest distances between SVs and HBV integration sites, and the SV counts within and beyond 10 Mb regions were compared. SV frequencies were significantly greater in HBV integration sites than in nonintegration regions (Fig. 3D,E; Supplemental Fig. S5). To assess the oncogenic effects of HBV-driven SVs, we conducted further analyses.
HBV integration–mediated genomic deletions
Analysis of human chimeric reads in tumor samples revealed that many HBV-containing chimeric reads occurred in clusters and were associated with genomic copy number loss, suggesting that HBV integration mediated large fragment deletions. In sample T1, HBV integration caused a ∼300 kb deletion spanning Intron 1–30 of NAV2, resulting in significantly lower gene expression than those in paired nontumor tissue and other samples (sample N2 was excluded from expression analysis because of prolonged storage) (Fig. 4A–D). We also observed HBV-mediated telomeric-like deletions, which is consistent with previous reports (Supplemental Fig. S6; Álvarez et al. 2021).
HBV integration–mediated large-scale deletions and chromosomal duplications. (A) Copy number loss at the HBV integration locus on Chr 11 in patient 1. (Left) Copy number (CN) profile of the tumor tissue; (right) CN profile of the paired nontumor tissue. (B) HBV–human chimeric read coverage (IGV) revealing a ∼0.3 Mb deletion mediated by HBV insertion. (C) HBV integration in NAV2, with the deleted region spanning Intron 1–30. (D) Relative NAV2 expression in tumor versus nontumor tissues. (E) CN amplification at the HBV integration site on Chr 1 in patient 2 (CN profiles: tumor vs. nontumor). (F) HBV–human chimeric read coverage. (G) Examples of HBV-mediated chromosomal rearrangements: (1) fragment deletion with head-tail reconnection; (2) chromosomal duplication. (H) Relative expression levels of genes in the Chr 1 HBV integration region.
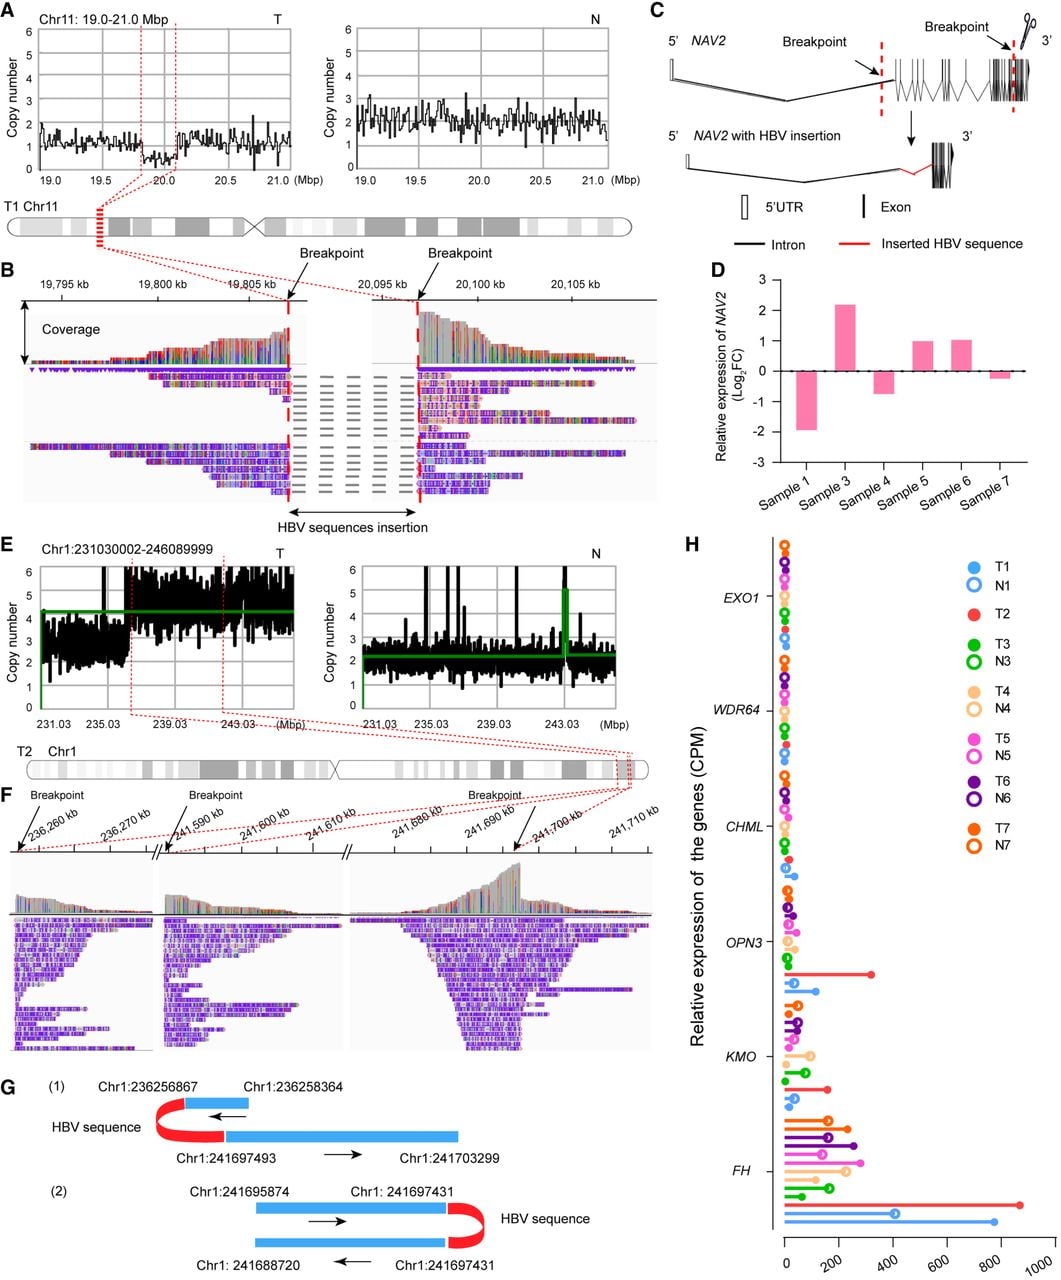
Chromosomal duplication mediated by HBV integration
A portion of the chimeric reads exhibited a pattern in which almost the same human chromosomal sequences were connected to each other in a head-to-tail way through HBV insertions. These regions exhibited copy number gains, indicating chromosomal duplication that may alter gene expression. For example, HBV integration–associated duplication occurred at 1q43 in tumor sample T2 (Fig. 4E–G). Transcriptome analysis revealed that KMO and OPN3 were both implicated in HCC (Jiao et al. 2012; Shi et al. 2022), with the highest expression levels among the seven tumor samples (sample N2 was excluded for expression analysis owing to prolonged storage) (Fig. 4H).
HBV integration–mediated chromosomal translocation
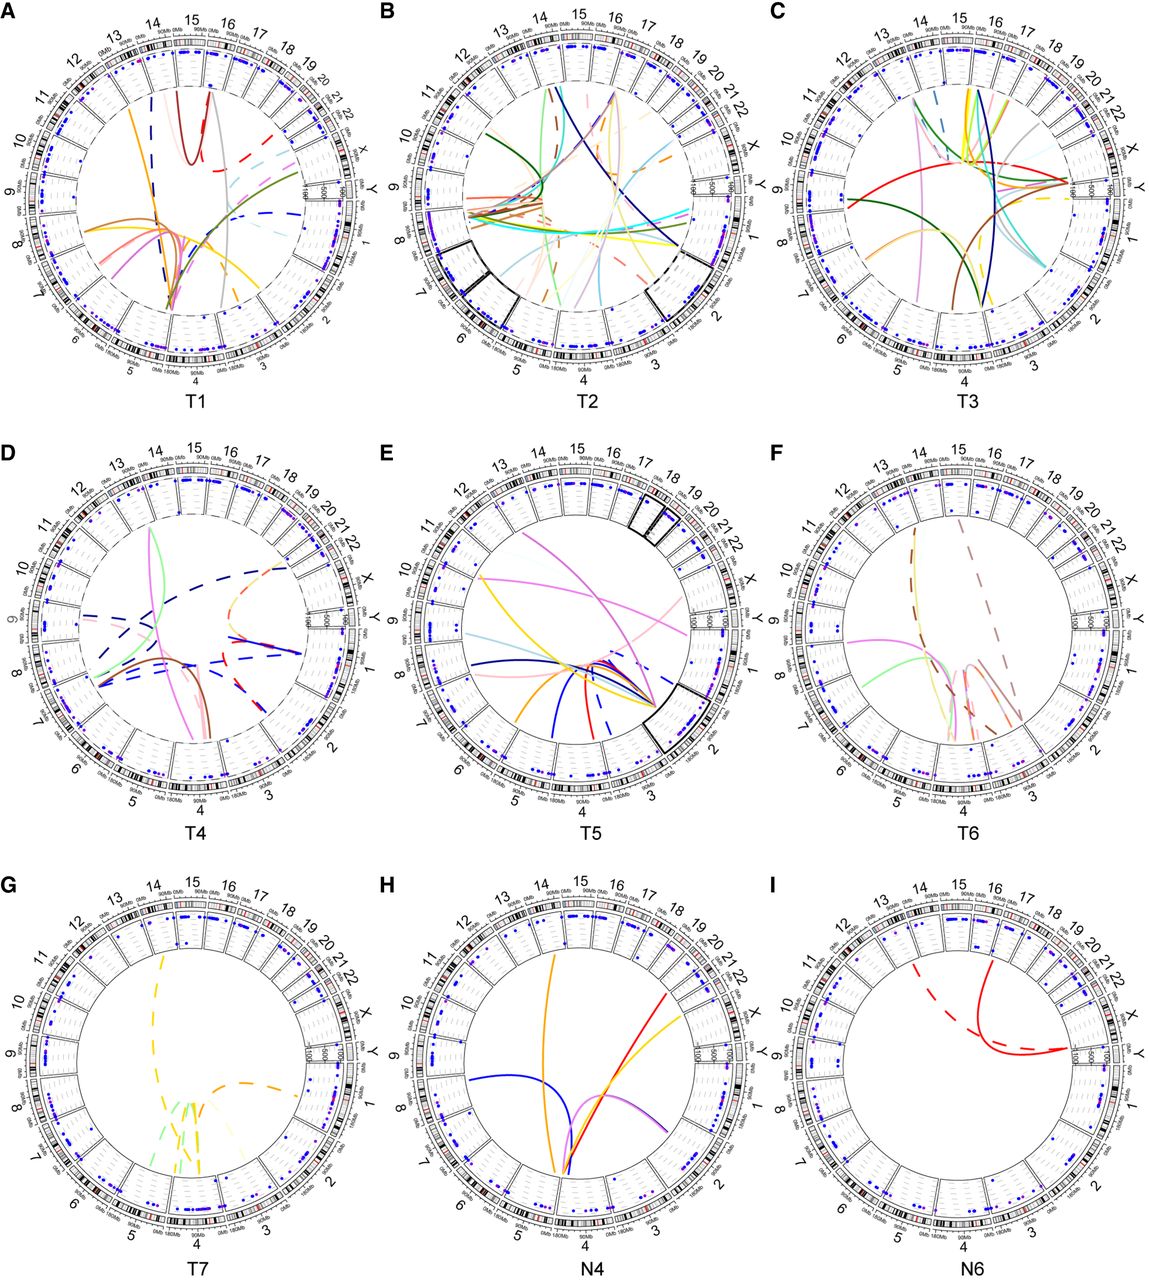
Interchromosomal translocations mediated by HBV integration were detected in all seven tumor samples, supported by clustered chimeric reads, but were observed in only two paired nontumor samples (Fig. 5A–I; Supplemental Table S2). Ideograms of major HBV-mediated interchromosomal translocations (supported by three or more chimeric reads) revealed that these events frequently resulted in telomere or centromere deletion and occasionally led to dual centromere formation (Supplemental Fig. S7A). Furthermore, tumor samples exhibited complex translocation patterns, including (1) connections among three different chromosomes bridged by HBV sequences and (2) HBV sequences positioned at the 3′-ends of chimeric reads (Supplemental Fig. S7B). These findings demonstrate that HBV integration promotes chromosomal instability, thereby contributing to HCC pathogenesis.
HBV integration–mediated chromosomal translocations. (A–G) Circos plots for samples T1–T7, respectively. (H,I) Circos plots for samples N4 and N6, respectively. The schematic illustrates the following: (inner circle) translocations between chromosomes bridged by HBV insertions (colored by genomic position), with solid lines indicating human-HBV connections and dashed lines representing interchromosomal connections; (middle circle) sample-specific CNV profiles; and (outer circle) chromosomal ideograms.
HBV-mediated complex chromosomal rearrangements
HBV integration can mediate additional complex SVs. For sample T1, HBV integrated into multiple regions of the telomere of Chr 5 with copy number loss of this region, indicating telomere loss on Chr 5. Analysis of these chimeric reads revealed that HBV integration mediated “fold-back” (head-to-end) connections, inducing duplications of the chromosome, and the chromosome regions showed single-end reads with the integrated HBV. Moreover, the chromosomes were fused with different chromosomes, including Chr 1, 3, 6, 7, 8, 12, and 13 and X, through the bridging effects of HBV insertion (Fig. 6A,B).
HBV-mediated complex chromosomal rearrangements. (A,C) CN profiles comparing nontumor (left) versus tumor tissue (right) from sample 1 (A) and sample 2 (C). (B,D) Schematic diagrams of HBV integration patterns on Chr 5 (B) and Chr 8 (D). Red rectangles denote integrated HBV sequences; solid lines indicate human–HBV junctions (arrowheads show breakpoint orientations); and colored dashed lines represent connections between reference segments and human sequences.
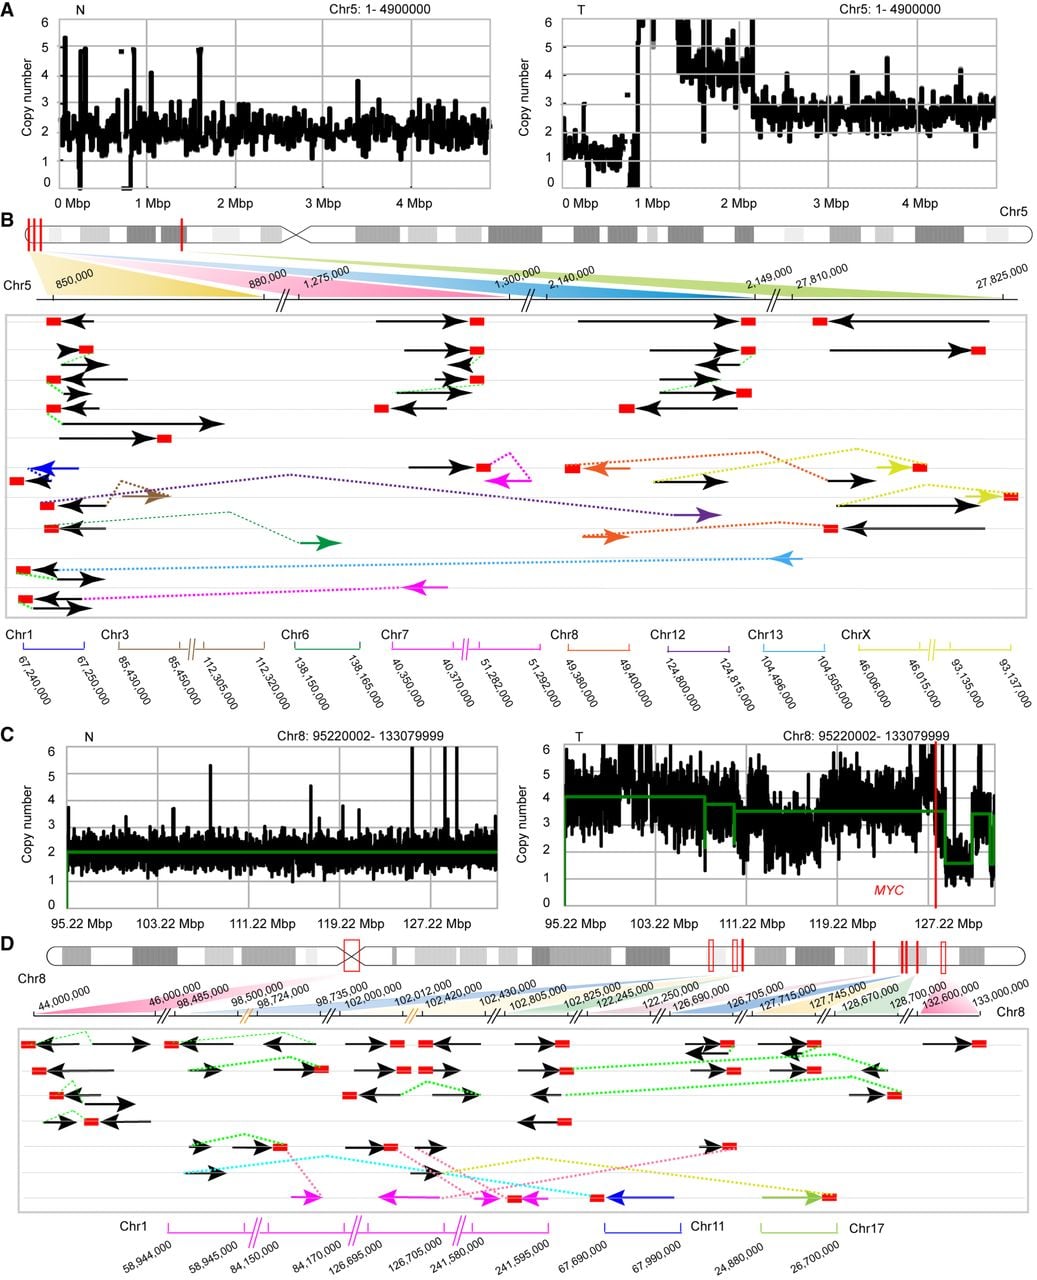
In sample T2, HBV integrated into the centromere of Chr 8, with eight major HBV integration sites identified in an ∼34 Mb region of the 8q23–24 genome. Copy number analysis revealed oscillation in the 8q23–24 genome region and deletion in the telomere region. Notably, HBV integration–mediated chromosomal duplications and single-end reads were frequently detected in the 8q23–24 region harboring the well-known oncogene MYC, likely resulting in focal amplification of MYC through the breakage–fusion–bridge (BFB) cycle. Moreover, the inserted HBV mediated interchromosomal translocation between Chr 8 and Chr 1, as well as between Chr 11 and Chr 17. Additionally, >50% of the Chr8q integration loci resided in CFS regions and correlated with host CNV, with each locus supported by more than 10 chimeric reads (Supplemental Table S2). These massive SVs in the region, indicating chromothripsis-like phenomena, may also promote oncogenesis in sample T2 (Fig. 6C,D).
HBV integration mediates aberrant gene expression
Cis-regulatory effects on flanking genes represent a major consequence of HBV integration (Wang et al. 2006; Sung et al. 2012; Yan et al. 2015; Zhao et al. 2020; Péneau et al. 2022). Our analysis of integration breakpoints revealed that introns and intergenic regions were the most frequently targeted genomic loci (Supplemental Fig. S8A,B), suggesting that HBV may cis-regulate neighboring gene expression. We therefore examined changes in the expression levels of genes within ±500 kb of integration sites (Supplemental Fig. S9; Supplemental Table S4). We listed the HBV integration loci with five or more supporting reads, as well as the following information: the associated HBV enhancer counts, host CNV status at the integration site, and gene expression profiles within ±500,000 bp flanking each integration locus in Supplemental Table S4. Moreover, Supplemental Figure S9 illustrates the following parameters for each integration locus: (1) expression levels of genes located within 500 kb upstream and downstream, (2) distances between transcription start sites (TSSs) of these genes and corresponding HBV integration sites, and (3) the number of enhancers associated with each integration locus. Although no strict linear relationship existed among these parameters, we observed that a subset of overexpressed genes (including MYC in sample T2, MYOCD in sample T3, and CCNA2 in sample T6) was flanked by a high density of HBV enhancer integrations, and genes within 100 kb showed the most pronounced expression alterations (Supplemental Fig. S8C). Notably, the integration loci T2_Chr4:11490 (sample T2) and T3_Chr4:10028 (sample T3) share proximal genomic coordinates, resulting in the recurrent involvement of ZNF141, ZNF595, ZNF718, and ZNF721 (Supplemental Fig. S9). These results demonstrate the capacity of HBV to dysregulate local gene expression (Supplemental Fig. S8D, Supplemental Fig. S9). The up- and downregulated genes are listed in Supplemental Table S4 together with the related integration loci.
Notable examples include the following: First, in sample T1, classical TERT promoter integration drove TERT overexpression (Supplemental Fig. S8E). Clustered integration between ZDHHC11 and BRD9 (upstream of TERT) was associated with elevated BRD9 and TRIP13 expression (likely through HBV cis-regulation and genomic dosage effects from regional duplication) and reduced ZDHHC11 expression (potentially owing to integration-associated telomeric loss). Second, in sample T2 (for which nontumor tissue was unavailable), genes near integration sites were markedly more highly expressed than were those in other tumor samples (Supplemental Fig. S9). These findings collectively demonstrate that HBV integration significantly perturbs transcriptional regulation in affected genomic regions.
Cis-activating role of HBV-Enh I in oncogene expression
The cis-regulatory effects of integrated HBV sequences represent a key mechanism driving aberrant oncogene expression, which is dependent on both the genomic integration site and viral sequence composition. Beyond the well-characterized TERT promoter integration in sample T1, we identified a clinically significant HBV integration cluster upstream of the MYC TSS in sample T2 (56 supporting reads). This integration occurred within a copy number–amplified region (Chr 8: 127,545,001–127,755,000) containing multiple HBV-Enh II sequences and correlated with MYC overexpression (Supplemental Table S4). This location matches our previously reported HBV integration hotspot between MYC and PVT1 in early-onset HCC (Yan et al. 2015).
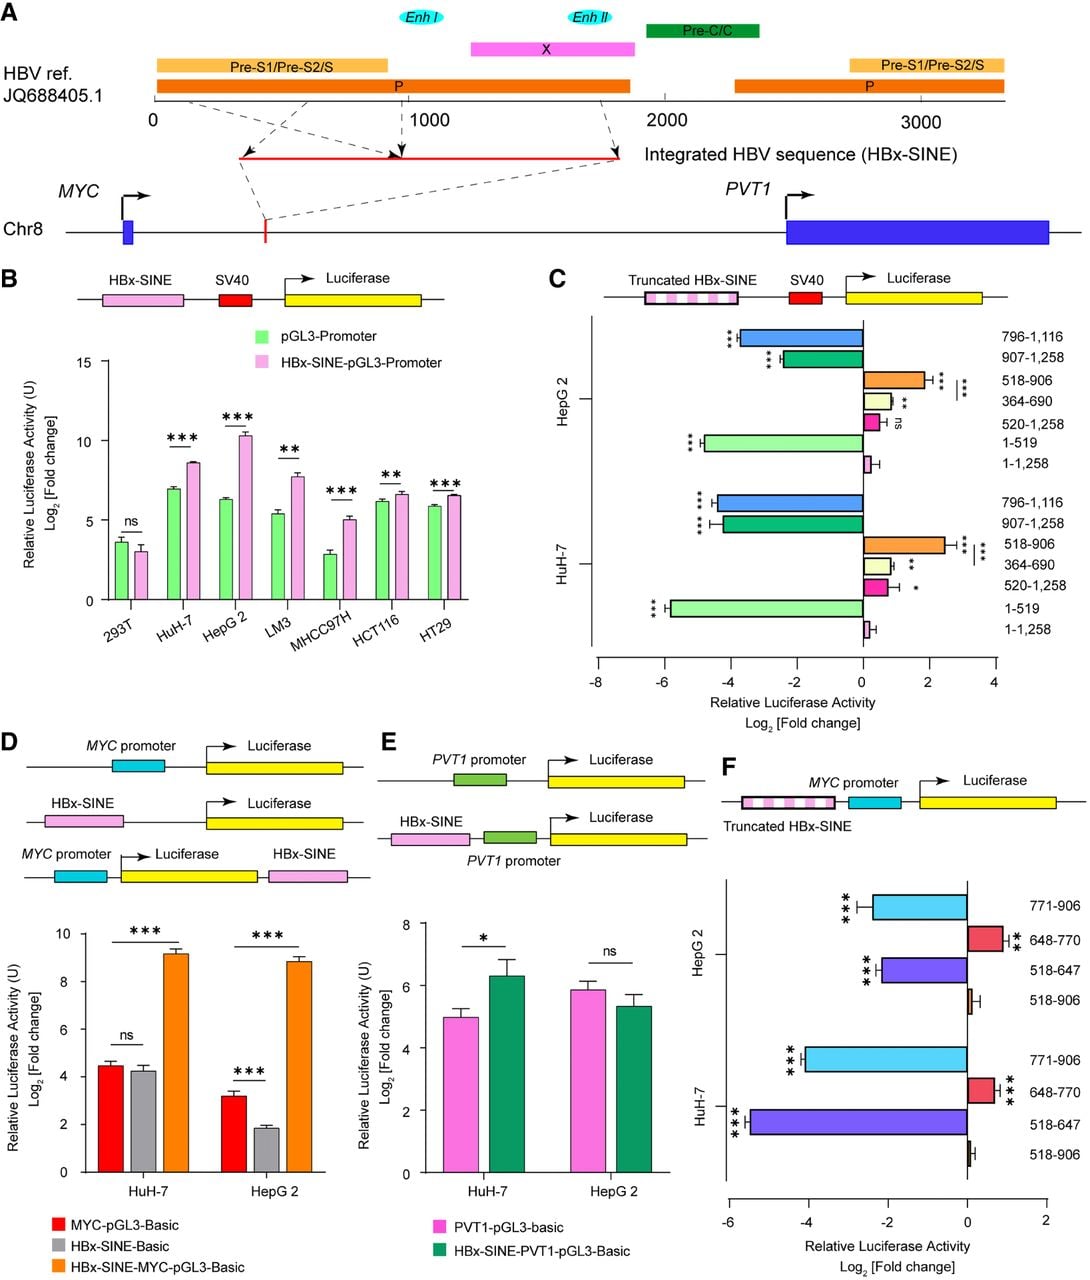
Through genome-walking and Sanger sequencing, we characterized the integrated HBV fragment (NCBI GenBank [https://www.ncbi.nlm.nih.gov/genbank/] accession number JQ688405.1), which contained most of the PreS, Enh I/HBx promoter and Enh II and was designated “HBx-SINE” (Fig. 7A; Supplemental Fig. S10). Luciferase reporter plasmids containing the full-length HBx-SINE or the truncated mutant sequences were constructed, and a dual-luciferase reporter assay was performed to verify the effect of HBx-SINE (Supplemental Table S5). The results revealed that HBx-SINE exerted enhancer activity in the Hep G2, HuH-7, HCCLM3, MHCC97-H, HT-29, and HCT 116 cell lines but not in the 293T cell line (Fig. 7B). In this study, the HuH-7 and Hep G2 cell lines were used for further verification and functional studies because they are common cell lines used for luciferase assays, transfection experiments, and cell functional studies in HCC (Zhang et al. 2020; Xie et al. 2021; Wen et al. 2025). HCCLM3 and MHCC97-H are cell lines used for metastatic HCC models and are prioritized for studying tumor invasion rather than HBV-specific mechanisms. Moreover, to rule out interference from HBV itself, we selected two HCC cell lines without a background of HBV infection. Then, the constructed HBV sequence–truncated mutant plasmids were inserted into the pGL3-promoter vector and transfected into the HuH-7 and Hep G2 cell lines, and the region (518–906 bp) of HBx-SINE demonstrated the strongest enhancing effect in both HCC cell lines (Fig. 7C). Subsequently, HBx-SINE and the truncated mutant sequences were cloned and inserted into the MYC-pGL3-Basic and PVT1-pGL3-Basic plasmids. The results revealed that HBx-SINE could enhance the transcriptional regulation of the MYC promoter, whereas the role of the PVT1 promoter was significant in HuH-7 cells but not in Hep G2 cells. HBV-Enh I was the core sequence for transcriptional activation of the MYC promoter (Fig. 7D–F). Analysis of the inserted HBV sequences in the gene regions revealed that the integration of HBV-Enh I could occur near the regions of the upregulated genes affected by HBV integration, suggesting that HBV-Enh I plays an important role in gene transcriptional activation.
Cis-activation role of HBV-Enh I. (A) Schematic representation of the HBV integration locus and the constitution of the integrated HBV sequence (HBx-SINE). (B) Relative luciferase activity of HBx-SINE-pGL3-promoter constructs in cell lines Hep G2, HuH-7, HCCLM3, MHCC97-H, HT-29, HCT 116, and 293T. (C) Relative luciferase activity of truncated HBx-SINE-pGL3-promoter constructs in cell lines HuH-7 and Hep G2. (D,E) Schematic of pGL3 plasmids harboring the MYC promoter or PVT1 promoter (top) and the relative luciferase activities of the constructed plasmids in the HuH-7 and Hep G2 cell lines (bottom). (F) Schematic of pGL3 plasmids harboring truncated HBx-SINE sequences and the MYC promoter (top) and the relative luciferase activity of the constructed plasmids in the HuH-7 and Hep G2 cell lines (bottom). The error bars correspond to the SDs of three independent transfections for each plasmid. The data are presented as the mean ± SEM (n = 3). (*) P < 0.05, (**) P < 0.005, (***) P < 0.001; one-way ANOVA.
The aberrantly high expression of MYOCD in sample T3 provided another example of an integrated HBV-Enh I serving as an enhancer for human genes. Compared with other genes in nearby regions associated with HBV integration, MYOCD is expressed at relatively low levels in the liver, and its biological effects have not been reported in HCC. In sample T3, HBV integrated into Exon 14 of MYOCD, and the integration region was also mapped to the region with an enhancer signature in the genome (E1847572, Chr 17: 12,768,309–12,768,611), accompanied by copy number amplification (Fig. 8A). The transcriptome data revealed that MYOCD was expressed at the highest level in sample T3 among all the detected samples (Fig. 8B). Notably, some chimeric reads in this region contained two or three HBV-Enh I sequences (Supplemental Fig. S11). Accordingly, it was speculated that the integration of HBV-Enh I promoted aberrantly high expression of MYOCD and contributed to HCC development.
Functional analysis of aberrantly expressed MYOCD. (A) Schematic representation of the HBV integration locus located in the MYOCD gene region (bottom) and the corresponding CNV (top). (B) Relative expression levels of MYOCD in the seven samples. (C) Plasmid constructs containing the MYOCD promoter (top) and the relative luciferase activity of the constructed plasmids in the HuH-7 and Hep G2 cell lines (bottom). (D,E) MYOCD expression levels were determined by qRT–PCR and western blotting in the HCC lines HuH-7 and Hep G2 infected with the MYOCD overexpression virus or mock vector virus. The data are presented as the mean ± SEM (n = 3). (F–I) Migration and invasion assays of HuH-7 and Hep G2 cells infected with the MYOCD overexpression virus or mock vector virus (n = 5 for migration and invasion assays). One-way ANOVA was used to compare the relative luciferase activity. Two-sample t-tests were used to compare the differences between the overexpression and control groups. (**) P < 0.005, (***) P < 0.001.
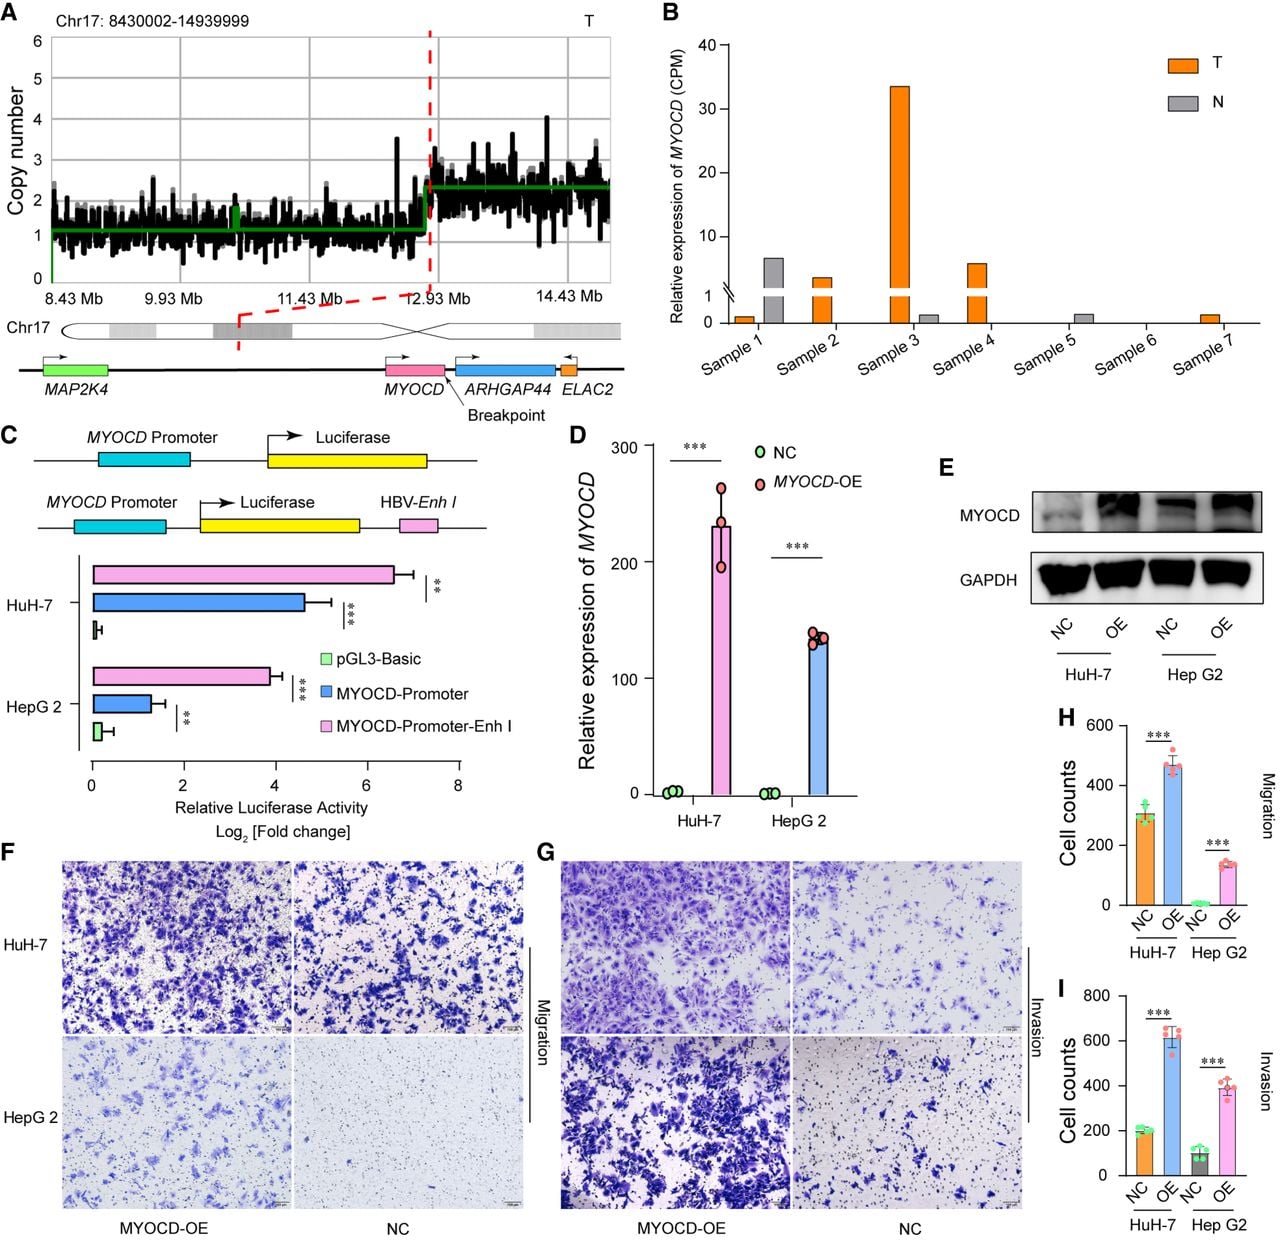
Based on the above results, dual-luciferase reporter plasmids containing the HBV-Enh I and MYOCD promoter sequences were constructed and transfected into the HCC cell lines HuH-7 and Hep G2, and the luciferase activity was measured 32 h later. As expected, HBV-Enh I increased MYOCD promoter-Luc-reporter activity (Fig. 8C). The following stable MYOCD-overexpressing HCC cell lines (HuH7-MYOCD-OE and Hep G2-MYOCD-OE) were subsequently constructed. Consistent with these findings, MYOCD-overexpressing cells exhibited a typical epithelioid morphology and increased migration and invasion (Fig. 8D–I). These results suggested that MYOCD might play an oncogenic role in HCC pathogenesis by promoting tumor cell migration and invasion.
Discussion
The integration of HBV into hepatocellular genomes is a pivotal driver of HCC occurrence and progression. Although widely reported, the underlying pathogenic mechanisms have remained incompletely understood until recently. In this study, we conducted an integrated analysis of ONT whole-genome sequencing and full-length transcriptome sequencing data from seven paired tumor and nontumor tissues. We characterized HBV integration patterns at both the genomic and transcriptomic levels, as well as their regulatory effects on human SVs and gene expression in the human genome. Notably, the tissues were obtained from patients under 30 years of age, who frequently had a family history of HBV infection, a relatively low incidence of liver cirrhosis, and a poor prognosis. These findings suggest that the pathogenesis of early-onset HCC may differ from that of late-onset HCC (Yan et al. 2015; Péneau et al. 2022).
In this study, we analyzed both the HBV–human junction breakpoints and the integrated HBV sequences. Notably, ∼37.5% of the integrated HBV sequences exceeded the length of the reference HBV genome (3215 bp), with some >30,000 bp. Given the frequent detection of HBV-related SVs, we hypothesize that HBV may undergo self-fusion during integration into the human genome. Additionally, a substantial proportion of chimeric reads contained HBV sequences at only one terminus (designated “single-end chimeric reads”), and breakpoints in these single-end reads coincided with those in translocation/duplication-bridging chimeric reads (Supplemental Fig. S2). These results are consistent with previous reports that the HBV genome can be fragmented and integrated into the human genome in different orientations continuously at the same site (Zhuo et al. 2021). HBV integration is an early driver of tumor progression (Duan et al. 2018). We speculate that during clonal evolution, HBV-integrated human genomes may fuse via HBV sequences, leading to SVs such as interchromosomal translocations or duplications. Furthermore, nearly all breakpoints in paired nontumor tissues exhibited low copy numbers, suggesting positive selection during tumorigenesis. Human papillomavirus (HPV) is another DNA tumor virus that integrates into host genomic DNA and forms virus–virus and virus–host genomic structural rearrangements, which are unstable and lead to further intratumoral heterogeneity and clonal evolution; through long-read sequencing, unique breakpoints shared across structural variants were also observed in HPV integration (Akagi et al. 2023). These findings suggest certain commonalities in the oncogenic mechanisms of DNA oncoviruses that integrate into host genomes; however, their broader implications require further exploration.
Accumulating evidence indicates that HBV integration can reshape the genomic architecture and promote the development of HCC (van Buuren et al. 2022; Qian et al. 2024). Notably, our analysis revealed host interchromosomal translocations in all seven tumor samples, with a significantly higher frequency than previously reported in the literature (Álvarez et al. 2021; van Buuren et al. 2022). Moreover, six tumor samples exhibited HBV integration events proximal to telomeric or centromeric regions, suggesting that these areas may be preferential sites for viral integration. These samples demonstrated frequent HBV-associated SVs, including duplications (DUPs), deletions (DELs), inversions (INVs), and interchromosomal translocations, all of which are indicative of chromosomal instability.
Specifically, two representative cases were observed: (1) HBV integration near the telomeric region of Chr 5 in sample T1 and (2) integration on the long arm of Chr 8 in sample T2. Both events were supported by numerous HBV–human chimeric reads and exhibited frequent interchromosomal translocations with “fold-back” inversion patterns mediated by inserted HBV sequences. Such fold-back patterns implicate BFB cycles (Tanaka and Yao 2009), which can drive oncogene overexpression and contribute to both cancer initiation and therapeutic resistance (Shoshani et al. 2021). Furthermore, the enrichment of HBV integration loci within Chr8q CFS regions (>50% in sample T2) may partially stem from their inherent fragility, explaining the high integration density in this area. HBV integration in the centromeric region of Chr 8 was first identified. Given the essential role of the centromere in chromatin segregation during mitosis, such integration events may disrupt centromere function and promote large-scale chromosomal rearrangements. Coincidentally, the human 8q24 region is also a common integration site for HPV (Akagi et al. 2023), indicating that fragile sites in the human genome may serve as integration hotspots for oncoviruses.
Full-length transcriptome sequencing was employed to investigate the regulatory effects of HBV integration on human gene expression, enabling a more comprehensive analysis of transcriptome complexity (van Dijk et al. 2023). Our analysis demonstrated that HBV preferentially integrates into intergenic regions, introns, and regions near TSSs, subsequently promoting the expression of adjacent genes. To elucidate this mechanism, HBV-Enh I was identified as a key factor in the transcriptional activation of the MYC and MYOCD promoters via dual-luciferase reporter assays. These findings align with those of previous studies on the TERT promoter (Péneau et al. 2022). Notably, HBV-Enh I sequences are highly conserved and functionally active in vivo, and their integration may contribute to the amplification of genomic regions harboring multiple proto-oncogenes (Shamay et al. 2001). In this study, we explore the regulatory role of the integrated HBV-Enh I on human gene expression, and these results suggest that integrated HBV-Enh I plays a critical role in modulating human gene expression both upstream of and downstream from the HBV integration loci.
Genes directly disrupted by HBV integration or located near integration sites exhibited aberrant expression. In paired samples 1 and 3–7, TERT, MYOCD, SEMA3C, and CCNA2 expression levels significantly changed, particularly in samples in which HBV was integrated into or near these genes. TERT is a well-documented hotspot for HBV integration and is strongly associated with HCC pathogenesis (Nault et al. 2019). In contrast, MYOCD has rarely been linked to HCC, despite its established role as a transcriptional coactivator of serum response factor, primarily in the regulation of smooth muscle–specific and cardiac muscle–specific genes (Wang et al. 2004; Yang and Shi 2021). In this study, MYOCD expression was markedly upregulated in tumor tissue from sample 3, suggesting its potential involvement in HCC progression. Functional assays confirmed that MYOCD overexpression enhances HCC cell invasion and metastasis in vitro. Similarly, SEMA3C was significantly upregulated in sample 4; this gene is a known target of SOX4, which promotes metastasis in HCC (Liao et al. 2008). Elevated SEMA3C and reduced MFN2 levels correlate with poor patient survival (Feng et al. 2016).
Importantly, large-scale SVs and altered expression of HCC-related genes associated with HBV integration were observed in all male patients, whereas fewer integration events occurred in female patients, which was consistent with prior reports. Additionally, these young male patients lacked liver cirrhosis but had poor prognoses, potentially because of rapid tumor cell proliferation and/or metastasis driven by the overexpression of certain oncogenes (Péneau et al. 2022). As reported in Asia, as many as 40% of patients with HCC develop chronic hepatitis B (CHB) without underlying cirrhosis (Takano et al. 1995; Wong et al. 2013). Although no clear reason for the absence of cirrhosis has been identified, race and family history of HCC are the main risk factors for HCC in the absence of cirrhosis in patients with CHB (Chayanupatkul et al. 2017). Among the patients included in our study, the three male patients without cirrhosis had a family history, whereas one male patient with hepatic fibrosis had no family history. Among the female patients, one with a family history developed cirrhosis; of the two without a family history, one developed cirrhosis, and the other developed hepatic fibrosis (Supplemental Table S1). The integration number of HBV-Enh I was lower in female patients than in male patients. Experimental data have demonstrated that the expression of androgen receptor (AR) and estrogen receptor 1 (ERS1 [also known as estrogen receptor alpha]) may play a role in the sex disparity in patients with HCC (Ahmed et al. 2015; Zheng et al. 2017). Furthermore, HBV-Enh I can directly bind to AR and is evolutionarily conserved across different HBV genotypes (Wang et al. 2009; Zheng et al. 2017). In HBV biology, androgen-activated AR actively binds to viral enhancer I and stimulates viral transcription comprehensively, whereas estrogen-sustained ERS1 passively prevents HNF4A from activating HBV-Enh I and subsequently subdues HBV transcription (Wang et al. 2015). Overall, the sex disparity in HBV integration may be one of the reasons for the clinical outcomes in male and female patients, such as liver cirrhosis and poor prognosis, and HBV-Enh I plays a vital role in HCC development. Nevertheless, owing to the limited number of patients with early-stage HBV-HCC patients available, our study included only seven individuals (four male and three female), which may introduce bias in the results, further studies are needed.
As a stable component of the host genome, integrated HBV DNA persists longer than cccDNA does. Although eliminating or silencing cccDNA remains the primary goal of antiviral therapies (defining a “functional cure”), current treatments do not address integrated HBV DNA. Clonal expansion of hepatocytes harboring integrated HBV genomes may serve as a stable source of viral protein expression and contribute to HCC initiation. Nevertheless, whether integrated HBV impedes functional cure remains controversial.
In summary, HBV integration drives large-scale SVs in the human genome, and the roles of integrated HBV sequences and HBV–HBV junctions cannot be overlooked. HBV integration alters transcriptional outcomes either through modifying the genomic dosage or through the cis-regulatory effects of inserted sequences. Specifically, HBV-Enh I plays a pivotal role in aberrant gene expression, frequently activating genes near integration sites. Furthermore, we identified several HCC-associated genes, such as dysregulated MYOCD, as potential molecular targets. This study elucidates the carcinogenic mechanisms of HBV by examining both viral integration and host genomic alterations, advancing our understanding of HBV-driven oncogenesis and offering new insights for HBV-HCC detection.
Methods
Patients and tissue samples
HBV-HCC tumor and paired nontumor tissue samples were obtained from seven patients with early-onset (≤30 years old) HBV-HCC who underwent surgical resection. During sequencing, tumor and paired adjacent nontumor tissues from one patient were processed separately. Specifically, the tumor tissue selected for sequencing originated from a single nodule, ensuring that no mixing of different nodules occurred prior to sequencing. This study was performed in accordance with the Helsinki declaration and was approved by the ethics committee of Changhai Hospital. Written consent was obtained from the patients. The clinicopathological information of the patients is listed in Supplemental Table S1.
DNA and RNA extraction
High-molecular-weight (HMW) gDNA and total RNA were extracted from fresh-frozen tumor and matched nontumor tissues stored in liquid nitrogen. Qubit was used for concentration and purity detection. The integrity of the extracted nucleic acids was analyzed via agarose gel electrophoresis.
DNA library construction and ONT whole-genome sequencing
In accordance with the instructions of ONT, on average, HMW gDNA was sheared randomly to 8 kb using a g-tube. Nick repair (NEB next FFPE DNA repair mix), dA tailing (NEB next Ultra II end repair/dA-tailing module), and adapter ligation (NEB next blunt/TA ligase master mix) were sequentially performed on the sheared gDNA fragments, and DNA purification was performed between each step. A Qubit fluorometer 2.0 (Thermo Fisher Scientific) was used for library quantification. ONT whole-genome sequencing was subsequently performed on the prepared DNA libraries following the manufacturer's instructions.
In silico analysis of ONT genome sequencing data
The FAST5 data were basecalled using Guppy (v4.4.1; https://nanoporetech.com) and converted to FASTQ data. The sequencing quality was evaluated by NanoQC (https://github.com/wdecoster/nanoQC) and NanoState (https://github.com/choojs/nanostate). Reads with a mean quality of less than seven were excluded by NanoFilt (De Coster et al. 2018; https://github.com/wdecoster/nanofilt). To obtain clean data, the adapters were removed, and short reads (<500 bp) were filtered out. Then, NanoPlot (https://github.com/wdecoster/NanoPlot) was subsequently used to verify the quality control of the clean data. Long-read alignment was performed with minimap2 (Li 2018; https://github.com/lh3/minimap2), with GRCh38 serving as the reference human genome. The alignment rates and coverage depths were calculated to evaluate the data quality (Supplemental Table S6).
HBV integration analysis
To analyze HBV integrations, all the HBV genome genotypes provided by NCBI were integrated as a total HBV reference for alignment. The distribution of the HBV genotype in each sample was obtained according to minmap2 and NanoCount (Gleeson et al. 2022; https://github.com/a-slide/NanoCount). The genotype with the highest abundance in each sample was considered to be the HBV genotype with which the patient was infected, and the subtype of infected HBV was determined according to the genotypes. To extract HBV reads, the clean data from each sample were aligned to the corresponding HBV subtype using minimap2, and the HBV–human chimeric reads were extracted using SAMtools (Li et al. 2009; https://github.com/samtools/samtools). To construct a specific reference sequence suitable for each sample, the human reference genome GRCh38 was subsequently combined with the HBV subtypes identified in each sample. After alignment of the human chimeric reads, the integration locations in the human genome and the integration fragment information of HBV were identified using Sniffles (The 1000 Genomes Project Consortium et al. 2015; https://github.com/fritzsedlazeck/Sniffles) with the following parameters: (1) SVs were retained when there was at least one supporting read; (2) the maximum number of split reads was seven; and (3) the minimum length of the SVs was 30 bp. The HBV–human chimeric reads were also analyzed by nucleotide BLAST (https://blast.ncbi.nlm.nih.gov/Blast.cgi) and the UCSC Genome Browser (https://genome.ucsc.edu/) to verify the precise integration breakpoints in the human genome. The breakpoints in the human genome with HBV integration were annotated using the R package “annotatr” (Cavalcante and Sartor 2017; https://bioconductor.org/packages/release/bioc/html/annotatr.html). The coverage plots and alignments of the HBV–human chimeric reads were visualized by the Integrative Genomics Viewer (IGV) (Robinson et al. 2011).
SV calling and analysis
To detect SV among the human genome, the SVs were called by Sniffle with the following parameters: (1) SVs were retained when there were at least three supporting reads, and the maximum number of split reads was seven; and (2) the minimum length of the SVs was 30 bp. All SVs were annotated as deletions (DELs), duplications (DUPs), insertions (INSs), or inversions (INVs). The Circos (Krzywinski et al. 2009) plots and bootstrap analysis results were illustrated by in-house scripts (Supplemental Code).
CNV calling and analysis
Human CNV detection was performed using QDNA-seq software (https://github.com/ccagc/QDNAseq); the genome was divided into 1000-sized bins; and the alpha value of the circular binary segmentation of the DNA copy package was less than 0.05 to accept the changed point. The chimeric read number was calculated when the breakpoints in the human genome were within regions with CNVs.
The integrated HBV copy numbers at each integration site were quantified as follows: If the aligned HBV sequence length accounted for ≥60% of the HBV reference genome length (3215 bp), it was considered one copy. Multiple overlapping segments each >60% coverage were counted as multiple copies. If none of the integrated HBV fragments at a given site had >60% coverage, the site was still counted as one copy.
ONT full-length transcriptome sequencing and analysis
The extracted RNA was converted to cDNA using maxima H minus reverse transcriptase (Thermo Scientific), after which cDNA repair and end repair were performed. The cDNA was purified using magnetic beads between each step. After adapter ligation, ONT full-length transcriptome sequencing was performed. The clean transcriptome reads were aligned with the “gencode.v38” package of minimap2. The data quality was checked (Supplemental Table S7). The relative abundance of genes was determined by NanoCount. Differential gene expression was analyzed using EBSeq (Leng et al. 2013) by the R package (R Core Team 2024) and extracted by |log2FC| > 1 and FDR value < 0.1. TBtools was used for gene expression heatmap illustrating (Chen et al. 2023).
Polymerase chain reaction and Sanger sequencing
The full-length integrated HBV sequence inserted between MYC and PVT1 reported in our previous study on early-onset HCC (Yan et al. 2015) was obtained through genome walking combined with Sanger sequencing. In this step, the nested PCRs were performed using a genome walking kit (Takara Biotechnology) according to the manufacturer's instructions. The primers used are shown in Supplemental Table S8.
The chimeric reads were randomly selected for PCR validation. The PCR primers used for validation of the chimeric reads obtained through ONT sequencing were designed according to the BLAST results (Supplemental Table S3), and PrimeSTAR max DNA polymerase (Takara Biotechnology) and Advantage genomic LA polymerase mix (Takara Biotechnology) were used for PCR amplification according to the length of the inserted HBV sequences.
Agarose gel purification and extraction (high pure PCR Product purification kit, Roch) were performed after the PCRs, and the products were sent for Sanger sequencing for validation.
Cell lines and cell culture
Hep G2, HuH-7, HCCLM3, MHCC97-H, HT-29, HCT 116, and 293T cells were purchased from the National Collection of Authenticated Cell Cultures. All the cells were cultured in a humidified incubator at 37°C and 5% (v/v) CO2. Dulbecco's Modified Eagle Medium (DMEM; Corning) supplemented with 10% fetal bovine serum (Gibco) and 100 U/mL penicillin/streptomycin (NCM Biotech) was used.
Dual-luciferase assay
The reporter plasmids were constructed using a series of pGL3 reporter vectors (Promega) according to the manufacturers’ guidelines, and the inserted sequences and cleavage sites are shown in Supplemental Table S5. The pRL-TK Renilla vector (Promega) was used as an internal reference plasmid. Hep G2, HuH-7, HCCLM3, MHCC97-H, HT-29, HCT 116, and 293T cells were seeded in 24-well plates. When the cells were 70%–80% confluent, the constructed pGL3-series plasmids and the pRL-TK Renilla vector were cotransfected into the above cells at a ratio of 100 to one. The transfected cells were cultured for 36 h and subsequently lysed, after which luciferase activity was detected using a dual-luciferase reporter assay system (Promega) according to the manufacturer's instructions. Renilla luciferase was used as the internal reference.
Establishment of stable MYOCD-overexpressing cell lines
The full-length MYOCD mRNA sequence (NM_001146312.3) was cloned and inserted into an expression vector to generate the transfer plasmid PGMLV-CMV-H_MYOCD-3×Flag-PGK-Puro, which was subsequently cotransfected with the packaging plasmids for lentivirus packaging. Moreover, a negative lentivirus control was constructed using the empty vector as a transfer plasmid. The constructed lentiviruses were used to infect HuH-7 and Hep G2 cells, and stable MYOCD-overexpressing cells were selected through puromycin selection.
RNA extraction and qRT–PCR
RNA was extracted from the cultured cells using an RNAfast200 extraction kit (Fastgen). A PrimeScript RT reagent kit (perfect real time; Takara) was used for cDNA synthesis, and TB green premix Ex Taq II (Tli RNaseH plus; Takara) was used for quantitative real-time (RT) PCR detection. The endogenous control gene for normalizing the expression of the tested genes was actin beta (ACTB). The primers used in this study are shown in Supplemental Table S8.
Western blot analysis
The cultured cells were lysed for protein collection, and western blotting was subsequently performed using the protocol described by Wang et al. (2016). The antibodies used were as follows: anti-MYOCD antibody (Sigma-Aldrich), anti-GAPDH antibody (Proteintech), goat antirabbit antibody (Proteintech), and goat antimouse antibody. The antibodies used in this study are shown in Supplemental Table S9.
Cell migration and invasion analysis
Transwell chambers coated with or without Matrigel (CorningA) were used for cell migration and invasion assays, respectively. In the experiments, 1 × 10⁵ cells were prepared and suspended in 100 µL or 500 µL of DMEM without FBS and then seeded in the upper chambers, and the lower chambers were filled with 500 µL or 750 µL of DMEM containing 10% FBS for migration or invasion assays, respectively. After the cells were incubated at 37°C, 4% paraformaldehyde was used for cell fixation, and 0.5% crystal violet was used for cell staining. The inwall-stained cells were removed with cotton swabs, after which the cells that were fixed outside of the chamber were photographed and quantified.
Statistical analysis
The data are presented as the mean ± SD of three or more independent experiments. ANOVA and t-test were used for parametric experimental data analysis. Statistical analysis was performed using GraphPad Prism 8.0 software (GraphPad Software) and R packages. All reported P values are two-sided, and P < 0.05 was considered to indicate statistical significance.
Data access
All raw and processed sequencing data generated in this study have been submitted to the Genome Sequence Archive (Chen et al. 2021) in the National Genomics Data Center (CNCB-NGDC Members and Partners 2022), China National Center for Bioinformation/Beijing Institute of Genomics, Chinese Academy of Sciences (GSA-Human, https://ngdc.cncb.ac.cn/gsa-human) under accession number HRA006617.
Competing interest statement
The authors declare no competing interests.
Acknowledgments
We thank all the patients involved in this study. This study was supported by fundings provided by the National Natural Science Foundation of China, grants no. 82273465, 8187225.
Author contributions: Y.W., D.Y., Y.M., Z.D.F., and D.W. performed the bioinformatic analyses included in this work. Y.W. and D.W. performed the wet-laboratory experiments. Y.Y., H.L.Y., and J.L. recruited and enrolled patients and provided clinical assessment. H.L.Y., D.Y., and Y.W. designed the study and oversaw the interpretation of data. Y.W. and H.L.Y. drafted and revised the manuscript. H.L.Y. acquired funding. All authors read and approved the final version of the manuscript.
Notes
[1] Supplementary material [Supplemental material is available for this article.]
[2] Article published online before print. Article, supplemental material, and publication date are at https://www.genome.org/cgi/doi/10.1101/gr.279889.124.
References
- ↵The 1000 Genomes Project Consortium, Auton A, Brooks LD, Durbin RM, Garrison EP, Kang HM, Korbel JO, Marchini JL, McCarthy S, McVean GA, 2015. A global reference for human genetic variation. Nature 526: 68–74. 10.1038/nature15393
- ↵Ahmed HH, Shousha WG, Shalby AB, El-Mezayen HA, Ismaiel NN, Mahmoud NS. 2015. Implications of sex hormone receptor gene expression in the predominance of hepatocellular carcinoma in males: role of natural products. Asian Pac J Cancer Prev 16: 4949–4954. 10.7314/APJCP.2015.16.12.4949
- ↵Akagi K, Symer DE, Mahmoud M, Jiang B, Goodwin S, Wangsa D, Li Z, Xiao W, Dunn JD, Ried T, 2023. Intratumoral heterogeneity and clonal evolution induced by HPV integration. Cancer Discov 13: 910–927. 10.1158/2159-8290.CD-22-0900
- ↵Álvarez EG, Demeulemeester J, Otero P, Jolly C, García-Souto D, Pequeño-Valtierra A, Zamora J, Tojo M, Temes J, Baez-Ortega A, 2021. Aberrant integration of hepatitis B virus DNA promotes major restructuring of human hepatocellular carcinoma genome architecture. Nat Commun 12: 6910. 10.1038/s41467-021-26805-8
- ↵Bray F, Laversanne M, Sung H, Ferlay J, Siegel RL, Soerjomataram I, Jemal A. 2024. Global cancer statistics 2022: GLOBOCAN estimates of incidence and mortality worldwide for 36 cancers in 185 countries. CA Cancer J Clin 74: 229–263. 10.3322/caac.21834
- ↵Cavalcante RG, Sartor MA. 2017. annotatr: genomic regions in context. Bioinformatics 33: 2381–2383. 10.1093/bioinformatics/btx183
- ↵Chayanupatkul M, Omino R, Mittal S, Kramer JR, Richardson P, Thrift AP, El-Serag HB, Kanwal F. 2017. Hepatocellular carcinoma in the absence of cirrhosis in patients with chronic hepatitis B virus infection. J Hepatol 66: 355–362. 10.1016/j.jhep.2016.09.013
- ↵Chen X, Kost J, Sulovari A, Wong N, Liang WS, Cao J, Li D. 2019. A virome-wide clonal integration analysis platform for discovering cancer viral etiology. Genome Res 29: 819–830. 10.1101/gr.242529.118
- ↵Chen T, Chen X, Zhang S, Zhu J, Tang B, Wang A, Dong L, Zhang Z, Yu C, Sun Y, 2021. The Genome Sequence Archive family: toward explosive data growth and diverse data types. Genomics Proteomics Bioinformatics 19: 578–583. 10.1016/j.gpb.2021.08.001
- ↵Chen C, Wu Y, Li J, Wang X, Zeng Z, Xu J, Liu Y, Feng J, Chen H, He Y, 2023. TBtools-II: a “one for all, all for one” bioinformatics platform for biological big-data mining. Mol Plant 16: 1733–1742. 10.1016/j.molp.2023.09.010
- ↵Chen L, Zhang C, Xue R, Liu M, Bai J, Bao J, Wang Y, Jiang N, Li Z, Wang W, 2024. Deep whole-genome analysis of 494 hepatocellular carcinomas. Nature 627: 586–593. 10.1038/s41586-024-07054-3
- ↵CNCB-NGDC Members and Partners. 2022. Database resources of the national genomics data center, China national center for bioinformation in 2022. Nucleic Acids Res 50: D27–D38. 10.1093/nar/gkab951
- ↵De Coster W, D'Hert S, Schultz DT, Cruts M, Van Broeckhoven C. 2018. NanoPack: visualizing and processing long-read sequencing data. Bioinformatics 34: 2666–2669. 10.1093/bioinformatics/bty149
- ↵Duan M, Hao J, Cui S, Worthley DL, Zhang S, Wang Z, Shi J, Liu L, Wang X, Ke A, 2018. Diverse modes of clonal evolution in HBV-related hepatocellular carcinoma revealed by single-cell genome sequencing. Cell Res 28: 359–373. 10.1038/cr.2018.11
- ↵Feng X, Zhu K, Liu J, Chen J, Tang J, Liang Y, Jin R, Liang X, Cai X. 2016. The evaluative value of Sema3C and MFN2 co-expression detected by immunohistochemistry for prognosis in hepatocellular carcinoma patients after hepatectomy. Onco Targets Ther 9: 3213–3221. 10.2147/OTT.S98322
- ↵Gleeson J, Leger A, Prawer YDJ, Lane TA, Harrison PJ, Haerty W, Clark MB. 2022. Accurate expression quantification from nanopore direct RNA sequencing with NanoCount. Nucleic Acids Res 50: e19. 10.1093/nar/gkab1129
- ↵Jiang Z, Jhunjhunwala S, Liu J, Haverty PM, Kennemer MI, Guan Y, Lee W, Carnevali P, Stinson J, Johnson S, 2012. The effects of hepatitis B virus integration into the genomes of hepatocellular carcinoma patients. Genome Res 22: 593–601. 10.1101/gr.133926.111
- ↵Jiao J, Hong S, Zhang J, Ma L, Sun Y, Zhang D, Shen B, Zhu C. 2012. Opsin3 sensitizes hepatocellular carcinoma cells to 5-fluorouracil treatment by regulating the apoptotic pathway. Cancer Lett 320: 96–103. 10.1016/j.canlet.2012.01.035
- ↵Krzywinski M, Schein J, Birol I, Connors J, Gascoyne R, Horsman D, Jones SJ, Marra MA. 2009. Circos: an information aesthetic for comparative genomics. Genome Res 19: 1639–1645. 10.1101/gr.092759.109
- ↵Leng N, Dawson JA, Thomson JA, Ruotti V, Rissman AI, Smits BM, Haag JD, Gould MN, Stewart RM, Kendziorski C. 2013. EBSeq: an empirical Bayes hierarchical model for inference in RNA-seq experiments. Bioinformatics 29: 1035–1043. 10.1093/bioinformatics/btt087
- ↵Levrero M, Zucman-Rossi J. 2016. Mechanisms of HBV-induced hepatocellular carcinoma. J Hepatol 64: S84–S101. 10.1016/j.jhep.2016.02.021
- ↵Li H. 2018. Minimap2: pairwise alignment for nucleotide sequences. Bioinformatics 34: 3094–3100. 10.1093/bioinformatics/bty191
- ↵Li H, Handsaker B, Wysoker A, Fennell T, Ruan J, Homer N, Marth G, Abecasis G, Durbin R, 1000 Genome Project Data Processing Subgroup. 2009. The Sequence Alignment/Map format and SAMtools. Bioinformatics 25: 2078–2079. 10.1093/bioinformatics/btp352
- ↵Li W, Wei W, Hou F, Xu H, Cui X. 2022. The integration model of hepatitis B virus genome in hepatocellular carcinoma cells based on high-throughput long-read sequencing. Genomics 114: 23–30. 10.1016/j.ygeno.2021.11.025
- ↵Liao YL, Sun YM, Chau GY, Chau YP, Lai TC, Wang JL, Horng JT, Hsiao M, Tsou AP. 2008. Identification of SOX4 target genes using phylogenetic footprinting-based prediction from expression microarrays suggests that overexpression of SOX4 potentiates metastasis in hepatocellular carcinoma. Oncogene 27: 5578–5589. 10.1038/onc.2008.168
- ↵Llovet JM, Kelley RK, Villanueva A, Singal AG, Pikarsky E, Roayaie S, Lencioni R, Koike K, Zucman-Rossi J, Finn RS. 2021. Hepatocellular carcinoma. Nat Rev Dis Primers 7: 6. 10.1038/s41572-020-00240-3
- ↵Miao WG, Zhou JY, Han RQ. 2024. [Analysis of global liver cancer statistics]. Zhonghua Liu Xing Bing Xue Za Zhi 45: 865–869. 10.3760/cma.j.cn112338-20231027-00251
- ↵Midorikawa Y, Yamamoto S, Ishikawa S, Kamimura N, Igarashi H, Sugimura H, Makuuchi M, Aburatani H. 2006. Molecular karyotyping of human hepatocellular carcinoma using single-nucleotide polymorphism arrays. Oncogene 25: 5581–5590. 10.1038/sj.onc.1209537
- ↵Nault JC, Ningarhari M, Rebouissou S, Zucman-Rossi J. 2019. The role of telomeres and telomerase in cirrhosis and liver cancer. Nat Rev Gastroenterol Hepatol 16: 544–558. 10.1038/s41575-019-0165-3
- ↵Péneau C, Imbeaud S, La Bella T, Hirsch TZ, Caruso S, Calderaro J, Paradis V, Blanc JF, Letouzé E, Nault JC, 2022. Hepatitis B virus integrations promote local and distant oncogenic driver alterations in hepatocellular carcinoma. Gut 71: 616–626. 10.1136/gutjnl-2020-323153
- ↵Qian Z, Liang J, Huang R, Song W, Ying J, Bi X, Zhao J, Shi Z, Liu W, Liu J, 2024. HBV integrations reshaping genomic structures promote hepatocellular carcinoma. Gut 73: 1169–1182. 10.1136/gutjnl-2023-330414
- ↵R Core Team. 2024. R: a language and environment for statistical computing. R Foundation for Statistical Computing, Vienna. https://www.R-project.org/.
- ↵Ren H, Chen X, Wang J, Chen Y, Hafiz A, Xiao Q, Fu S, Madireddy A, Li WV, Shi X, 2023. Temporal and structural patterns of hepatitis B virus integrations in hepatocellular carcinoma. J Med Virol 95: e29187. 10.1002/jmv.29187
- ↵Robinson JT, Thorvaldsdóttir H, Winckler W, Guttman M, Lander ES, Getz G, Mesirov JP. 2011. Integrative genomics viewer. Nat Biotechnol 29: 24–26. 10.1038/nbt.1754
- ↵Rumgay H, Arnold M, Ferlay J, Lesi O, Cabasag CJ, Vignat J, Laversanne M, McGlynn KA, Soerjomataram I. 2022. Global burden of primary liver cancer in 2020 and predictions to 2040. J Hepatol 77: 1598–1606. 10.1016/j.jhep.2022.08.021
- ↵Seto WK, Lo YR, Pawlotsky JM, Yuen MF. 2018. Chronic hepatitis B virus infection. Lancet 392: 2313–2324. 10.1016/S0140-6736(18)31865-8
- ↵Shamay M, Agami R, Shaul Y. 2001. HBV integrants of hepatocellular carcinoma cell lines contain an active enhancer. Oncogene 20: 6811–6819. 10.1038/sj.onc.1204879
- ↵Shi Z, Gan G, Gao X, Chen F, Mi J. 2022. Kynurenine catabolic enzyme KMO regulates HCC growth. Clin Transl Med 12: e697. 10.1002/ctm2.697
- ↵Shoshani O, Brunner SF, Yaeger R, Ly P, Nechemia-Arbely Y, Kim DH, Fang R, Castillon GA, Yu M, Li JSZ, 2021. Chromothripsis drives the evolution of gene amplification in cancer. Nature 591: 137–141. 10.1038/s41586-020-03064-z
- ↵Sun Z, Chen T, Thorgeirsson SS, Zhan Q, Chen J, Park JH, Lu P, Hsia CC, Wang N, Xu L, 2013. Dramatic reduction of liver cancer incidence in young adults: 28 year follow-up of etiological interventions in an endemic area of China. Carcinogenesis 34: 1800–1805. 10.1093/carcin/bgt007
- ↵Sung WK, Zheng H, Li S, Chen R, Liu X, Li Y, Lee NP, Lee WH, Ariyaratne PN, Tennakoon C, 2012. Genome-wide survey of recurrent HBV integration in hepatocellular carcinoma. Nat Genet 44: 765–769. 10.1038/ng.2295
- ↵Takano S, Yokosuka O, Imazeki F, Tagawa M, Omata M. 1995. Incidence of hepatocellular carcinoma in chronic hepatitis B and C: a prospective study of 251 patients. Hepatology 21: 650–655. 10.1002/hep.1840210308
- ↵Tanaka H, Yao MC. 2009. Palindromic gene amplification: an evolutionarily conserved role for DNA inverted repeats in the genome. Nat Rev Cancer 9: 216–224. 10.1038/nrc2591
- ↵van Buuren N, Ramirez R, Soulette C, Suri V, Han D, May L, Turner S, Parvangada PC, Martin R, Chan HLY, 2022. Targeted long-read sequencing reveals clonally expanded HBV-associated chromosomal translocations in patients with chronic hepatitis B. JHEP Rep 4: 100449. 10.1016/j.jhepr.2022.100449
- ↵van Dijk EL, Naquin D, Gorrichon K, Jaszczyszyn Y, Ouazahrou R, Thermes C, Hernandez C. 2023. Genomics in the long-read sequencing era. Trends Genet 39: 649–671. 10.1016/j.tig.2023.04.006
- ↵Wan DW, Tzimas D, Smith JA, Kim S, Araujo J, David R, Lobach I, Sarpel U. 2011. Risk factors for early-onset and late-onset hepatocellular carcinoma in Asian immigrants with hepatitis B in the United States. Am J Gastroenterol 106: 1994–2000. 10.1038/ajg.2011.302
- ↵Wang Z, Wang DZ, Hockemeyer D, McAnally J, Nordheim A, Olson EN. 2004. Myocardin and ternary complex factors compete for SRF to control smooth muscle gene expression. Nature 428: 185–189. 10.1038/nature02382
- ↵Wang HC, Huang W, Lai MD, Su IJ. 2006. Hepatitis B virus pre-S mutants, endoplasmic reticulum stress and hepatocarcinogenesis. Cancer Sci 97: 683–688. 10.1111/j.1349-7006.2006.00235.x
- ↵Wang SH, Yeh SH, Lin WH, Wang HY, Chen DS, Chen PJ. 2009. Identification of androgen response elements in the enhancer I of hepatitis B virus: a mechanism for sex disparity in chronic hepatitis B. Hepatology 50: 1392–1402. 10.1002/hep.23163
- ↵Wang SH, Chen PJ, Yeh SH. 2015. Gender disparity in chronic hepatitis B: mechanisms of sex hormones. J Gastroenterol Hepatol 30: 1237–1245. 10.1111/jgh.12934
- ↵Wang L, Yang H, Lei Z, Zhao J, Chen Y, Chen P, Li C, Zeng Y, Liu Z, Liu X, 2016. Repression of TIF1gamma by SOX2 promotes TGF-beta-induced epithelial-mesenchymal transition in non-small-cell lung cancer. Oncogene 35: 867–877. 10.1038/onc.2015.141
- ↵Wen Z, Qi J, Ruan Q, Wen C, Huang G, Yang Z, Xu J, Chen Z, Deng J. 2025. Formosanin C induces autophagy-mediated cell death in hepatocellular carcinoma through activating DUSP1/AMPK/ULK1/Beclin1 signaling pathway. Phytomedicine 138: 156404. 10.1016/j.phymed.2025.156404
- ↵Wong N, Lai P, Pang E, Leung TW, Lau JW, Johnson PJ. 2000. A comprehensive karyotypic study on human hepatocellular carcinoma by spectral karyotyping. Hepatology 32: 1060–1068. 10.1053/jhep.2000.19349
- ↵Wong GL, Chan HL, Chan HY, Tse PC, Tse YK, Mak CW, Lee SK, Ip ZM, Lam AT, Iu HW, 2013. Accuracy of risk scores for patients with chronic hepatitis B receiving entecavir treatment. Gastroenterology 144: 933–944. 10.1053/j.gastro.2013.02.002
- ↵Xie M, Guo H, Lou G, Yao J, Liu Y, Sun Y, Yang Z, Zheng M. 2021. Neddylation inhibitor MLN4924 has anti-HBV activity via modulating the ERK-HNF1alpha-C/EBPalpha-HNF4alpha axis. J Cell Mol Med 25: 840–854. 10.1111/jcmm.16137
- ↵Yan H, Yang Y, Zhang L, Tang G, Wang Y, Xue G, Zhou W, Sun S. 2015. Characterization of the genotype and integration patterns of hepatitis B virus in early- and late-onset hepatocellular carcinoma. Hepatology 61: 1821–1831. 10.1002/hep.27722
- ↵Yang Q, Shi W. 2021. Rho/ROCK-MYOCD in regulating airway smooth muscle growth and remodeling. Am J Physiol Lung Cell Mol Physiol 321: L1–L5. 10.1152/ajplung.00034.2021
- ↵Zhang B, Zhang B, Zhang Z, Huang Z, Chen Y, Chen M, Bie P, Peng B, Wu L, Wang Z, 2018. 42,573 cases of hepatectomy in China: a multicenter retrospective investigation. Sci China Life Sci 61: 660–670. 10.1007/s11427-017-9259-9
- ↵Zhang C, Huang S, Zhuang H, Ruan S, Zhou Z, Huang K, Ji F, Ma Z, Hou B, He X. 2020. YTHDF2 promotes the liver cancer stem cell phenotype and cancer metastasis by regulating OCT4 expression via m6A RNA methylation. Oncogene 39: 4507–4518. 10.1038/s41388-020-1303-7
- ↵Zhao LH, Liu X, Yan HX, Li WY, Zeng X, Yang Y, Zhao J, Liu SP, Zhuang XH, Lin C, 2016. Genomic and oncogenic preference of HBV integration in hepatocellular carcinoma. Nat Commun 7: 12992. 10.1038/ncomms12992
- ↵Zhao K, Liu A, Xia Y. 2020. Insights into hepatitis B virus DNA integration-55 years after virus discovery. Innovation (Camb) 1: 100034. 10.1016/j.xinn.2020.100034
- ↵Zheng B, Zhu YJ, Wang HY, Chen L. 2017. Gender disparity in hepatocellular carcinoma (HCC): multiple underlying mechanisms. Sci China Life Sci 60: 575–584. 10.1007/s11427-016-9043-9
- ↵Zhou M, Xia Y, Wang S. 2025. IL35 modulates HBV-related HCC progression via IL6-STAT3 signaling. Sci Rep 15: 6293. 10.1038/s41598-025-89015-y
- ↵Zhuo Z, Rong W, Li H, Li Y, Luo X, Liu Y, Tang X, Zhang L, Su F, Cui H, 2021. Long-read sequencing reveals the structural complexity of genomic integration of HBV DNA in hepatocellular carcinoma. NPJ Genom Med 6: 84. 10.1038/s41525-021-00245-1