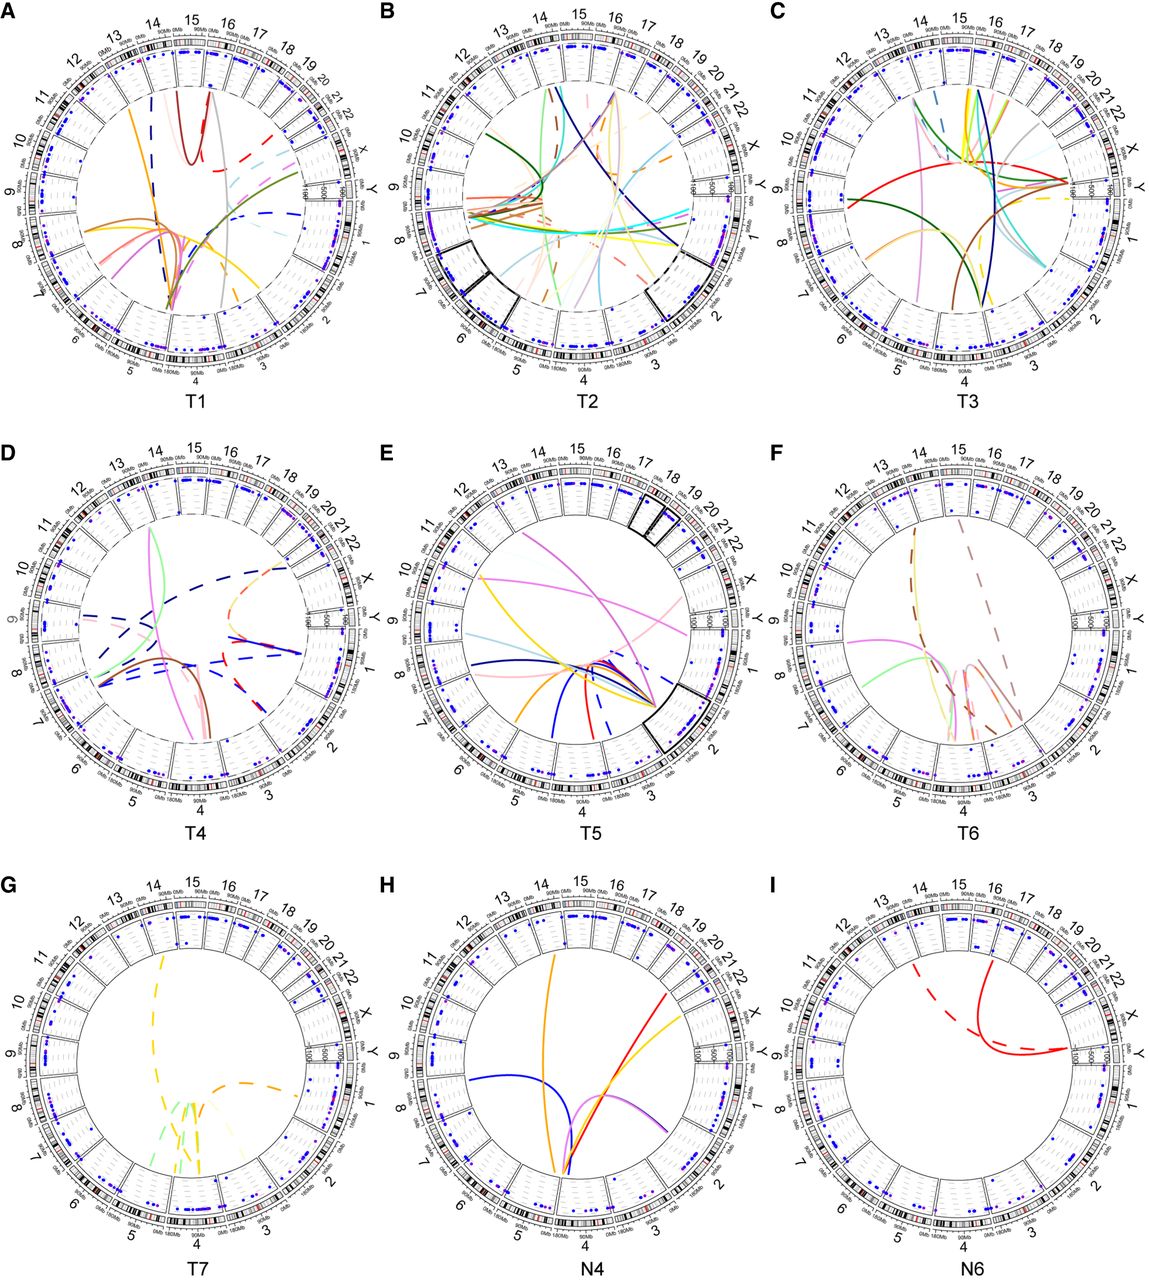
Figure 5.
HBV integration–mediated chromosomal translocations. (A–G) Circos plots for samples T1–T7, respectively. (H,I) Circos plots for samples N4 and N6, respectively. The schematic illustrates the following: (inner circle) translocations between chromosomes bridged by HBV insertions (colored by genomic position), with solid lines indicating human-HBV connections and dashed lines representing interchromosomal connections; (middle circle) sample-specific CNV profiles; and (outer circle) chromosomal ideograms.