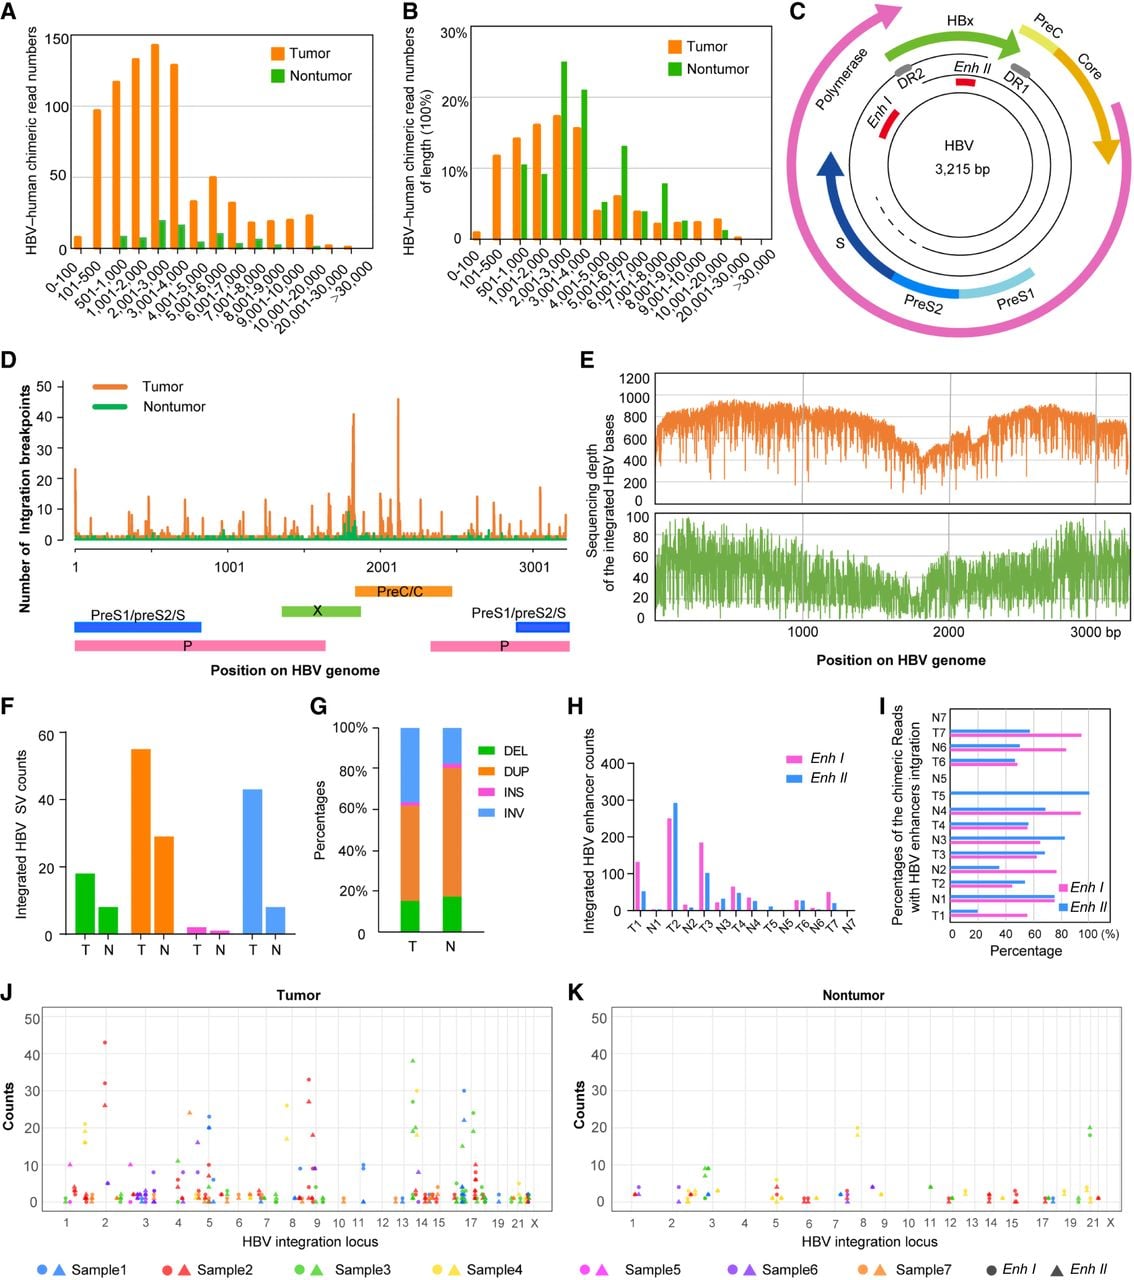
Characteristics of the integrated HBV sequences. (A,B) Lengths of the integrated HBV sequences in the tumor and paired nontumor samples. (C) HBV genome map. (D) Distribution of the HBV integration breakpoints in the HBV genome. (E) Sequencing depth of the integrated HBV bases. The x-axis represents the genomic position of the mapped bases in the HBV genome; the y-axis represents the sequencing depth for each HBV base. (F,G) Counts (F) and percentages (G) of the structural variations of the integrated HBV sequences in the HBV–human chimeric reads of tumor (T) and nontumor (N). (H) Counts of the chimeric reads with HBV enhancers inserted. (I) The proportion of the chimeric read counts with HBV enhancers integration compared with the total chimeric read counts in each sample. (J,K) The number of detected enhancers at each integration locus, with colors representing different samples, solid circles indicating HBV-Enh I, and solid triangles indicating HBV-Enh II.