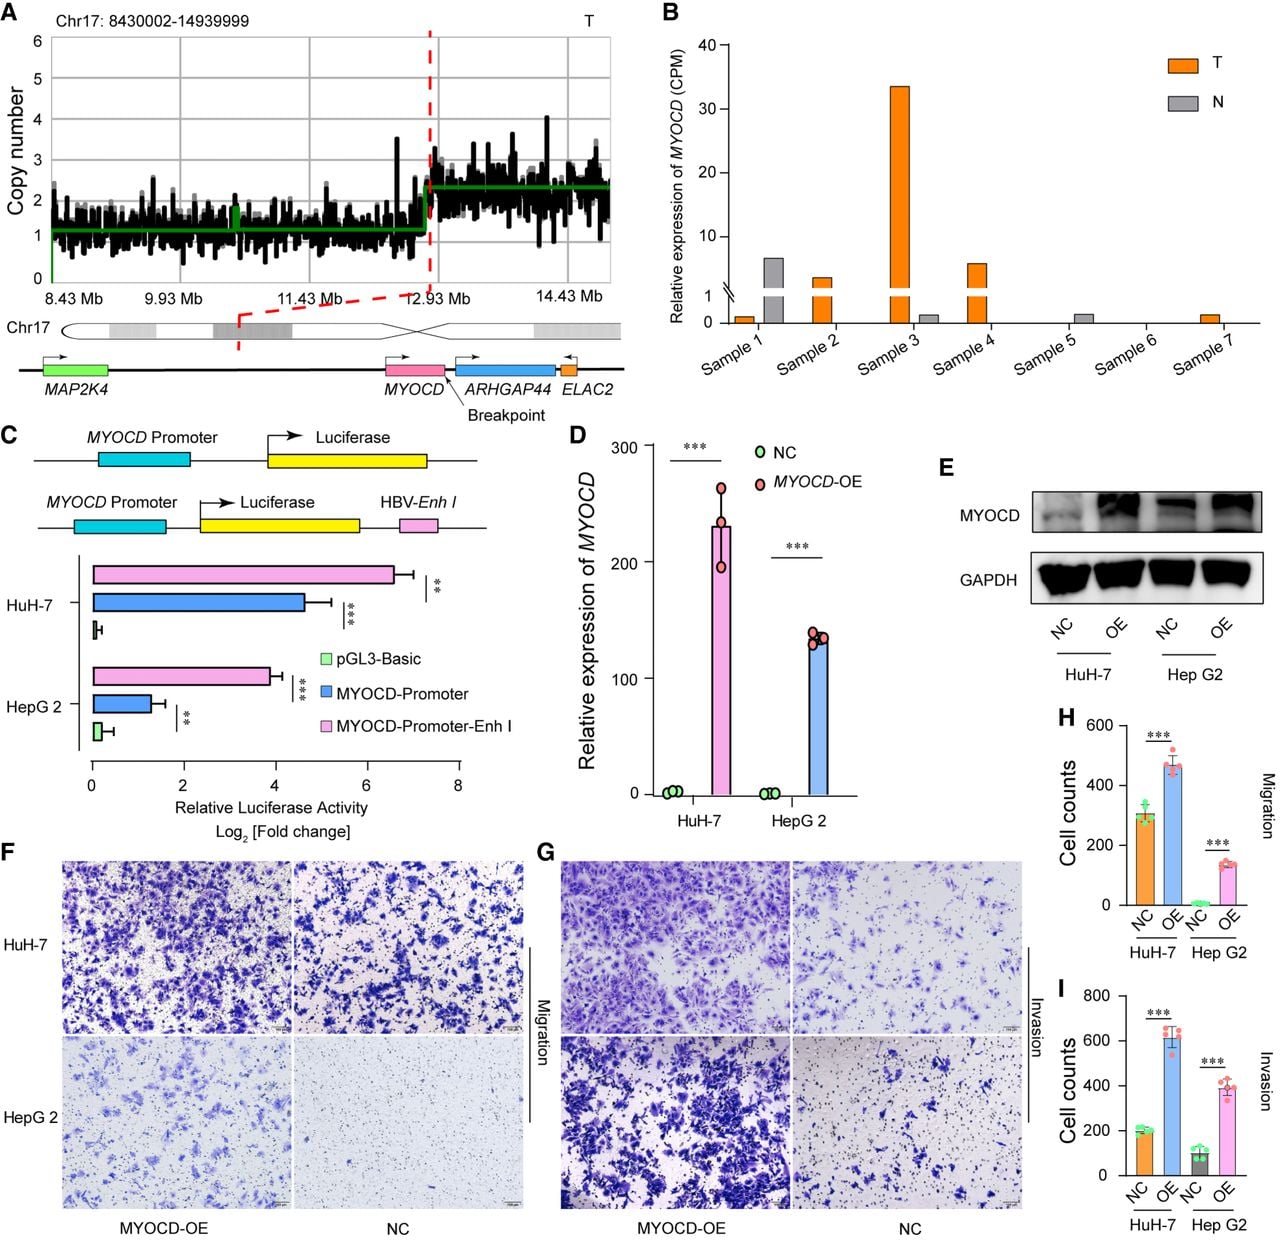
Functional analysis of aberrantly expressed MYOCD. (A) Schematic representation of the HBV integration locus located in the MYOCD gene region (bottom) and the corresponding CNV (top). (B) Relative expression levels of MYOCD in the seven samples. (C) Plasmid constructs containing the MYOCD promoter (top) and the relative luciferase activity of the constructed plasmids in the HuH-7 and Hep G2 cell lines (bottom). (D,E) MYOCD expression levels were determined by qRT–PCR and western blotting in the HCC lines HuH-7 and Hep G2 infected with the MYOCD overexpression virus or mock vector virus. The data are presented as the mean ± SEM (n = 3). (F–I) Migration and invasion assays of HuH-7 and Hep G2 cells infected with the MYOCD overexpression virus or mock vector virus (n = 5 for migration and invasion assays). One-way ANOVA was used to compare the relative luciferase activity. Two-sample t-tests were used to compare the differences between the overexpression and control groups. (**) P < 0.005, (***) P < 0.001.