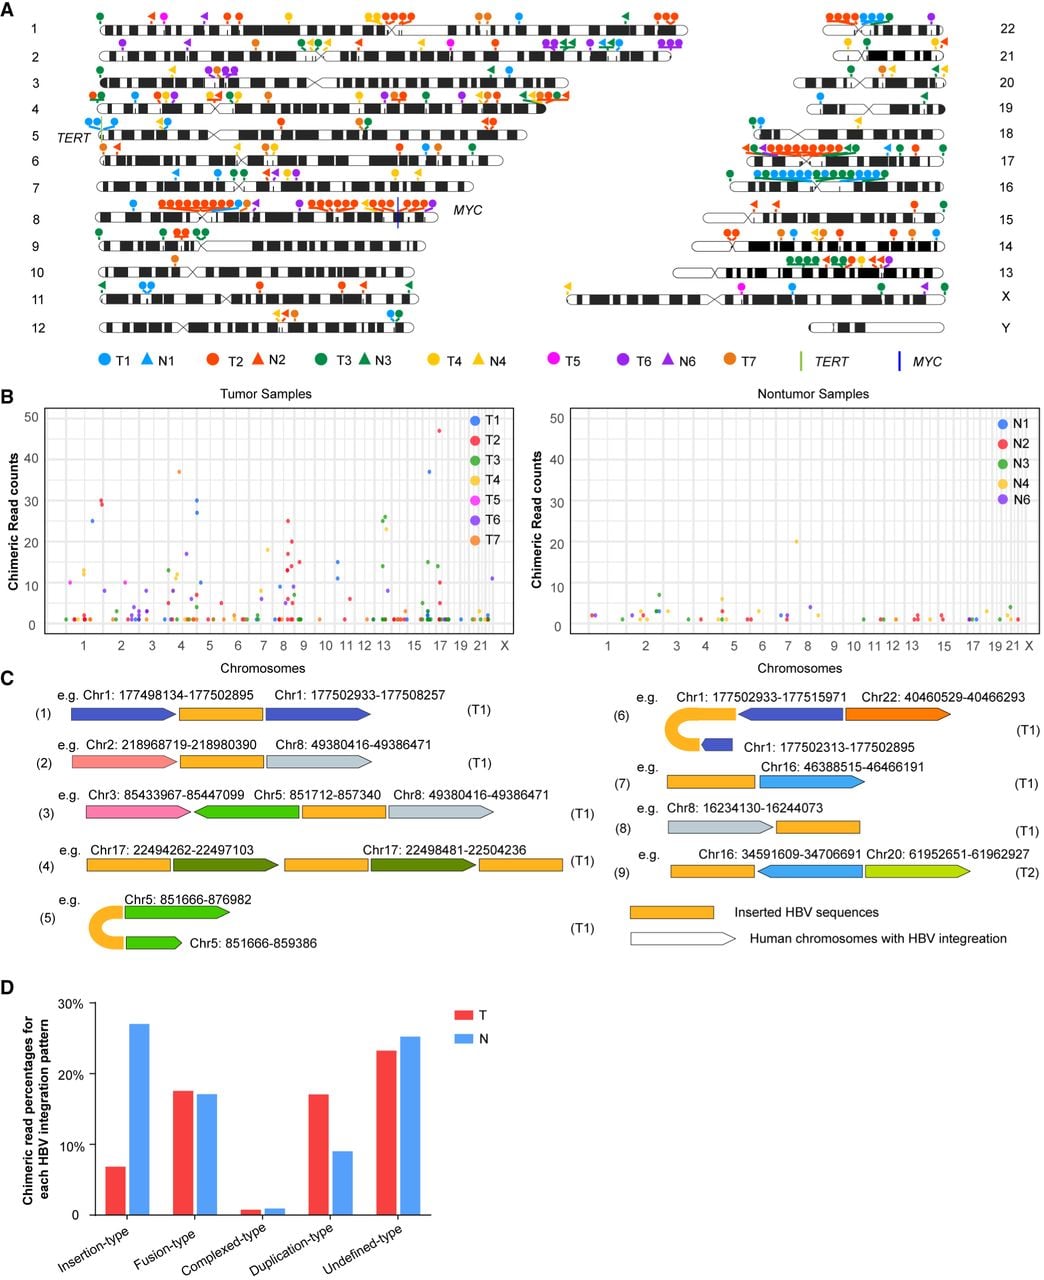
Characteristics of HBV integration in the human genome. (A) Distribution of human genome breakpoints with respect to HBV integration. (T) Tumor sample (filled circle); (N) paired nontumor sample (filled triangle). To clarify breakpoint localization, adjacent breakpoints within 10,000 bp were clustered, and median breakpoints are displayed. (TERT and MYC gene loci are indicated on the ideograms with green and purple bars, respectively.) (B) Frequency of HBV–human chimeric reads per breakpoint in tumor and nontumor samples. (C) Chromosomal distribution of HBV–human chimeric reads. Dark gold rectangles denote integrated HBV sequences; pentagons represent human genomic regions with HBV integration (colors indicate distinct chromosomes). The arrows mark the 3′-end. (D) Proportion of integration loci classified into the five categories depicted in panel C.