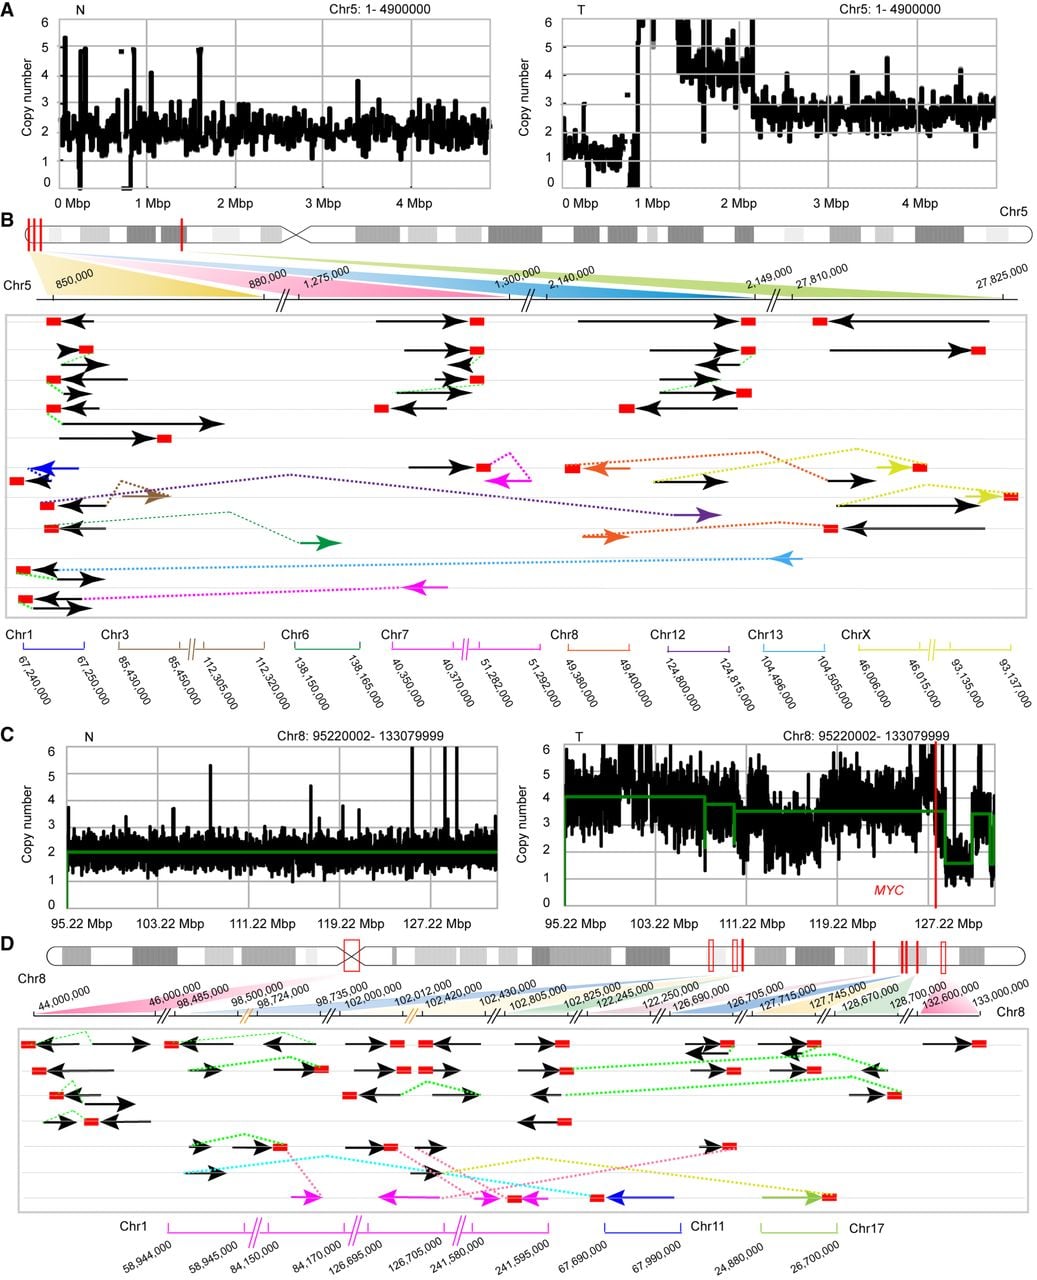
Figure 6.
HBV-mediated complex chromosomal rearrangements. (A,C) CN profiles comparing nontumor (left) versus tumor tissue (right) from sample 1 (A) and sample 2 (C). (B,D) Schematic diagrams of HBV integration patterns on Chr 5 (B) and Chr 8 (D). Red rectangles denote integrated HBV sequences; solid lines indicate human–HBV junctions (arrowheads show breakpoint orientations); and colored dashed lines represent connections between reference segments and human sequences.