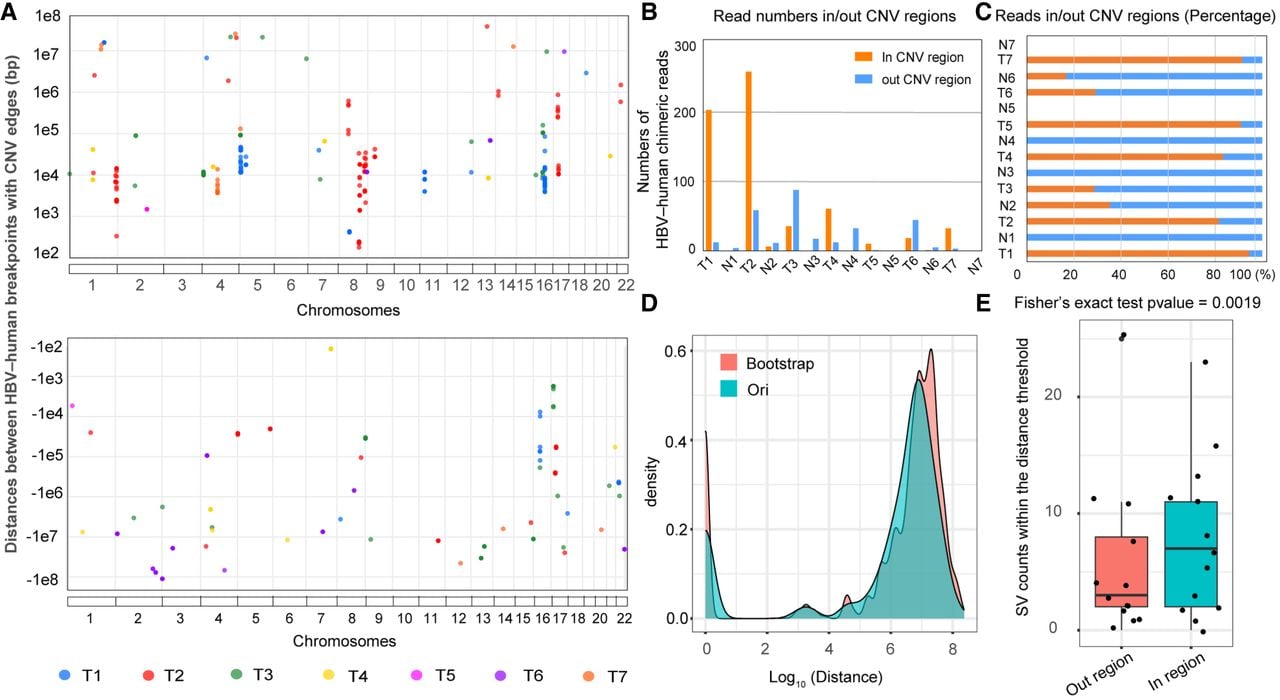
Relationships between HBV integration and structural variations (SVs) in HCC tumor and paired nontumor samples. (A) Distances between HBV–human breakpoints and CNV boundaries. The y-axis indicates the distances (in basepairs) from breakpoints to CNV edges, and the x-axis represents their genomic locations. The breakpoints were classified as follows: (1) if either breakpoint of an HBV–human chimeric read fell within a CNV region, the read was considered CNV-associated, and the breakpoint closest to the CNV boundary was used for distance calculation; (2) if both breakpoints resided within CNVs, the one closer to the edge was selected; and (3) if neither breakpoint overlapped a CNV, the distance was assigned a negative value. (B) Counts of HBV–human chimeric reads inside versus outside CNV regions. (C) Proportions of HBV–human chimeric reads within or outside CNV regions. (D,E) Bootstrap analysis of the nearest distances between SVs and HBV integration sites, along with comparisons of the SV frequencies inside and outside of 10 Mb regions (Fisher's exact test, P = 0.0019).